This research report was produced by The REIT Forum with assistance from Hoya Capital Real Estate.
The goal of this series is to allow us to rapidly inform readers about the things we are seeing in any given sector (always some kind of REIT). At the same time, we will include some charts and tables to provide readers with organized data they may struggle to access on their own. Our commentary will help you see how we are interpreting that data.
Emphasizing Total Returns
An emphasis on total returns is what allowed the REIT Forum to outperform.
We compare our performance against four ETFs that investors might use for exposure to our sectors:
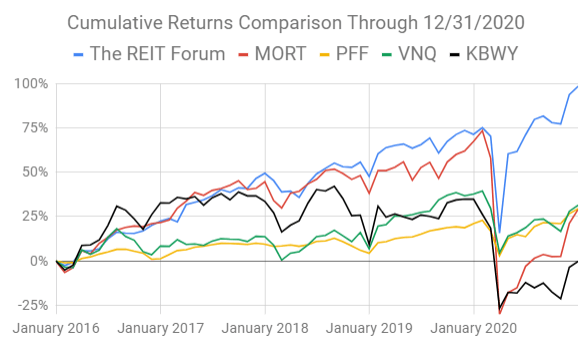
Source: The REIT Forum
The four ETFs we use for comparison are:
Ticker | Exposure |
One of the largest mortgage REIT ETFs | |
One of the largest preferred share ETFs | |
Largest equity REIT ETF | |
The high-yield equity REIT ETF. Yes, it has been dreadful. |
Why those four? Because the vast majority of investments we buy will be held in at least one of them. Each one emphasizes a particular sector related to our investing. That makes them useful benchmarks for comparison. We’re encouraging investors to consider us as an alternative to using these kinds of ETFs. Consequently, we want to demonstrate the performance of broad indexes for mortgage REITs, preferred shares, equity REITs, and high-yield equity REITs.
We focus more on high-quality equity REITs than high-yield equity REITs, but we find many potential investors are more excited about KBWY because they see a high yield and assume it means high returns. Clearly, it doesn’t (read our articles and you’ll get exposed to that lesson frequently). However, it's one of the main alternative options many investors may consider.
Equity REITs: MH Parks
Equity Lifestyle (ELS) and Sun Communities (SUI) both took a dip to start the year. We’re attributing the dip to investors rotating away from many growth stocks, especially growth REITs. It looks like more of a sector factor as opposed to anything particular about the two REITs. We like these two as long-term dividend growth vehicles that have consistently grown NAV per share while managing their portfolios intelligently. We’ll take a bullish outlook on ELS, though it has bounced a bit since we published the prior update:
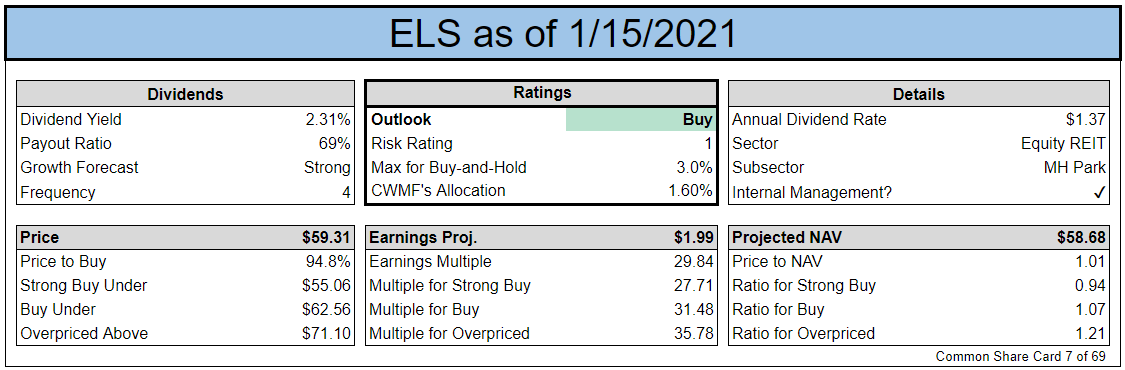
Source: The REIT Forum
Note: Since preparing this piece for The REIT Forum, ELS put on a big rally and doesn't mean our targets for publishing a fresh buy rating. However, it isn't fair into the neutral range either. Consequently, we're not going to issue a rating on ELS in this article.
ELS is the first monster of dividend growth for this article:
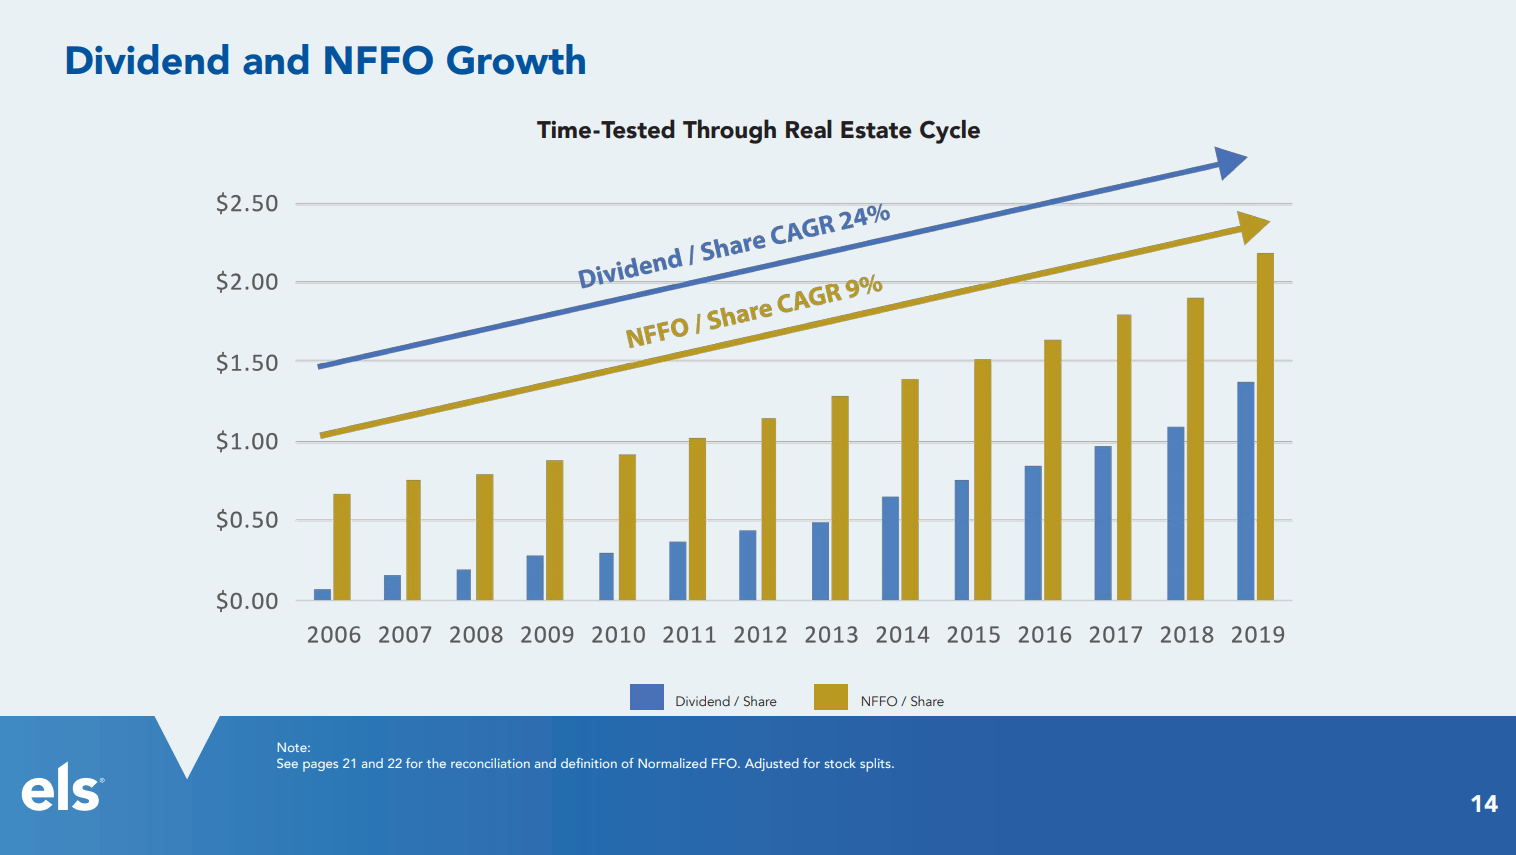
Source: ELS
Don't expect dividend growth to continue at 24% per year, but investors should expect ELS to remain one of the strongest dividend growers.
Equity REITs: Towers
The tower REITs are in a great business. We expect all three to do well over the next decade, but prefer the two with lower risk ratings.
American Tower (AMT) carries the lowest risk rating, but the two could become a 2.5 if they don’t reduce leverage over the next few quarters. They’ve been busy acquiring towers. For instance, they recently closed on the InSite deal. Then on Jan. 13, 2021, they announced the Telxius Towers Transaction.
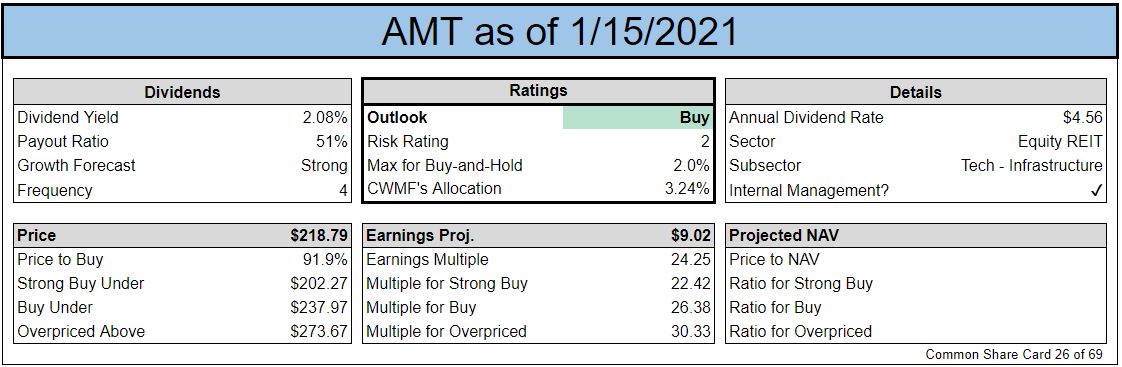
Source: The REIT Forum
AMT is mixing two assets: Domestic towers and international towers. Over the last several years they’ve been spending far more on international towers. Despite “American” in the name, they have the least exposure to the United States. AMT is looking to profit from cheaper access to 4G phones driving expanded use throughout developing markets. As more consumers can purchase 4G phones, they will most likely demand faster data which means more 4G coverage.
AMT is the second dividend-growth monster for this article:
Source: AMT
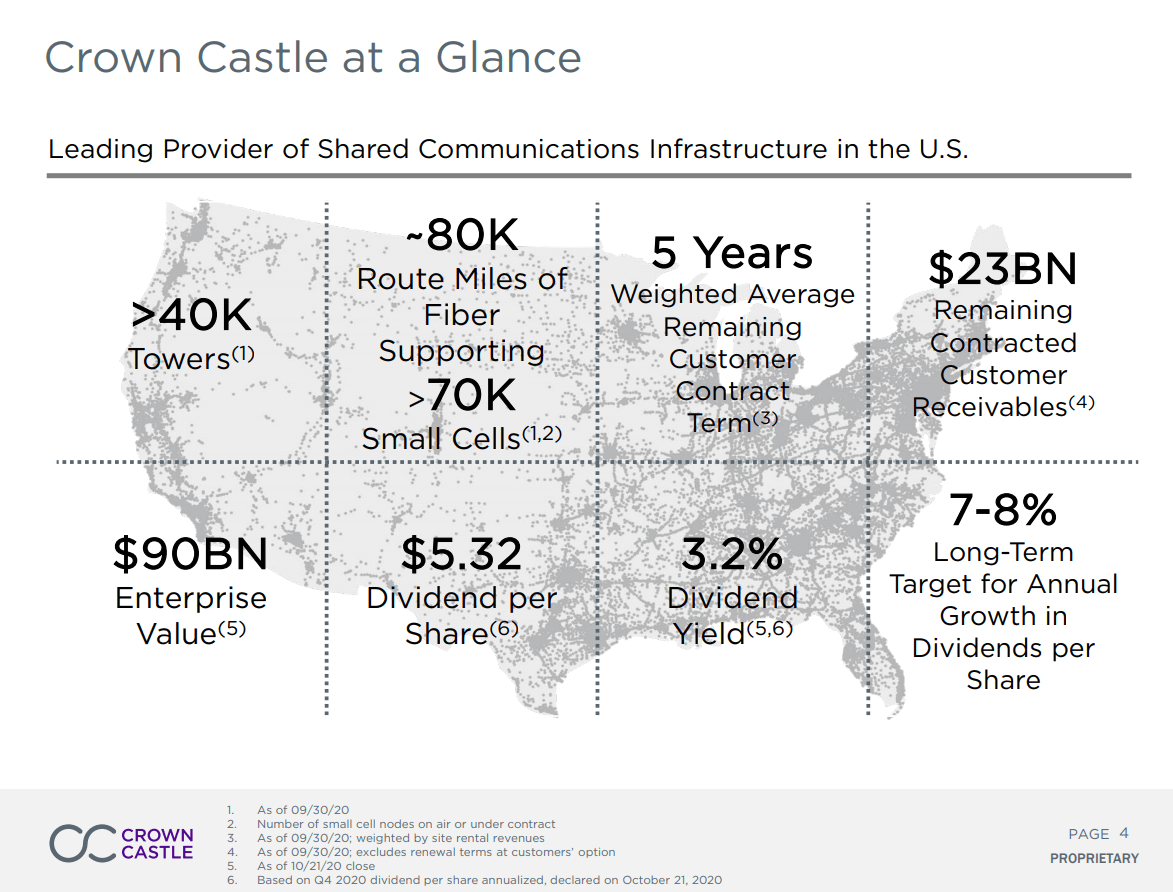
We’re adding coverage on Crown Castle International (CCI) with a risk rating of 2.5 and a bullish outlook:
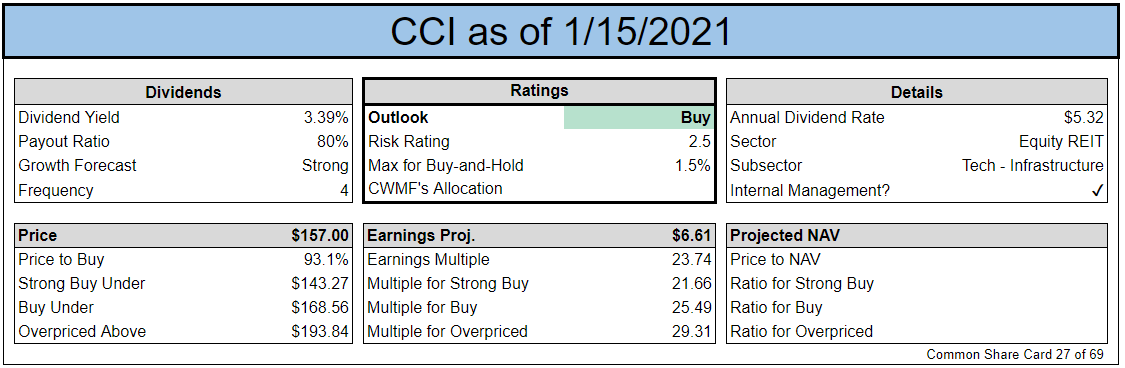
CCI is a tower REIT, but they also own a substantial amount of fiber assets and small cells. CCI isn’t interested in international tower exposure. Instead, they’ve been building their fiber assets with small cells. CCI is focusing on the domestic deployment of 5G speeds to drive increased investment domestically.
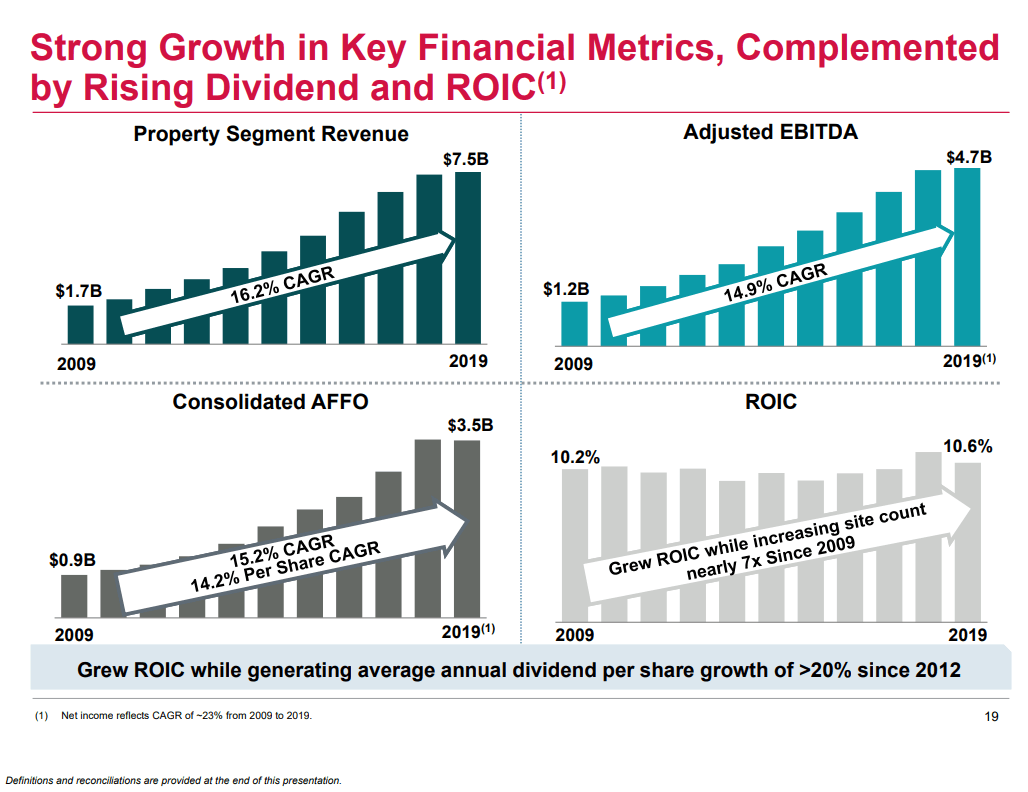
CCI is the third dividend growth monster:
Source: CCI
That's a 7-8% target for dividend growth, which would thoroughly beat most REITs over the next decade. That is, of course, assuming we exclude REITs with "infinite dividend growth" after they bring back a dividend from the dead.
We’re adding coverage on SBA Communications (SBAC) with a risk rating of 3.5 and a neutral outlook.
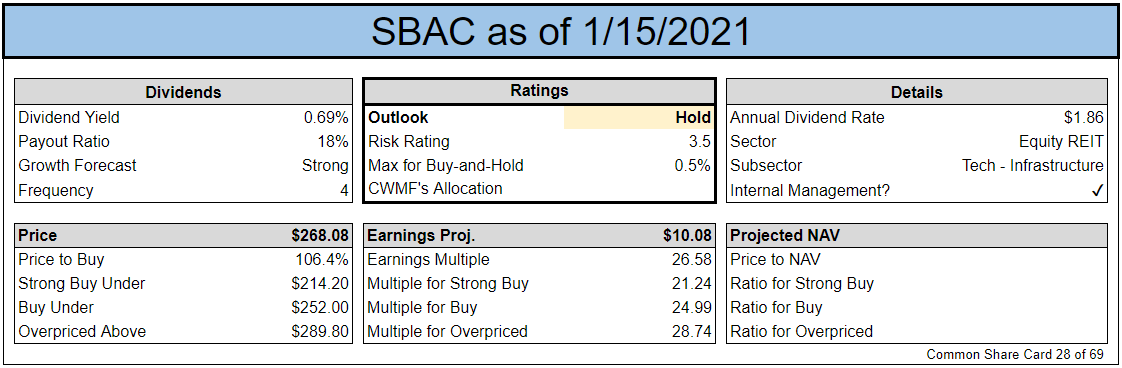
Normally we would tell investors that a risk rating of 3.5 is too high for significant long-term purchases, but we see a favorable outlook for the sector. A major difference in the REITs comes from leverage.
Tower REIT Leverage
SBAC is comfortable running with net-debt-to-EBITDA around 7x. That means $7 in debt for each $1 in EBITDA. To put that in comparison, AMT has a long-term target of 3x to 5x (currently above target) and CCI has often been between 5x and 6x. Looking at long-term charts, SBAC has outperformed AMT and CCI. However, their management will openly admit that the major driving factor was SBAC using higher leverage. Simply put, we’ve been in a great environment for towers for many years and SBAC’s higher-risk strategy paid off. It might pay off again in the future, but our risk aversion leads to higher targets on AMT and CCI where we would be more comfortable riding out any rough periods.
REIT Charts
We’ve prepared several charts. We’ll break them down into two categories. The first is Price-to-NAV. For the public release of this article, the NAV figures will be delayed. Since many investors simply don’t have access to consensus NAV estimates at all, this is still providing substantial value. As a reminder, equity REIT NAV is not reported under GAAP. You will not find it on the balance sheet, at all, for an equity REIT reporting under GAAP.
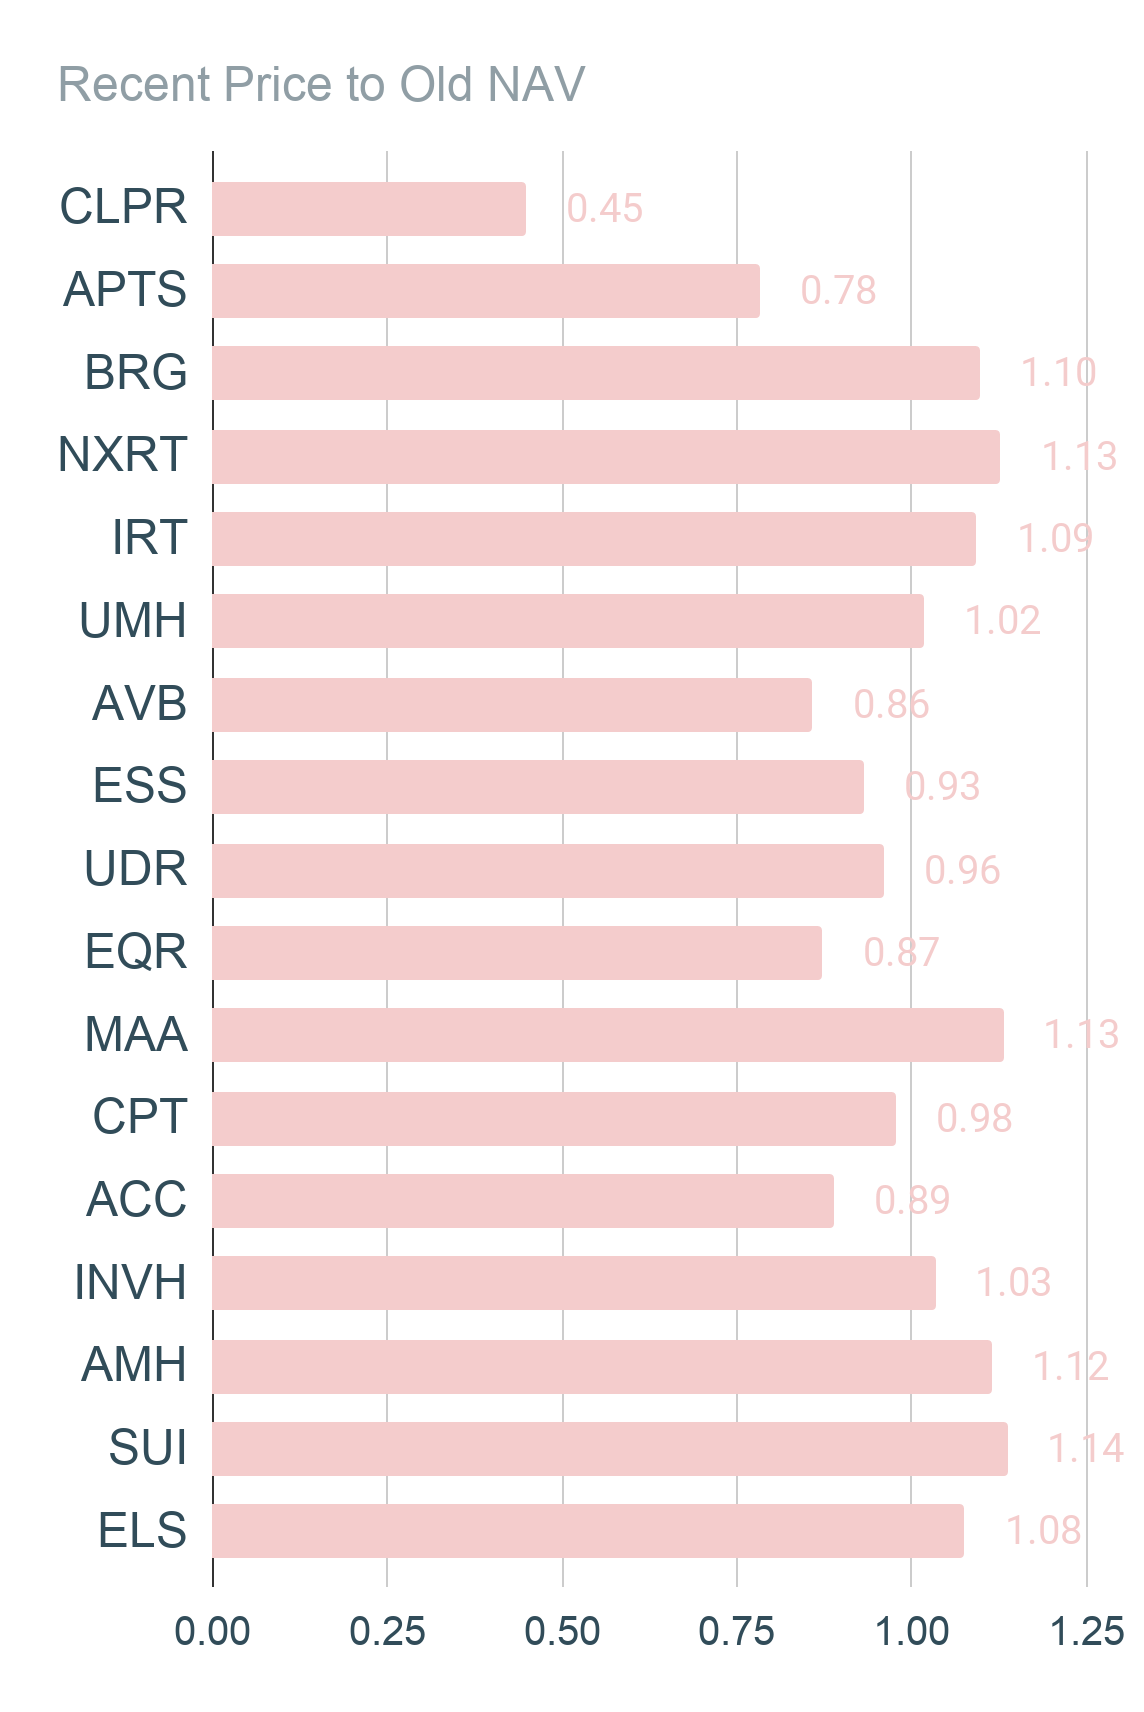
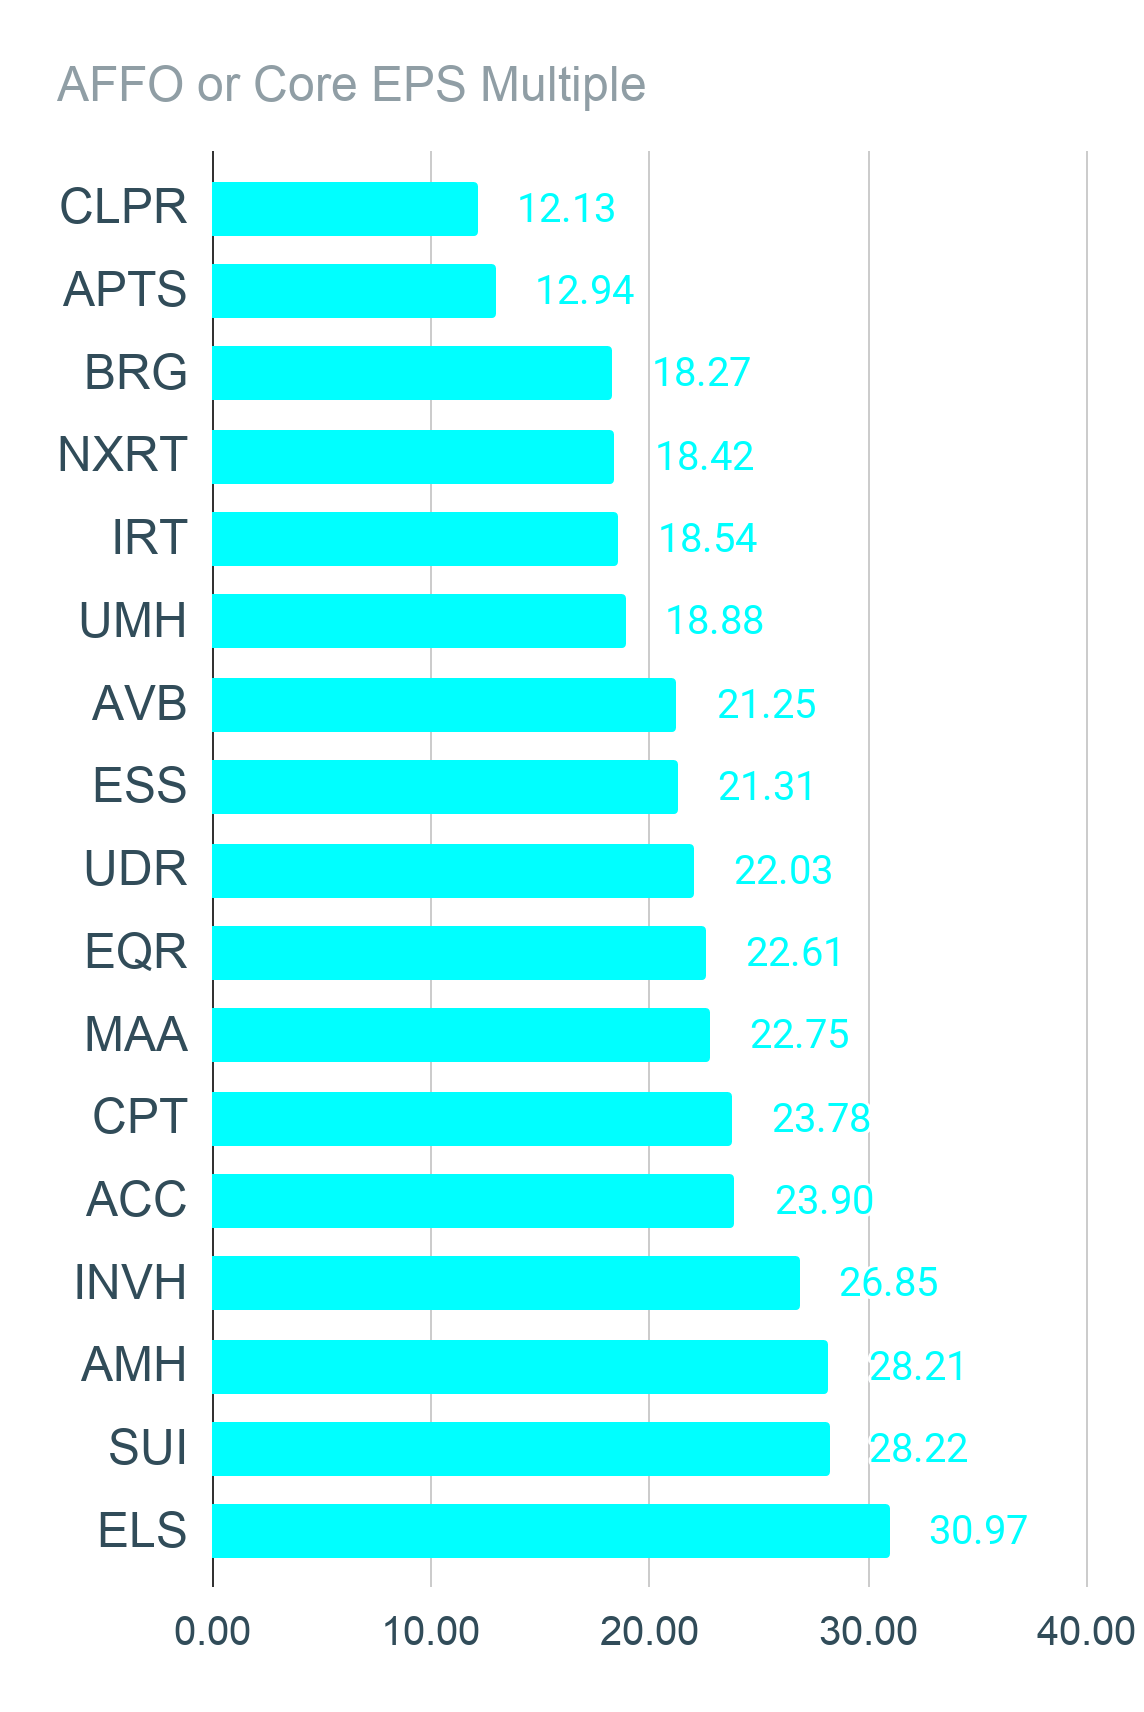
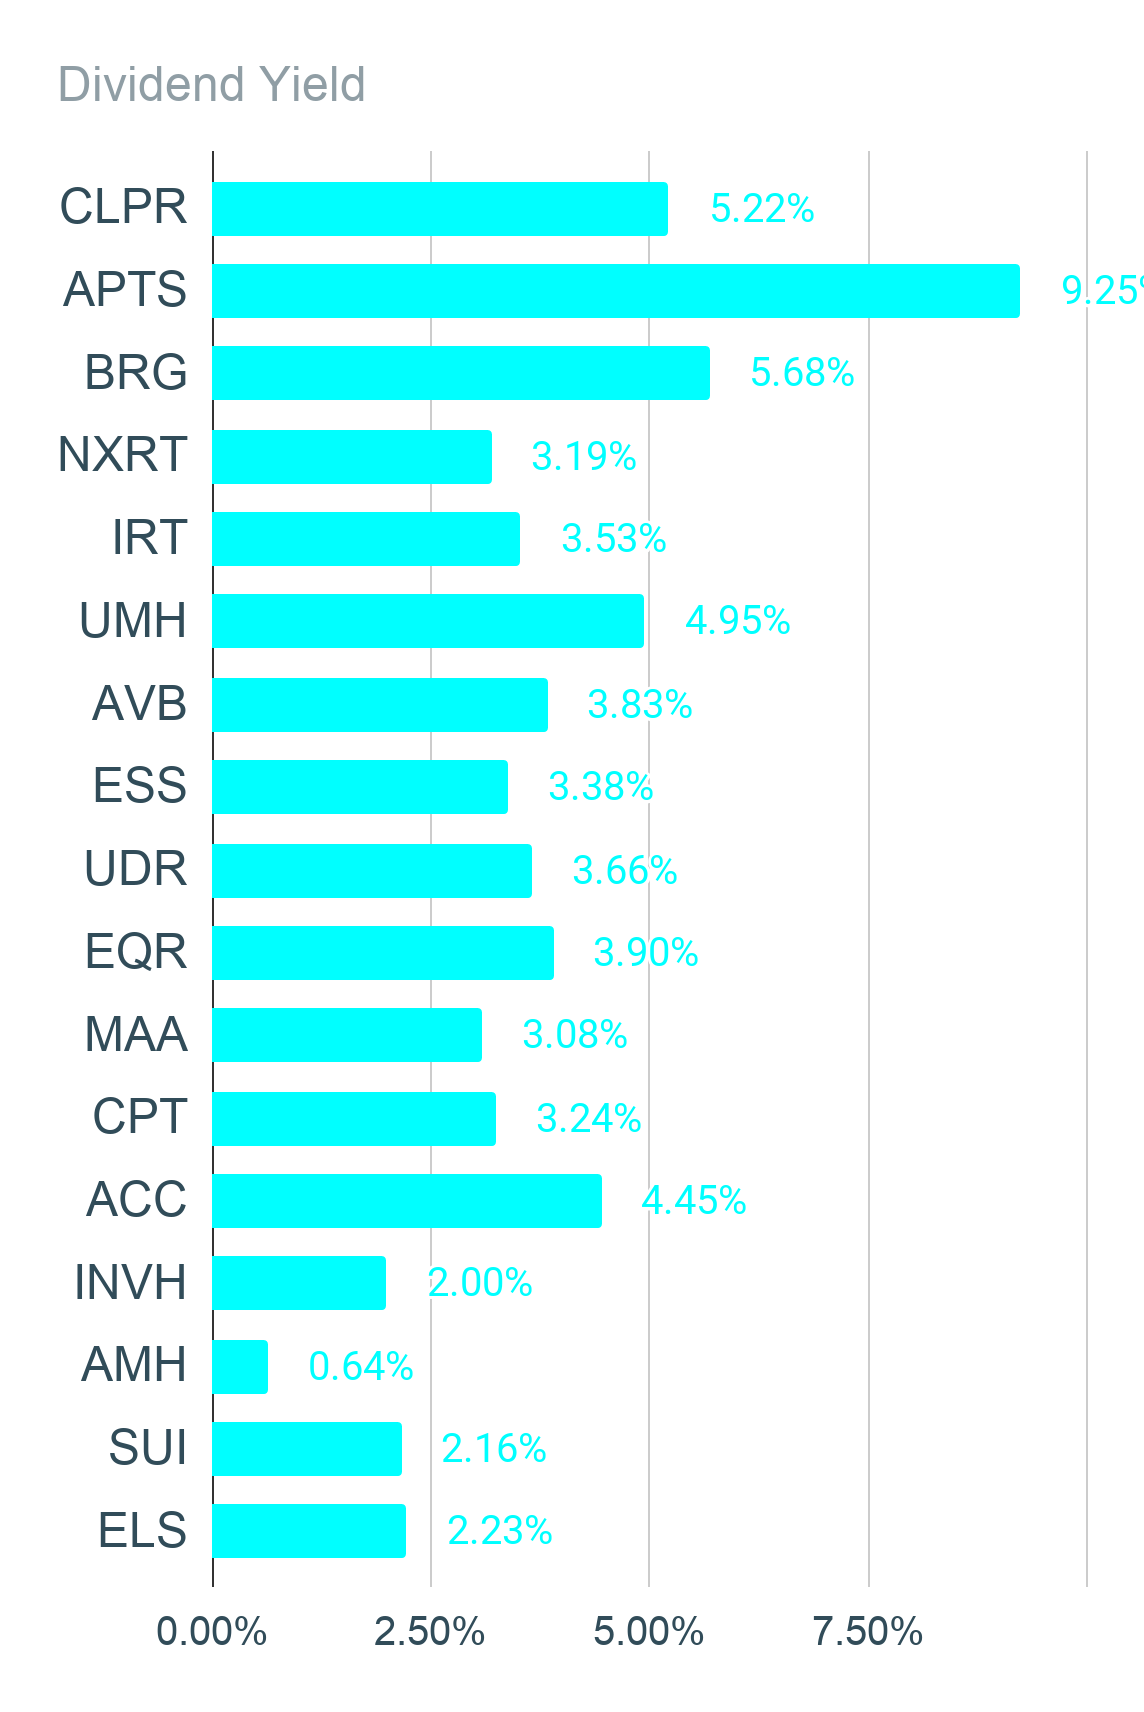
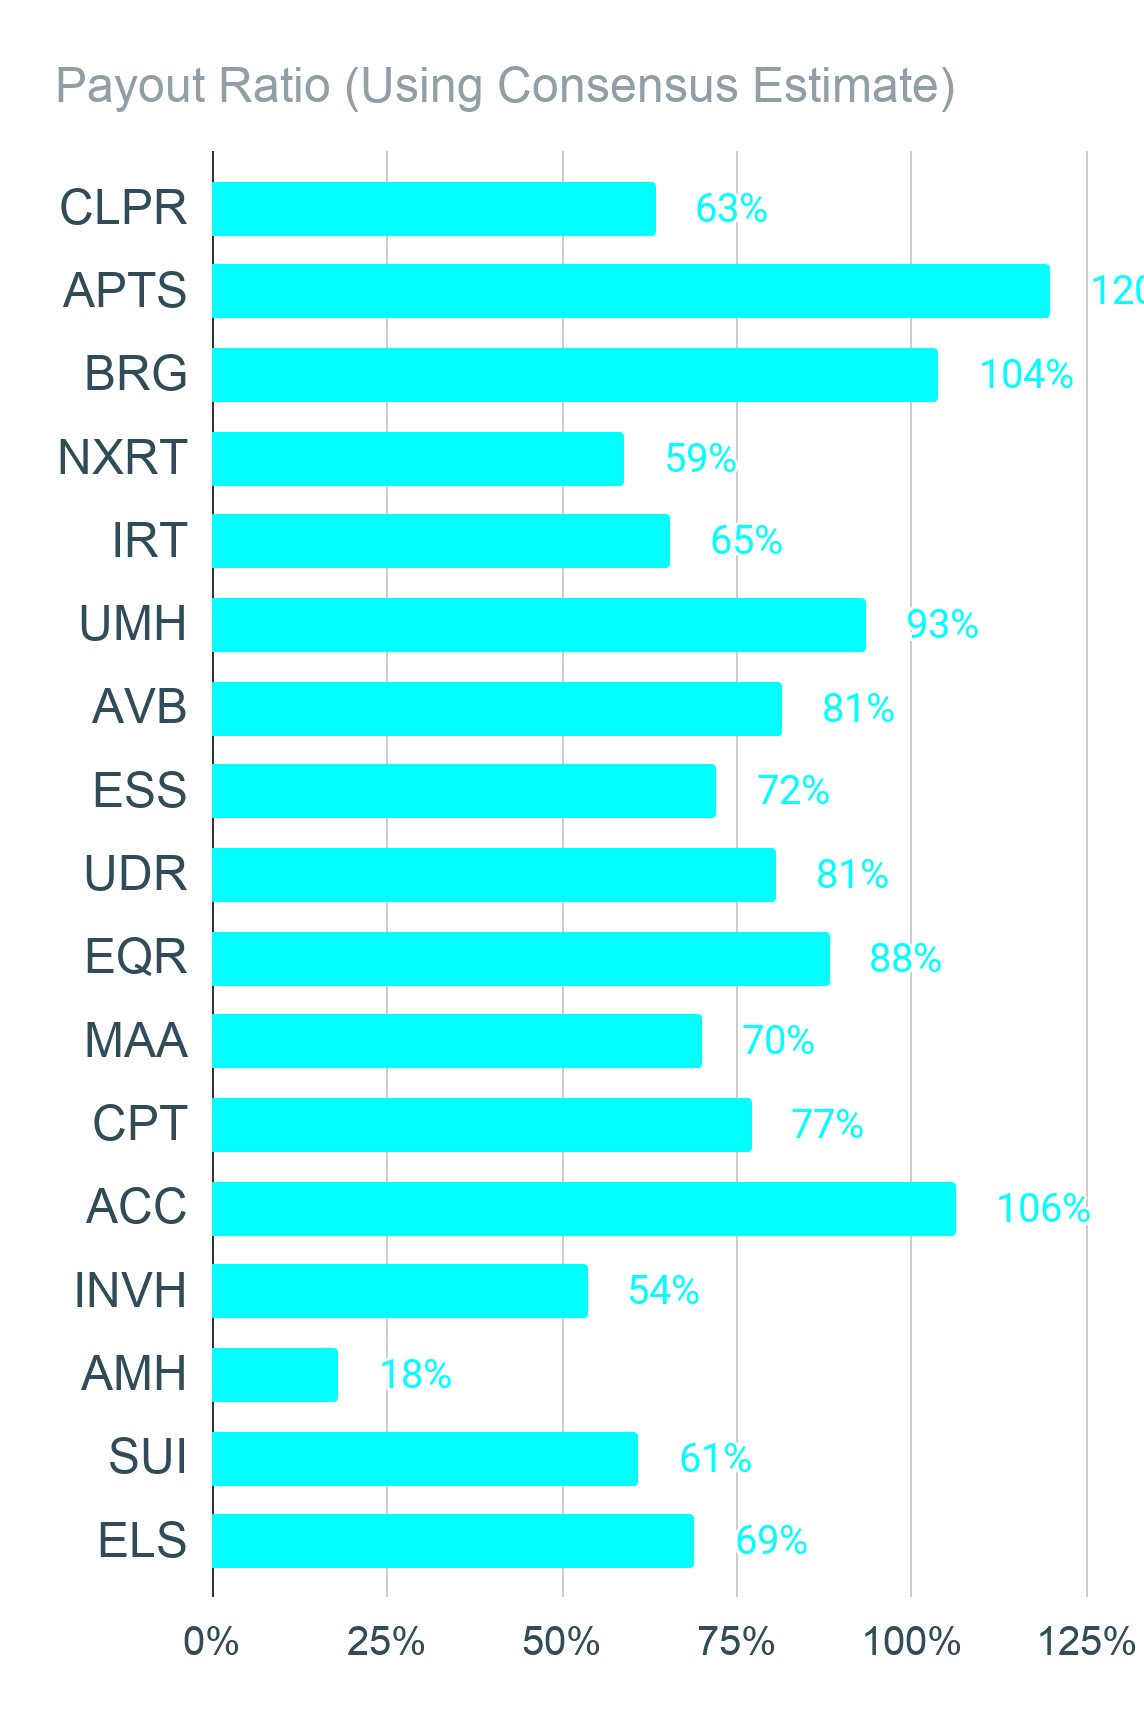
The other charts cover other metrics investors want to know about.
|
|
|
|
|
|
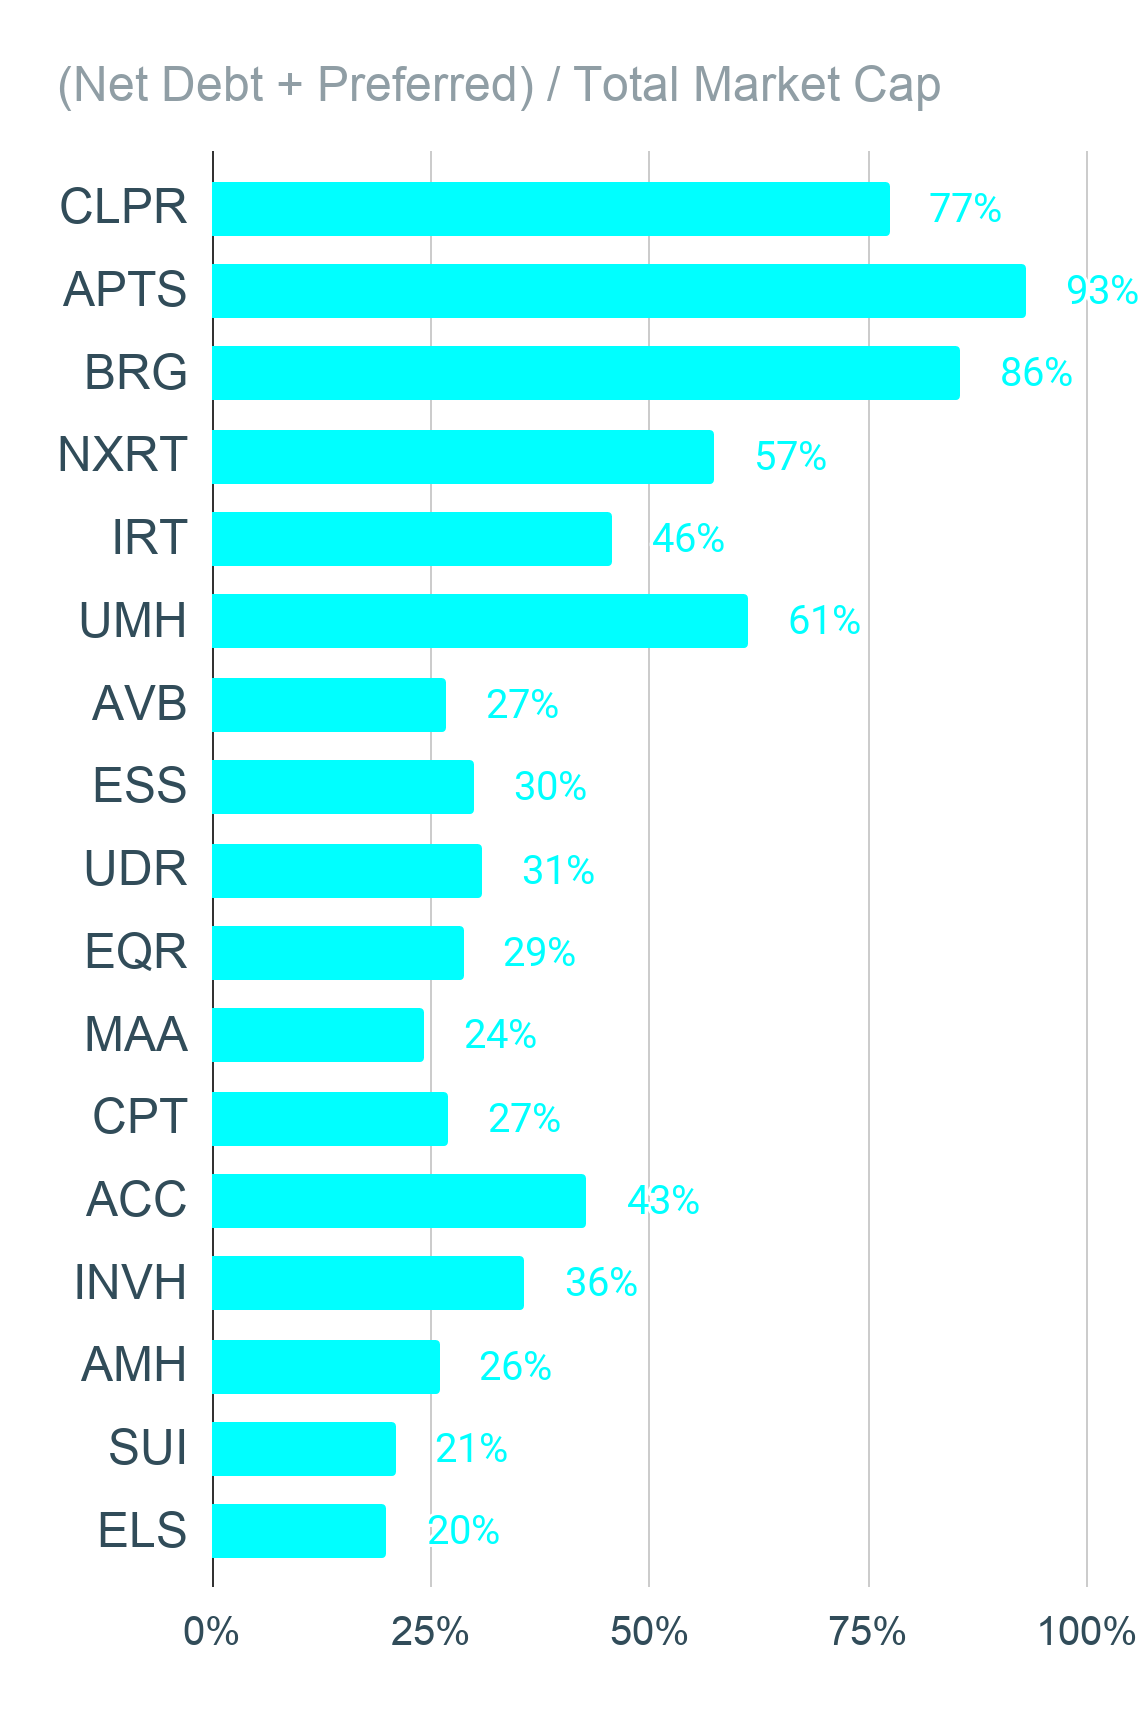
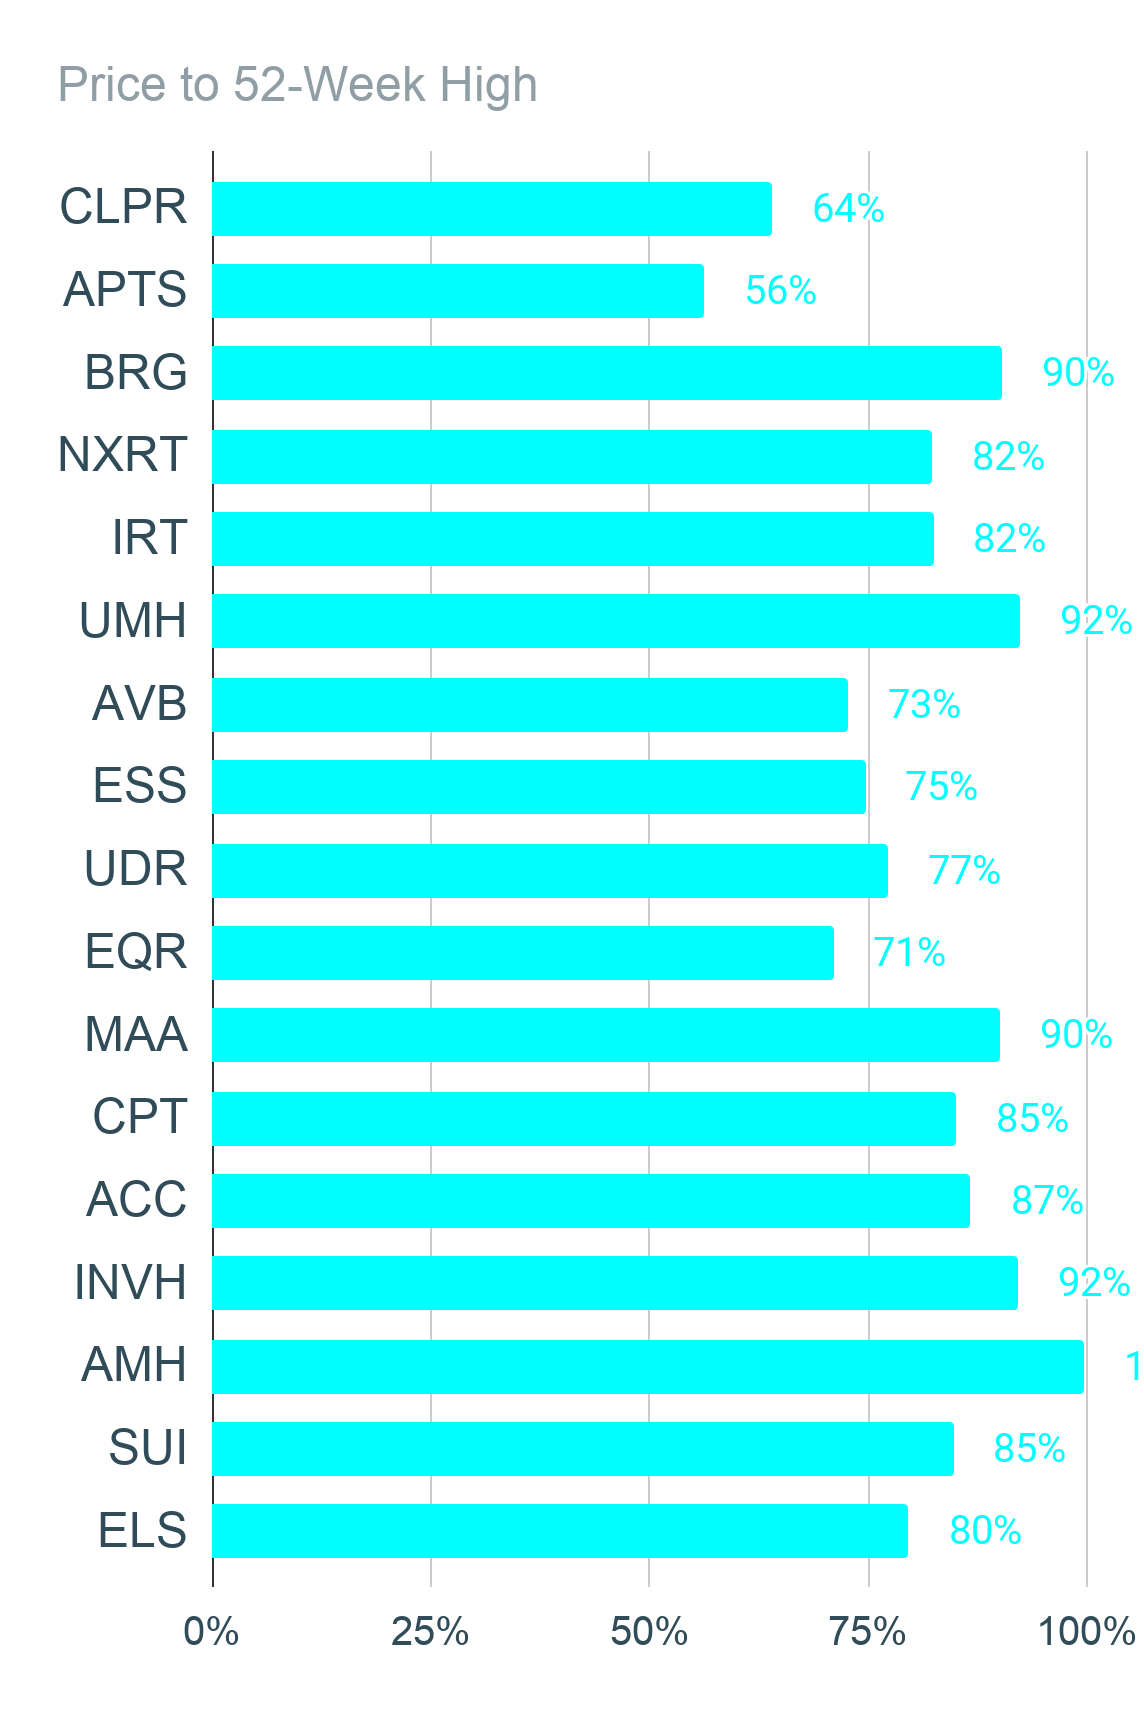
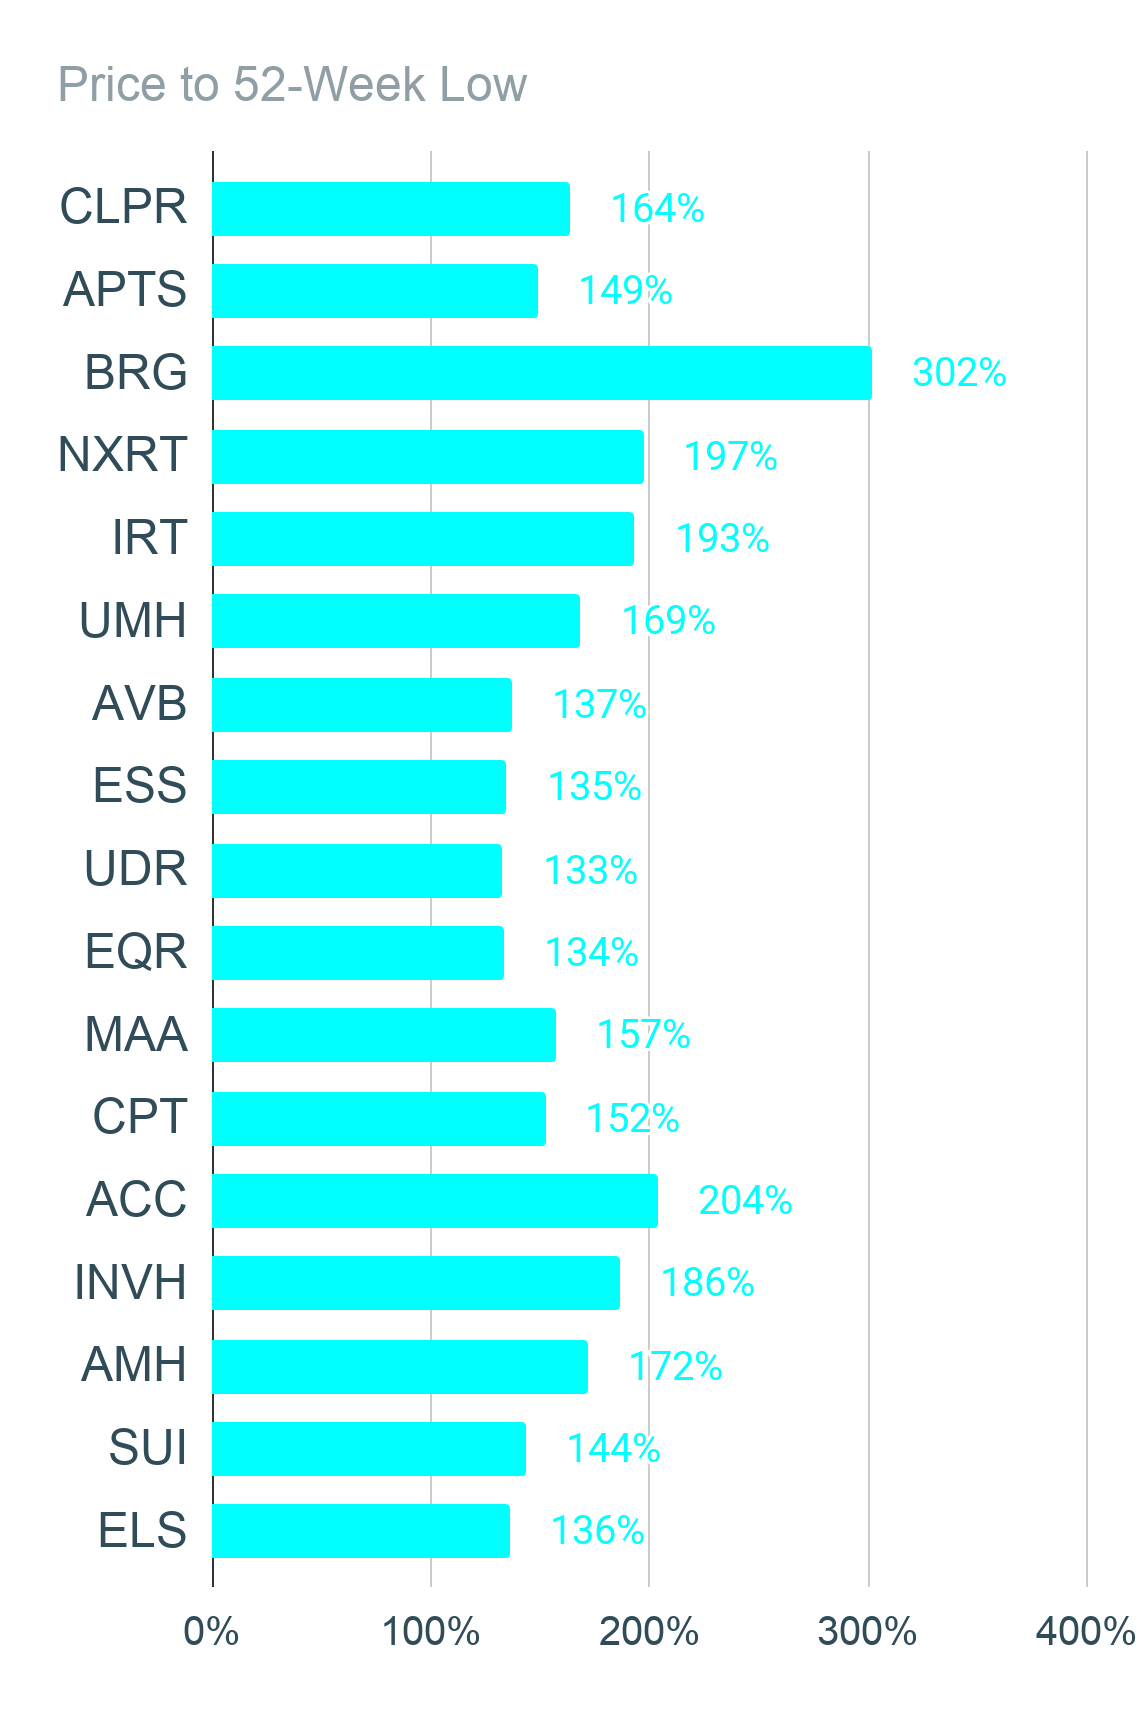
Source: The REIT Forum
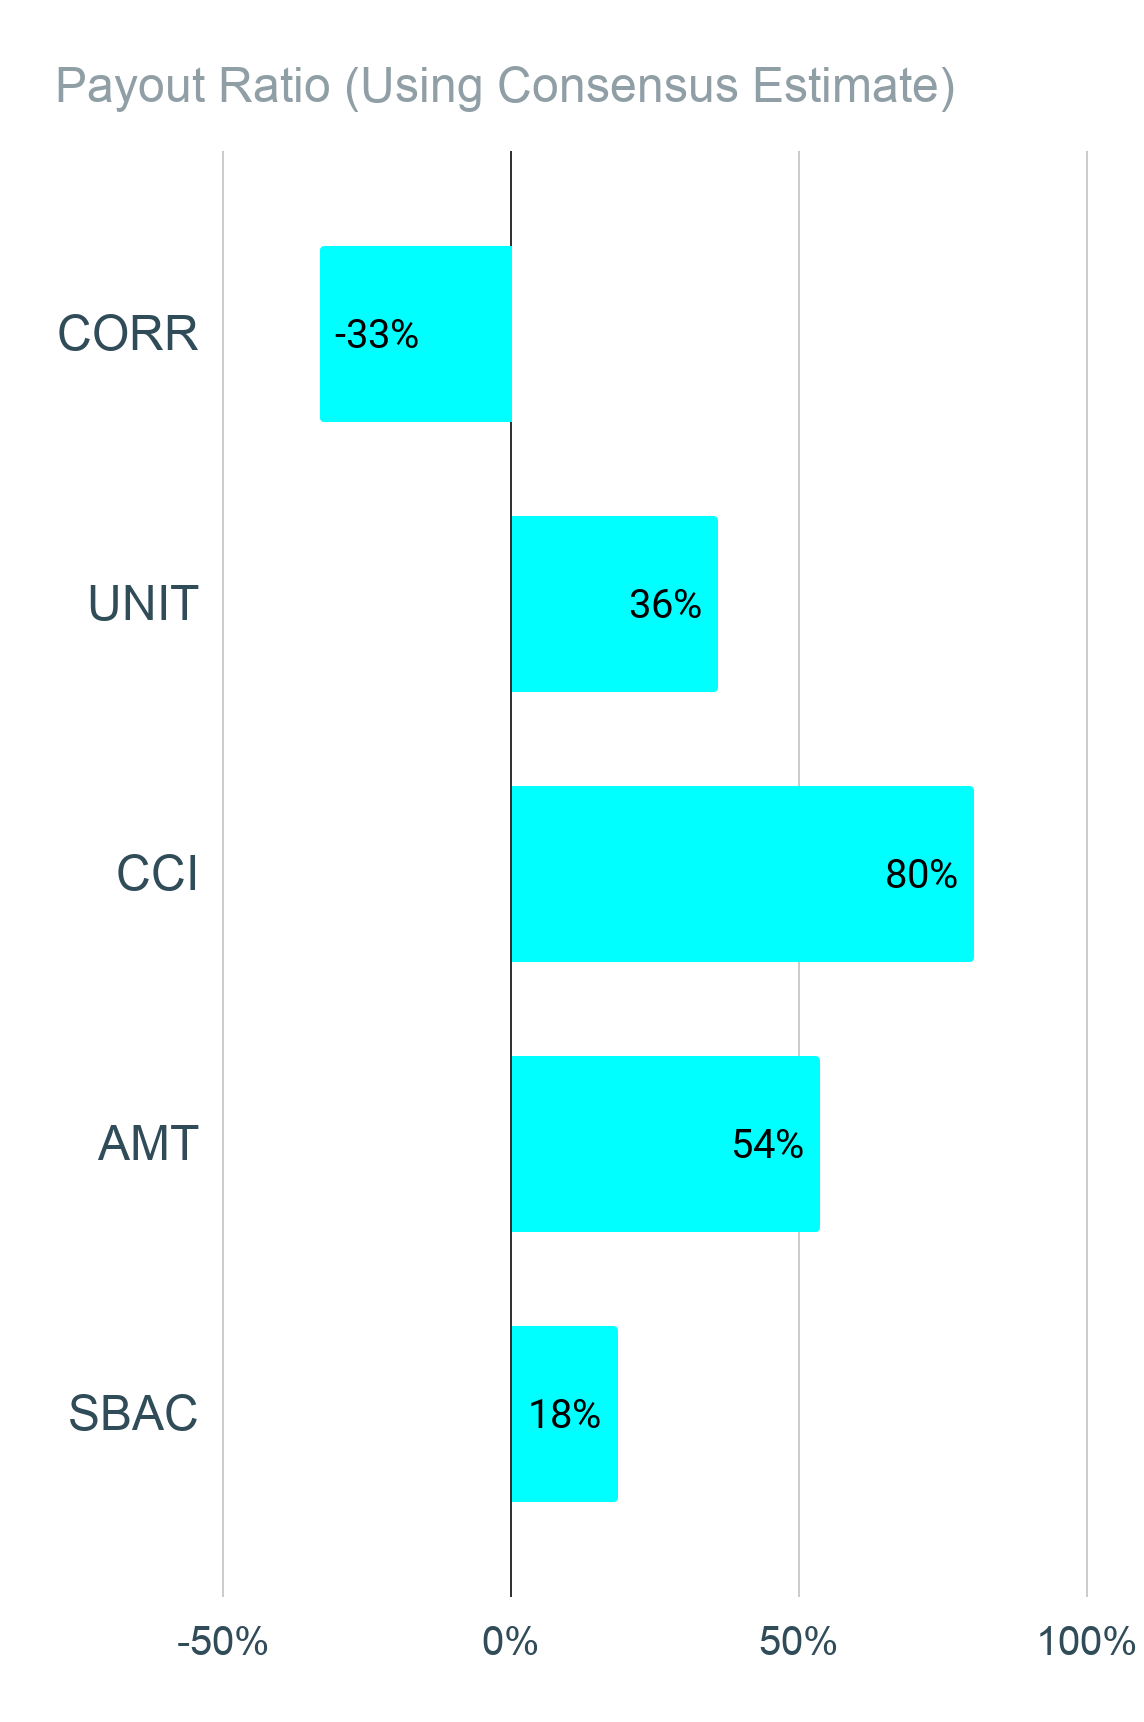
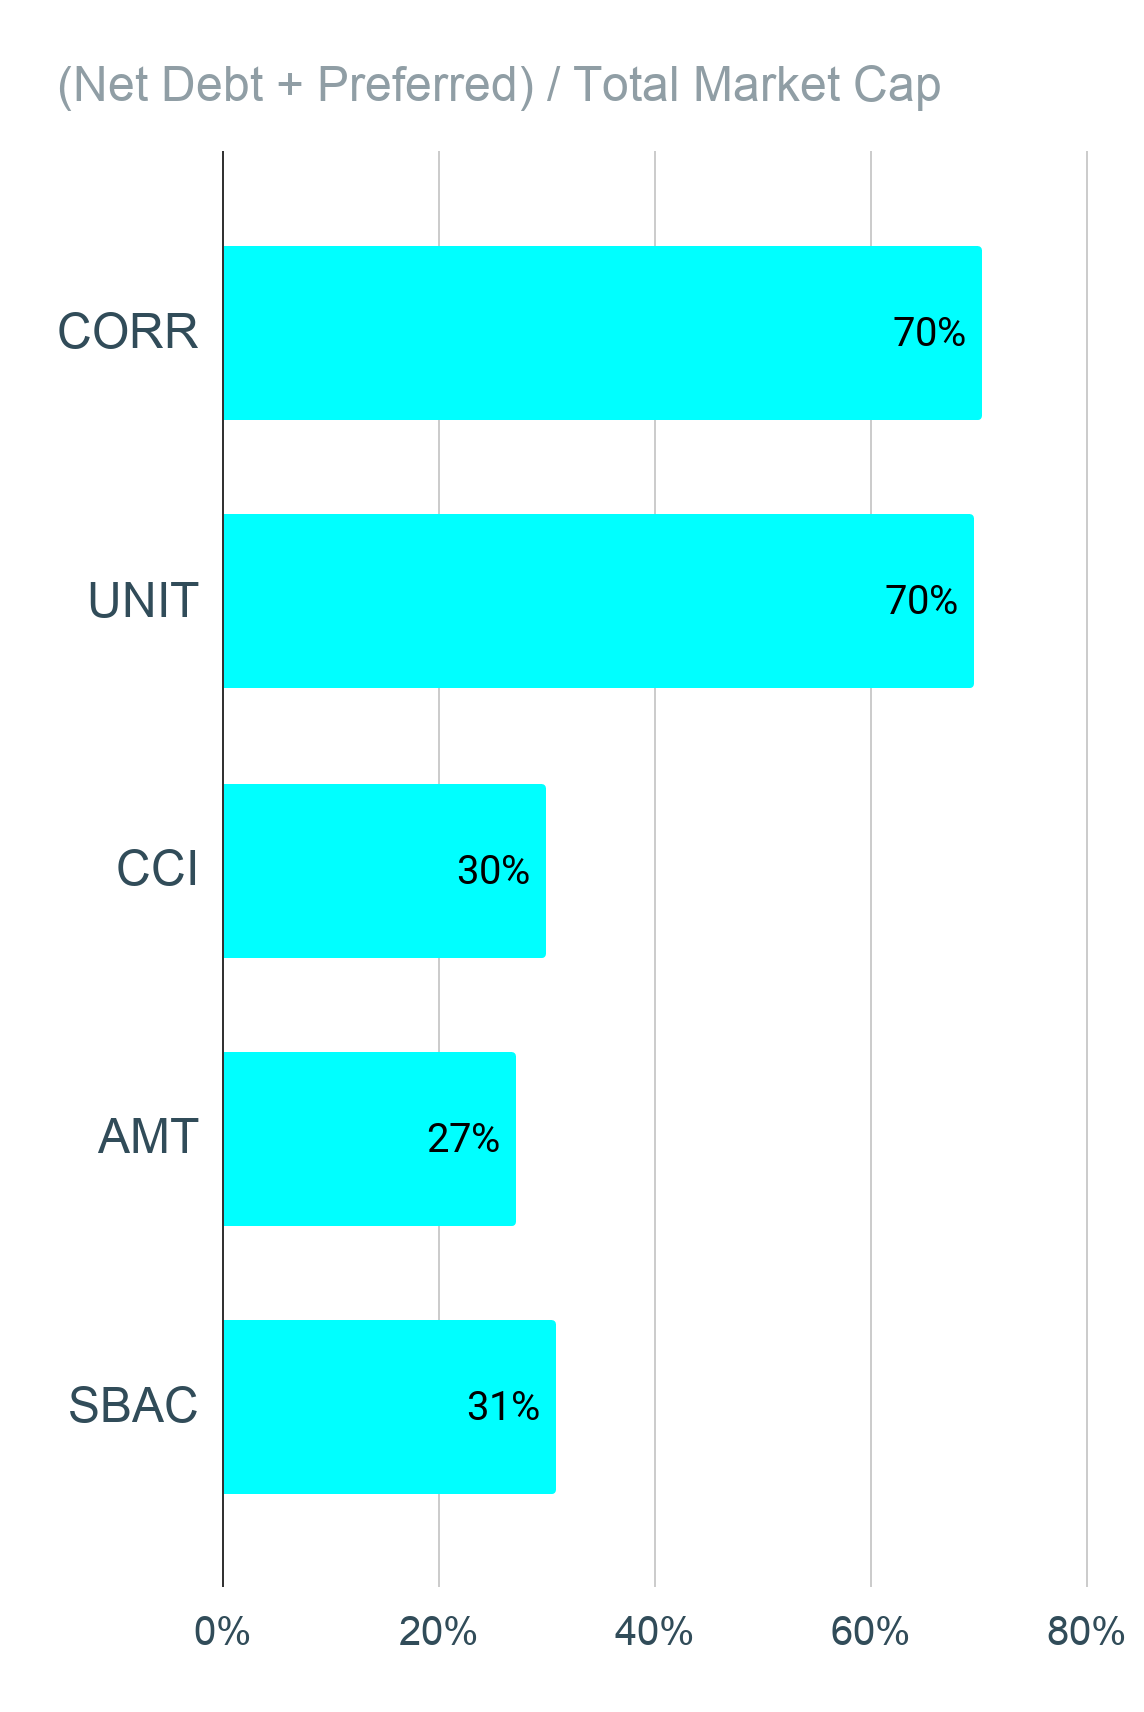
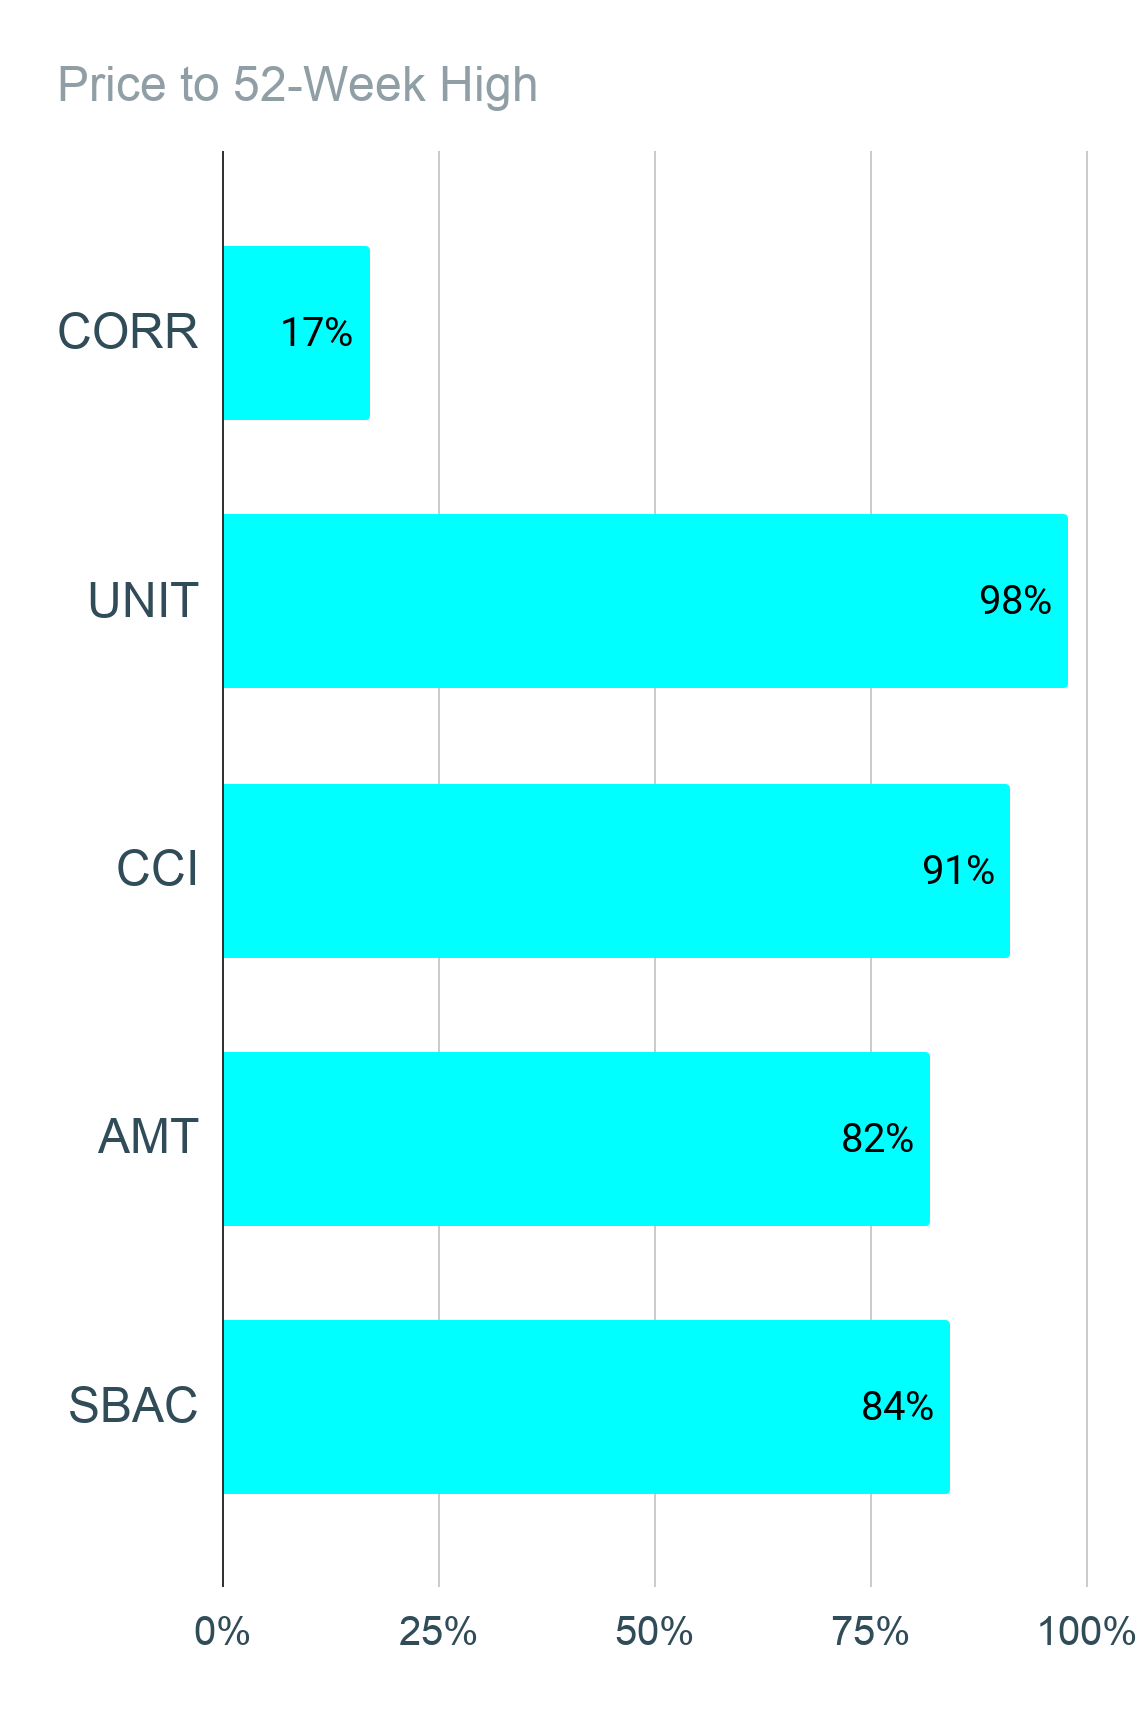
We also built charts for the infrastructure REITs (which includes towers):
|
|
|
|
|
|
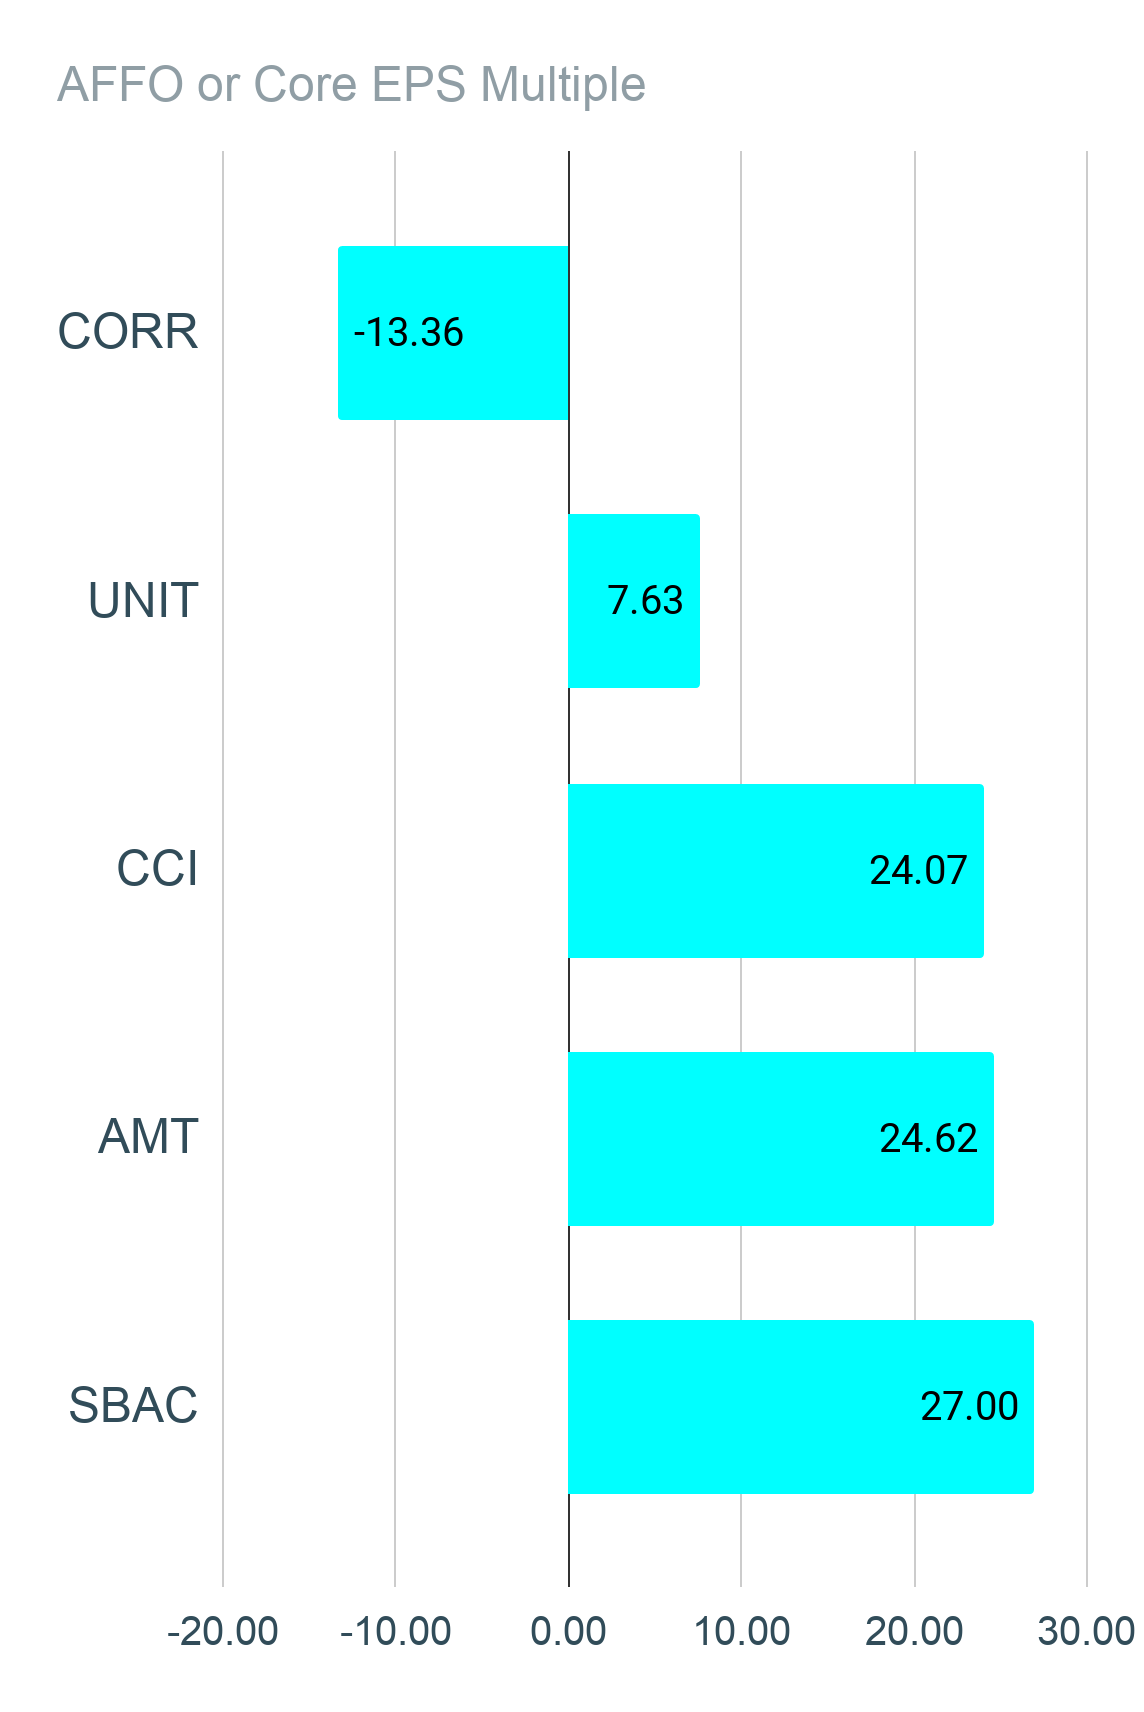
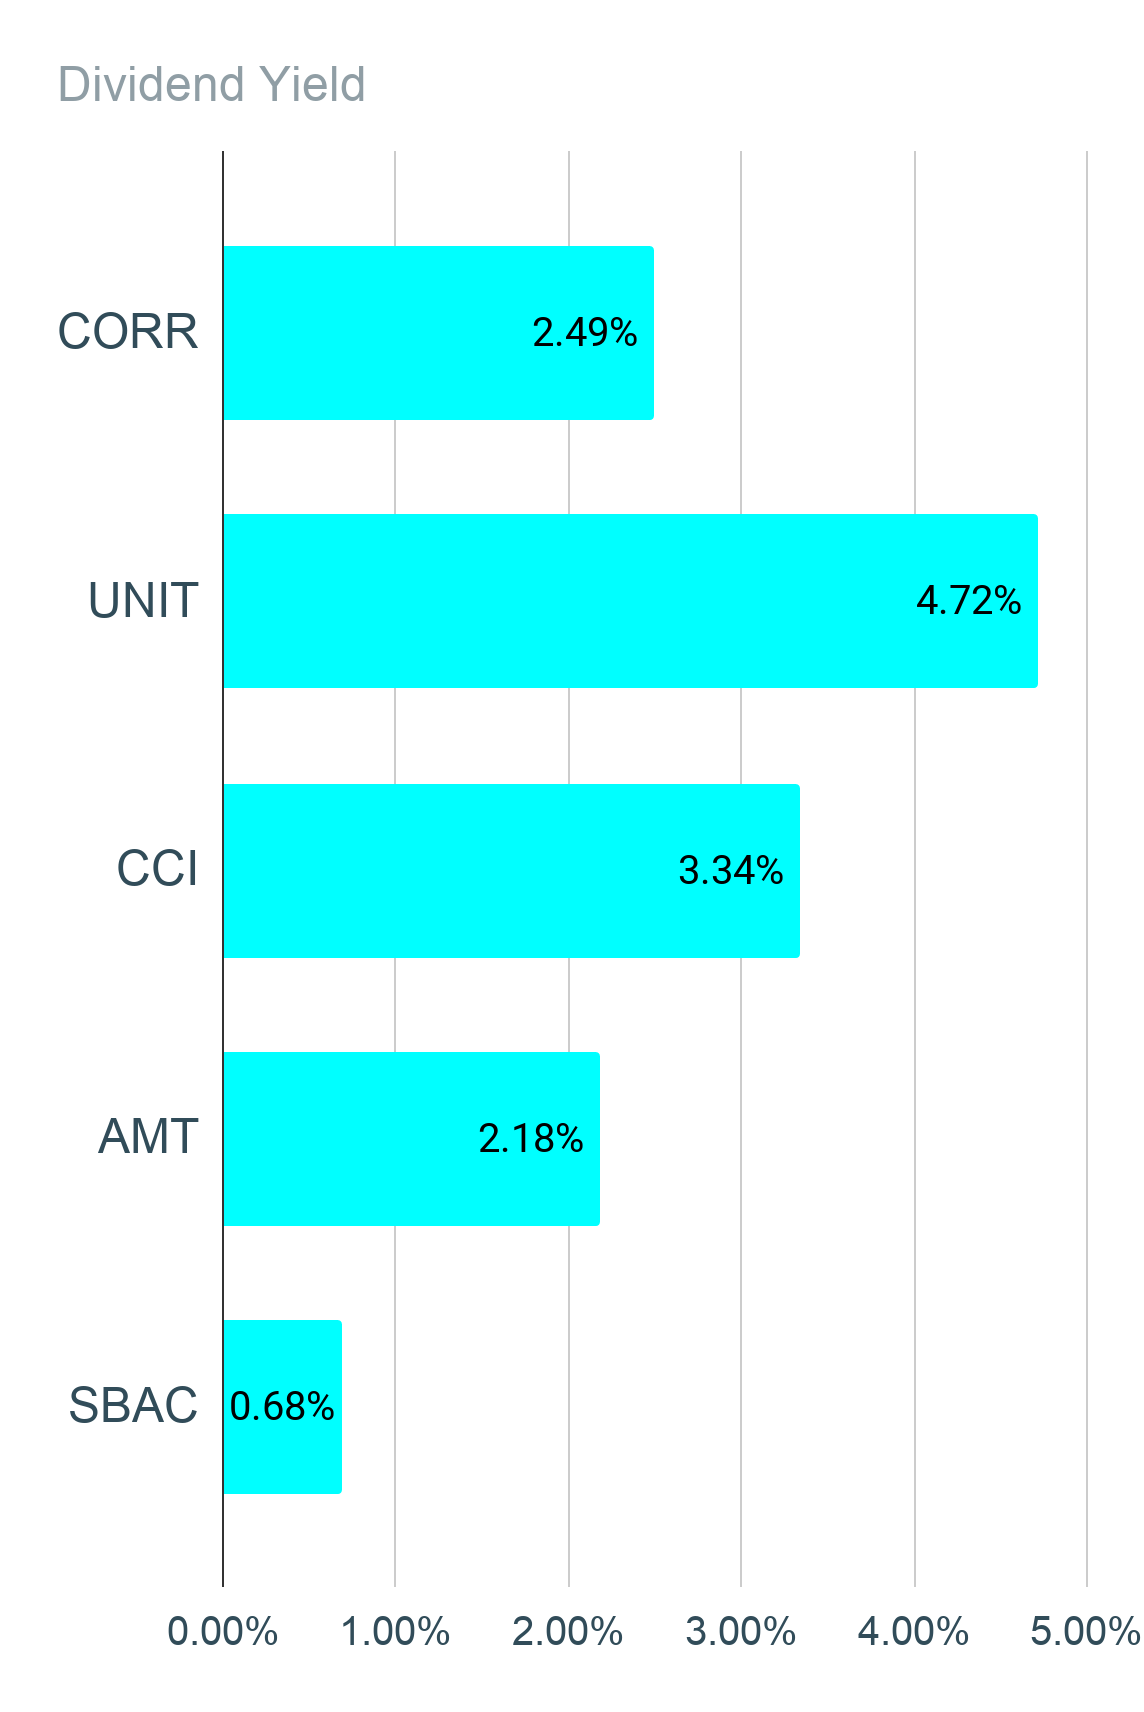
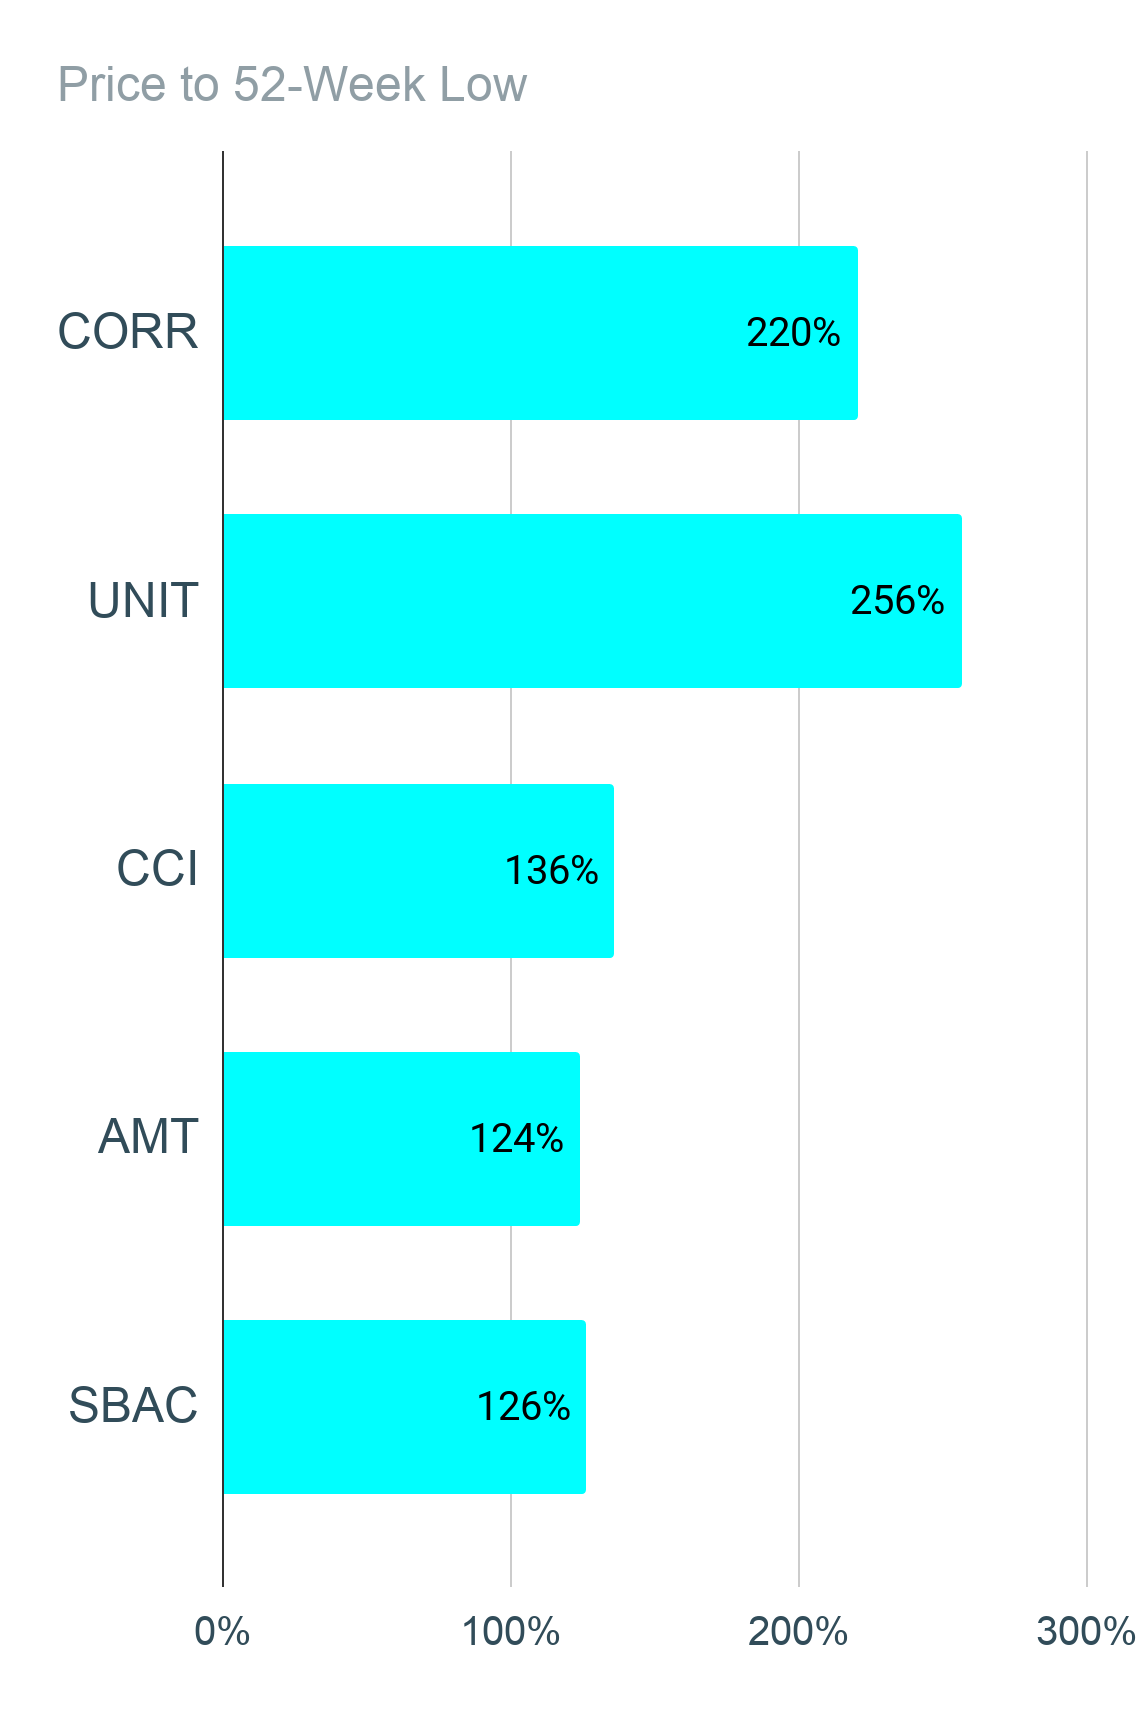
Source: The REIT Forum
Note: UNIT and CORR should not be confused with CCI, AMT, and SBAC. While these are all considered "infrastructure REITs," there are very material differences.
Misconceptions
There are a few common misconceptions. Sadly, these are so prevalent that I need to address them on a regular basis.
- Several investors who have begun to learn about NAV believe that buying at a large discount to NAV is always a good idea. While a discount can be attractive, it shouldn’t be used in isolation. REITs that persistently trade at a large discount to NAV simply do not outperform.
- Many investors believe that by “demanding” a higher return in the form of dividend yield they can achieve higher returns. This doesn’t work. It has never worked. It regularly results in worse returns.
- Many investors believe FFO can be used in isolation to determine if a REITs dividend is safe. This is categorically false. We’re providing charts using “Analyst AFFO”, which subtracts for recurring capitalized expenditures such as replacing roofs and repaving parking lots. If you owned a physical building, could you spend rent money on replacing a roof and then spend the same dollars on paying for a cruise? No. If you stick to using FFO instead of AFFO, you will fail dramatically at valuation.
- Some investors think payout ratios in a single year are enough to tell them everything they need to know. That isn’t true either. Sometimes there are non-recurring factors that can still impact “Analyst AFFO.” Despite attempts to standardize definitions, there are some unusual factors that can still have significant short-term impacts. That doesn’t mean you can shrug off a high payout ratio, it means you need to dig deeper.
- Many investors fall into one of two extremist camps. The first camp thinks no one can beat the market regularly, therefore they are only interested in index funds. Ironically, these investors still choose several different index funds instead of just using one target date fund, which automatically diversifies their holdings. The second camp assumes that beating the market is simple and becomes overly confident. These investors may often be heard disclosing trades months later, but never in real-time. You can guess why.
Demonstration
Since someone always wants to argue about those points, I need to keep reminding investors. A persistent discount to NAV is not a positive sign.
I’m going to use several charts built using TIKR.com to demonstrate. Each chart is HUGE so we could maintain resolution (make sure wifi is on).
Retail: WPG: Big Discount, Declining Price
Apartments: BRG: Frequent Discount, Declining Price (until April 2020)
Apartments: MAA: 50/50 for Premium/Discount, Rising Price
MH Parks: SUI: Frequent Premium, Rising Price
Net Lease: O: Huge Premiums, Rising Price
Industrial: REXR: Earned Premium, Rising Price
When someone tells you that all of their REITs trade at large discounts to NAV, that should be a red flag. It’s great catching a premium REIT during a rare discount, but a persistent discount is a bad sign. If you’re a buy-and-hold investor, your No. 1 focus should be on quality.
It's shockingly rare to see a combination of a long-term rising share price and a frequent discount to NAV. If the discounts to NAV are frequent, it doesn’t bode well.
Cheap Stays Cheap
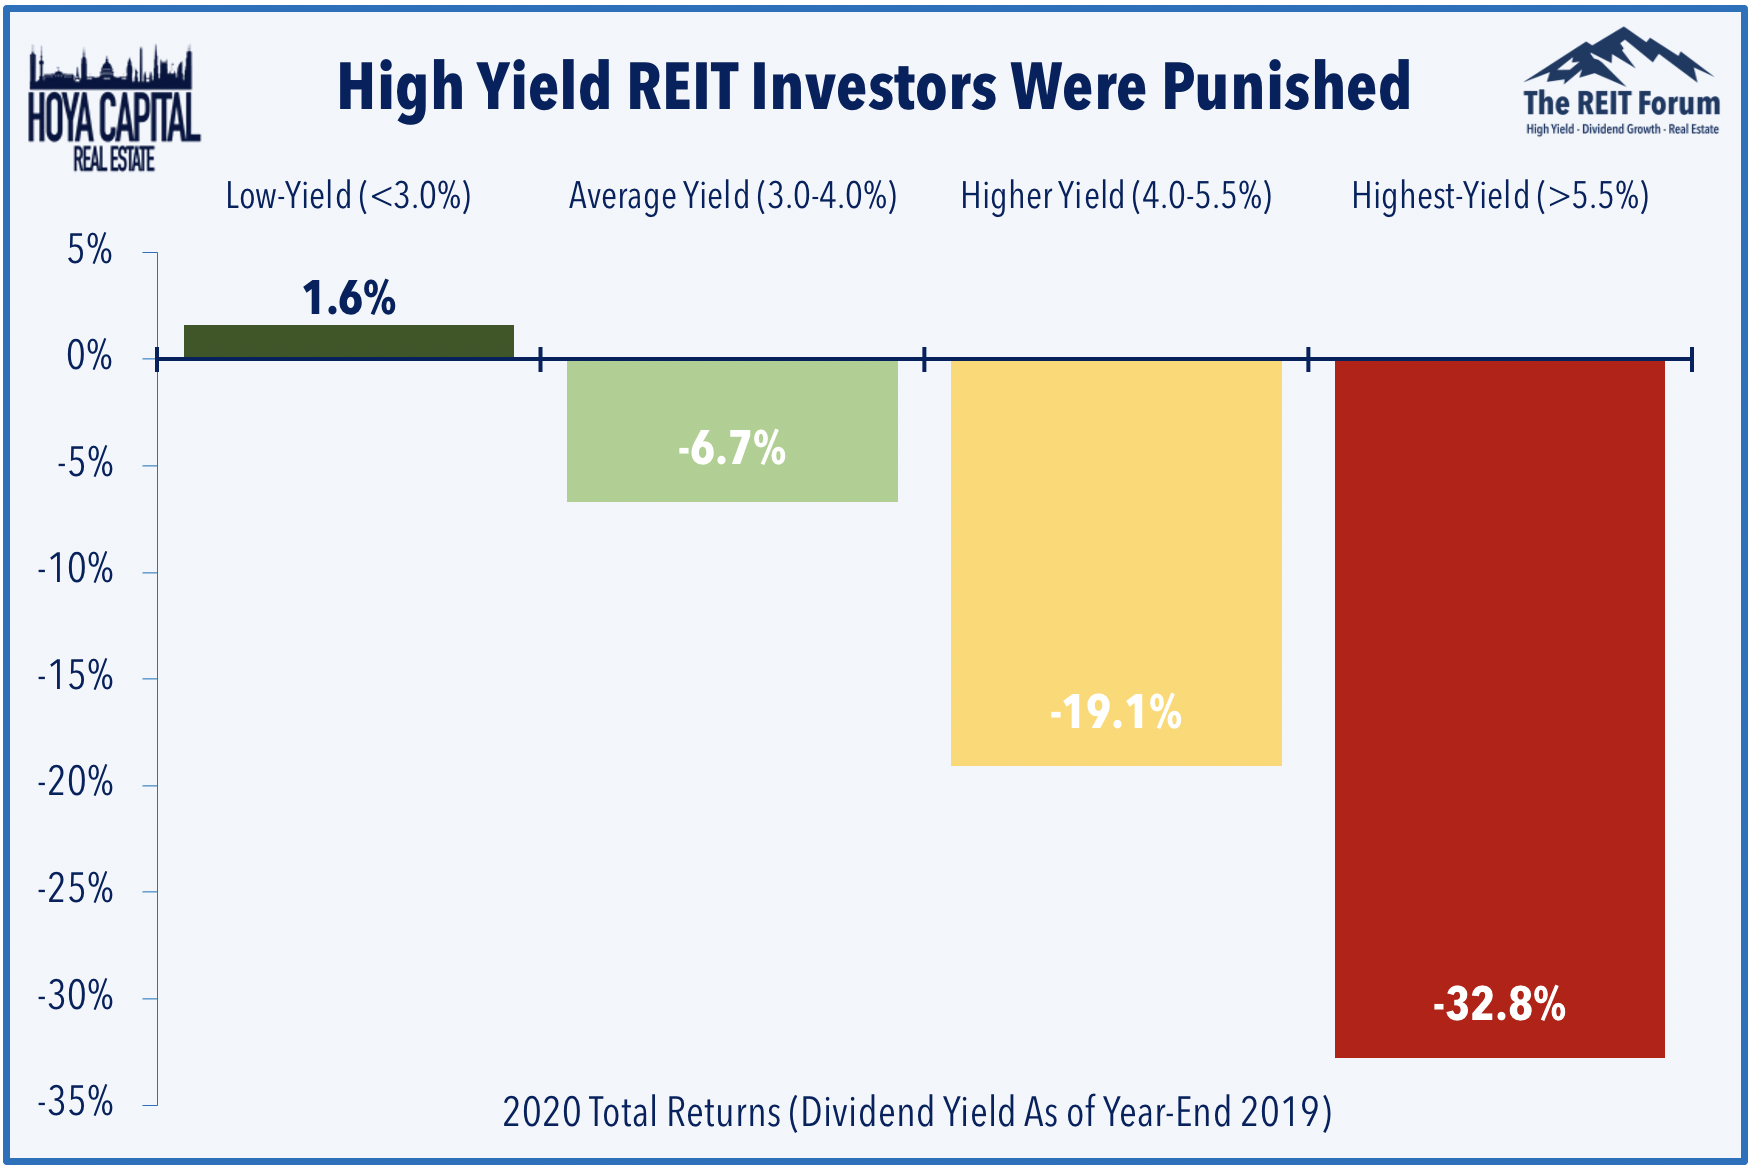
Hoya Capital Real Estate recently wrote Cheap REITs Stay Cheap. In that article he says:
“While the allure of high yield REITs can be tempting, we've stressed in our research that while there are no shortcuts in REIT investing, that one can indeed 'tilt the playing field' in one's favor by having the discipline to focus on high-quality names and long-term dividend growth rather than 'juicy' yields that can be cut at any moment. High yield REIT investors had a rough 2020 as REITs in the highest quadrant of dividend yields entering 2020 plunged more than 30% and saw the vast majority of dividend cuts while REITs in the lowest dividend yield quadrant produced positive total returns.”
He hammered the point home with this chart:
Conclusion
You don’t have to follow us. You don’t have to care about our research. If you’re happy with a high dividend yield and a dwindling account value, there are plenty of authors who can cater to you. On the other hand, if you’re focused on generating total returns and want to use REITs to do it, you may love our research. Hit the “Follow” button beside my name to start seeing more of our research.
Make sure to leave a comment and let us know what you think of the layout.
- Rating: Bullish on AMT, CCI, and Neutral on SBAC
- Not Rating: Not applying a rating on ELS since the stock moved so rapidly over the last week.
Want the best research? It’s time to raise your game. Get access to several features you won’t find on the public side.
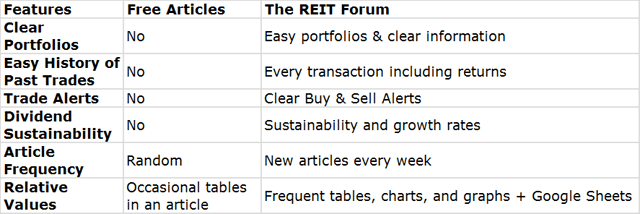
You can get access to everything we have to offer right now. Try our service and decide for yourself.