Coca-Cola: Earnings And FCF Are Not 'The Real Thing'

Feb. 04, 2021 7:15 AM ETThe Coca-Cola Company (KO) Stock14 Comments
Robert Honeywill profile picture
Robert Honeywill
8.15K Followers

Summary

  • Coca-Cola has achieved modest growth in EPS over the past 3 years.
  • Based on analysts' estimates, EPS growth is expected to pick up over the next four years.
  • There is an issue with Coca-Cola's reporting of GAAP and non-GAAP earnings - earnings and free cash flow are arguably not "the real thing" and are overstated.
  • At current share prices and based on traditional financial metrics, strong returns are possible over the next four years, with a caveat to watch the "equity Bucket" and possible unsustainable increases in debt levels.

Coca-Cola Investment Thesis

Coca-Cola outlook based purely on reported non-GAAP results and analysts' consensus EPS estimates -

The Coca-Cola Company (NYSE:KO) grew non-GAAP EPS by an average 3.38% for the three years ended December 2019. Based on analysts' consensus estimates, EPS is projected to grow by ~5.36% average per year from 2019 to 2023. Taking into account the current share price, analysts' consensus EPS estimates, dividend yield, and a range of historical P/E ratios, returns of ~12% to 18% average per year would appear possible, buying at current share price levels and holding through to end of 2023 (see discussion under Table 3 below). But things are not as they seem.

Coca-Cola performance based purely on reported free cash flows -

While finalizing this article, an article by Bill Maurer was published, "Coca-Cola: Dividend Raise Time", which includes the following -

When it comes to dividends, however, the really important metric is free cash flow. No matter how profitable (or not) you are, cash generation is what drives capital returns. In the table below, I've detailed key information regarding the company's financials from the past three years, along with a comparison of the first three quarters of 2019 and 2020.

The table shows free cash flows totaling $25,248 million and dividends totaling $23,331 million for the 3.75 years January 1, 2017 to September 30 2020. It would seem Coca-Cola's free cash flows exceeded dividends by $1,917 million over the 3.75 year period. But things are not as they seem.

Coca-Cola performance and outlook based on funds flowing into and out of Coca-Cola's "equity bucket" shows how things really are -

In my analyses, I take the extra step of checking what flows into and increases the contents of the shareholders' "equity bucket", and what flows out of the shareholders' "equity bucket", and for whose

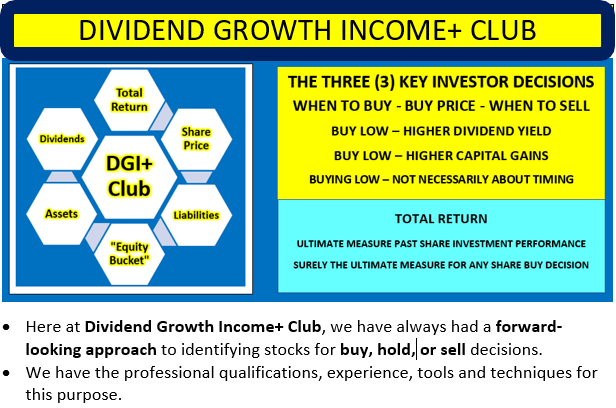
Dividend Growth Income+ Club Register today for your Free Trial.

Click Triple Treat Offer  (1) Your Free 2 Week Trial; (2) 20% Discount New Members; (3) Bespoke reviews for tickers of interest to subscribers.

This article was written by

Robert Honeywill profile picture
8.15K Followers
I am a retired accountant with a background in large mining projects, from feasibility to full-scale operation, large scale primary industry and food processing, commercialisation of university intellectual property, and consulting to small businesses, government departments and insolvency practitioners. I have gained a wealth of experience from having the extreme good fortune to work, in a cooperative environment, with so many people far more intelligent and smarter than me; from scientists and engineers with MBA qualifications, to University professors across a range of disciplines. Through the accident of mergers, acquisitions and dispositions, I held, at various times, financial controller positions within Utah International Inc, General Electric Inc, and BHP Billiton organizations. If I have a special skill, it is in methods of assessment of projects with long lives, where costs are front loaded and/or future revenues are subject to considerable degrees of uncertainty. In relation to stocks, I have a theory, using projections to calculate a present value per share is far less useful for a share buying decision, than using those same projections for calculating future value per share for determining potential exit value and rate of return.

Analyst’s Disclosure: I/we have no positions in any stocks mentioned, and no plans to initiate any positions within the next 72 hours. I wrote this article myself, and it expresses my own opinions. I am not receiving compensation for it (other than from Seeking Alpha). I have no business relationship with any company whose stock is mentioned in this article.

Disclaimer: The opinions in this document are for informational and educational purposes only and should not be construed as a recommendation to buy or sell the stocks mentioned or to solicit transactions or clients. Past performance of the companies discussed may not continue and the companies may not achieve the earnings growth as predicted. The information in this document is believed to be accurate, but under no circumstances should a person act upon the information contained within. I do not recommend that anyone act upon any investment information without first consulting an investment advisor and/or a tax advisor as to the suitability of such investments for their specific situation. Neither information nor any opinion expressed in this article constitutes a solicitation, an offer, or a recommendation to buy, sell, or dispose of any investment, or to provide any investment advice or service. An opinion in this article can change at any time without notice.

Seeking Alpha's Disclosure: Past performance is no guarantee of future results. No recommendation or advice is being given as to whether any investment is suitable for a particular investor. Any views or opinions expressed above may not reflect those of Seeking Alpha as a whole. Seeking Alpha is not a licensed securities dealer, broker or US investment adviser or investment bank. Our analysts are third party authors that include both professional investors and individual investors who may not be licensed or certified by any institute or regulatory body.

Recommended For You

About KO Stock

SymbolLast Price% Chg
Market Cap
PE
Yield
Rev Growth (YoY)
Short Interest
Prev. Close
Compare to Peers

More on KO

Related Stocks

SymbolLast Price% Chg
KO
--