Get ready for charts, images, and tables because they are better than words.
The ratings and outlooks we highlight here come after Scott Kennedy provides his weekly updates in the REIT Forum.
Your continued feedback is greatly appreciated, so please leave a comment with suggestions.
Our Strategy
We’re taking advantage of changes in price-to-book ratios. We believe we have vastly better information on these metrics than the average investor in these shares. That gives us an advantage. Is it “unfair?” That depends on your definition.

We earned excess returns through harder work. That seems perfectly fair to me. Some “investors” sit down at the table with no idea how the rules work. They think we might be playing “Go Fish.” That’s not on us. We’re publishing frequent articles explaining how the game works and letting investors know in real-time when we take (or close) a position.
Chronological Order
We’re already talking to investors about how to track shifting price-to-book ratios over time. It wouldn’t be fair to use a disjointed timeline. So we’ll run through the background briefly to set the stage. You're going to see how we opened a trade, doubled down, rode it higher, then swapped it for other positions with a healthy gain.
First Trade
On 1/14/2021 we purchased 4,000 shares of Capstead Mortgage Corporation (CMO). You can easily see that because we posted a trade alert and our order execution:
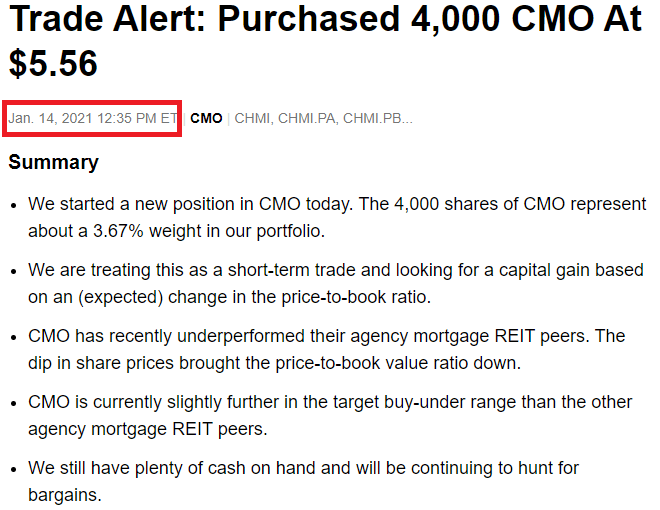
Source: The REIT Forum
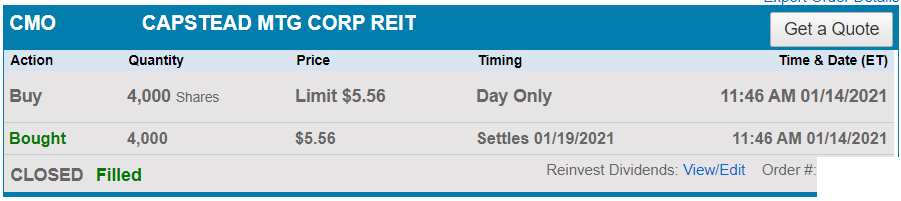
Source: Schwab
Second Trade
Prices rallied as we expected, but not quite far enough. Instead, shares dropped abruptly. Two weeks later, we were down about 5%. It was time to double down. Again, we posted an alert along with order execution:

Source: The REIT Forum
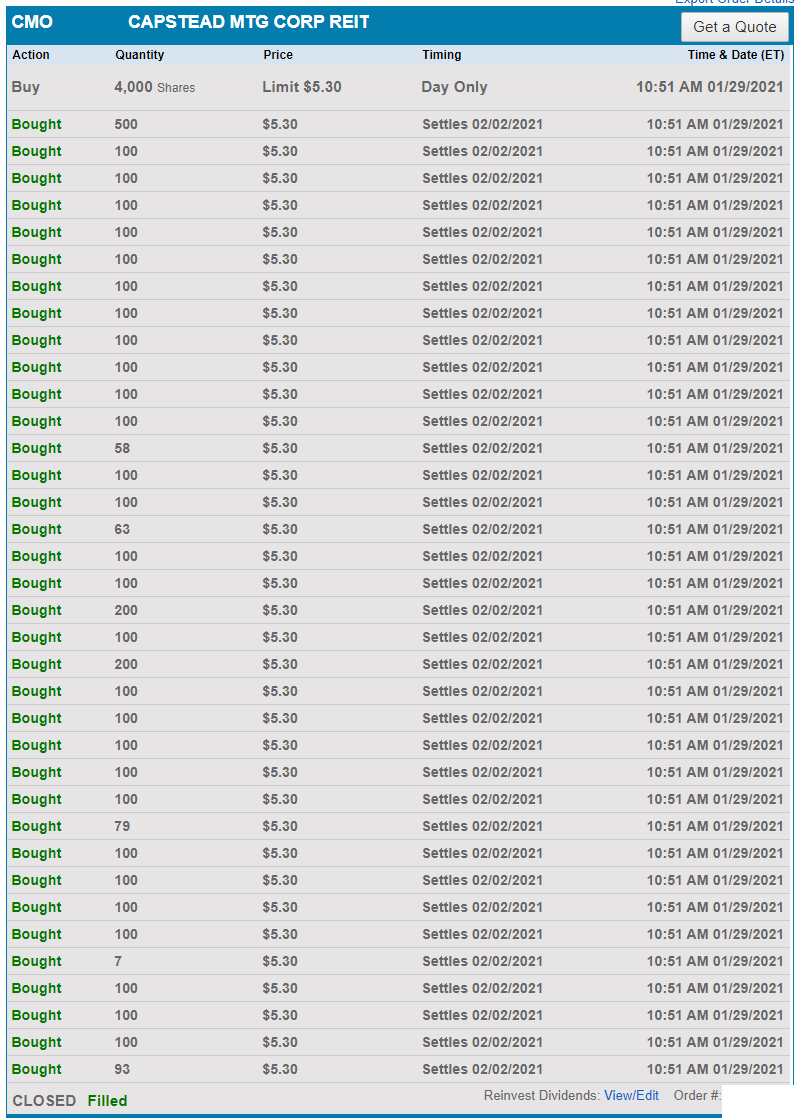
Source: Schwab
Announcement
We decided to highlight CMO for our public series so we could talk to investors about our largest mortgage REIT position:
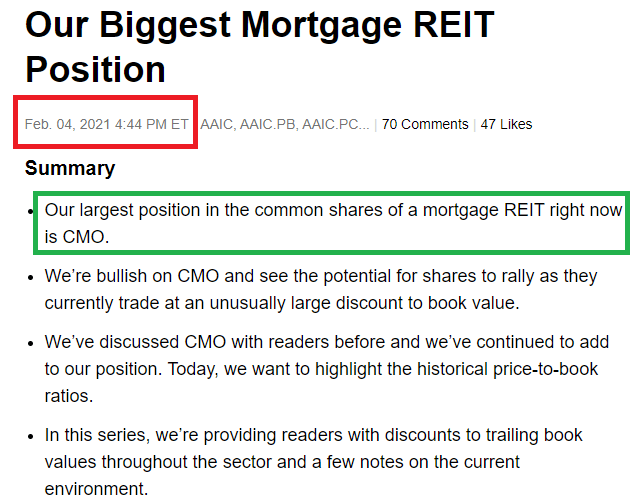
Source: Seeking Alpha
In doing so, we also highlighted that our target “buy-under” price was $5.80. As soon as shares broke $5.80, our outlook would shift to neutral.
Since we trade these positions actively, we double down on transparency. We included the following reference to our strategy:
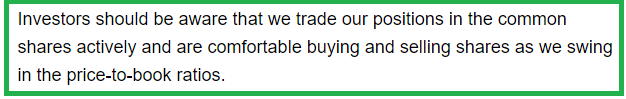
Third Trade
On 2/23/2021 we decided the shift in prices between shares was large enough for us to swap positions. So we posted another alert:
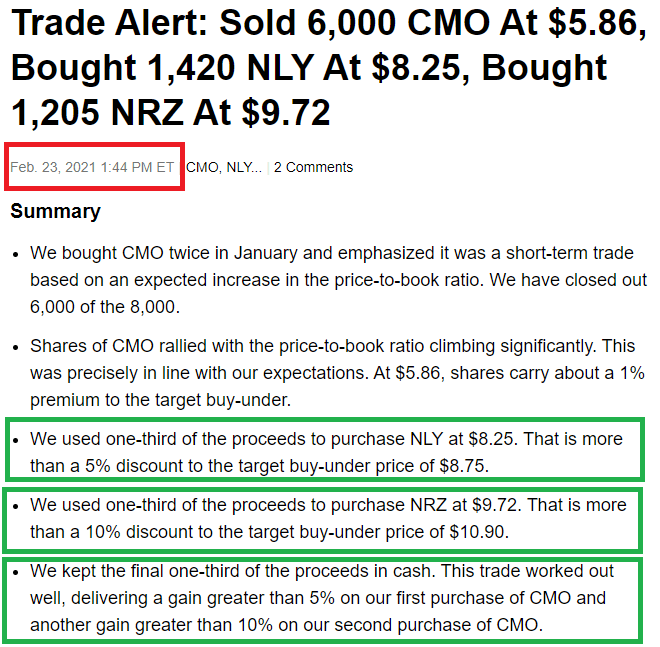
Source: The REIT Forum
We closed out 3/4ths of the position in CMO. We opened new positions in Annaly Capital Management (NLY) and New Residential (NRZ). If you’re reading the image above, you also can see the target prices for those positions.
Since we’re big on transparency, we’re including order execution again:

Source: Schwab
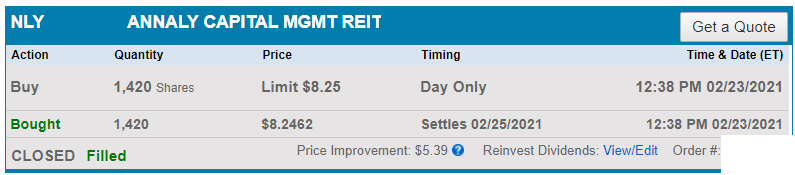
Source: Schwab

Source: Schwab
Why the delay between trades? I wanted to double check the target buy-under prices on NLY and NRZ, then set up a quick spreadsheet to calculate how many shares of each I would be buying to use the same total dollar value.
As of 2/23/2021, these were the returns on all our open positions in the common shares of mREITs and BDCs:
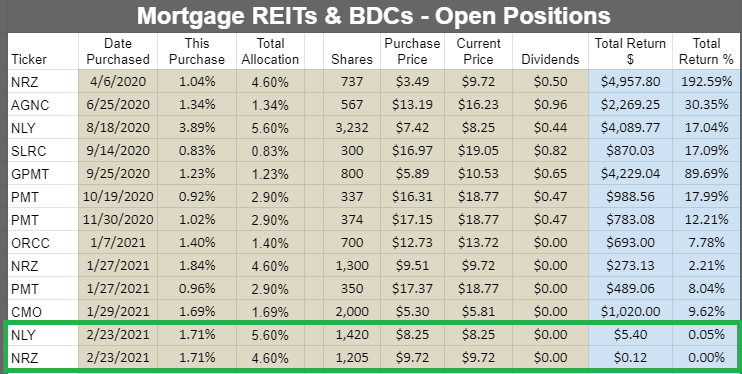
Source: The REIT Forum
From reading the chart above, you can tell that our largest positions in the common shares of mortgage REITs are in NLY and NRZ following the trade. CMO didn’t reach the point of being “expensive,” but we liked NLY at $8.25 and NRZ at $9.72 better than CMO at $5.86.
Note: The chart covers common shares, but excludes preferred shares. Our preferred share positions are still included in the disclosures section.
Note 2: We still own 2,000 shares of CMO purchased on 1/29/2021. These are shown in the image just above the green box.
The returns on the shares we closed are shown below:
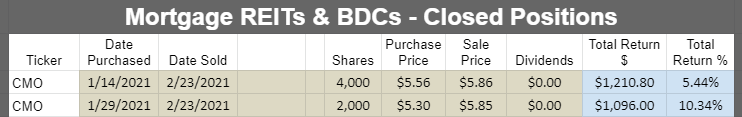
Source: The REIT Forum
The first trade resulted in a 5.44% return and the second trade resulted in a 10.34% return. The dollar values shown in the sheet are rounded to the nearest penny, but the calculations use the complete (not rounded) value.
The $100k Chart
The $100k chart, showing how much needed to be invested on any day to reach $100k today (chart as of 2/23/2021). I set it to a short period to highlight the change in values. The chart uses the closing value for each day, so it doesn’t account for changes within the day we purchase shares.
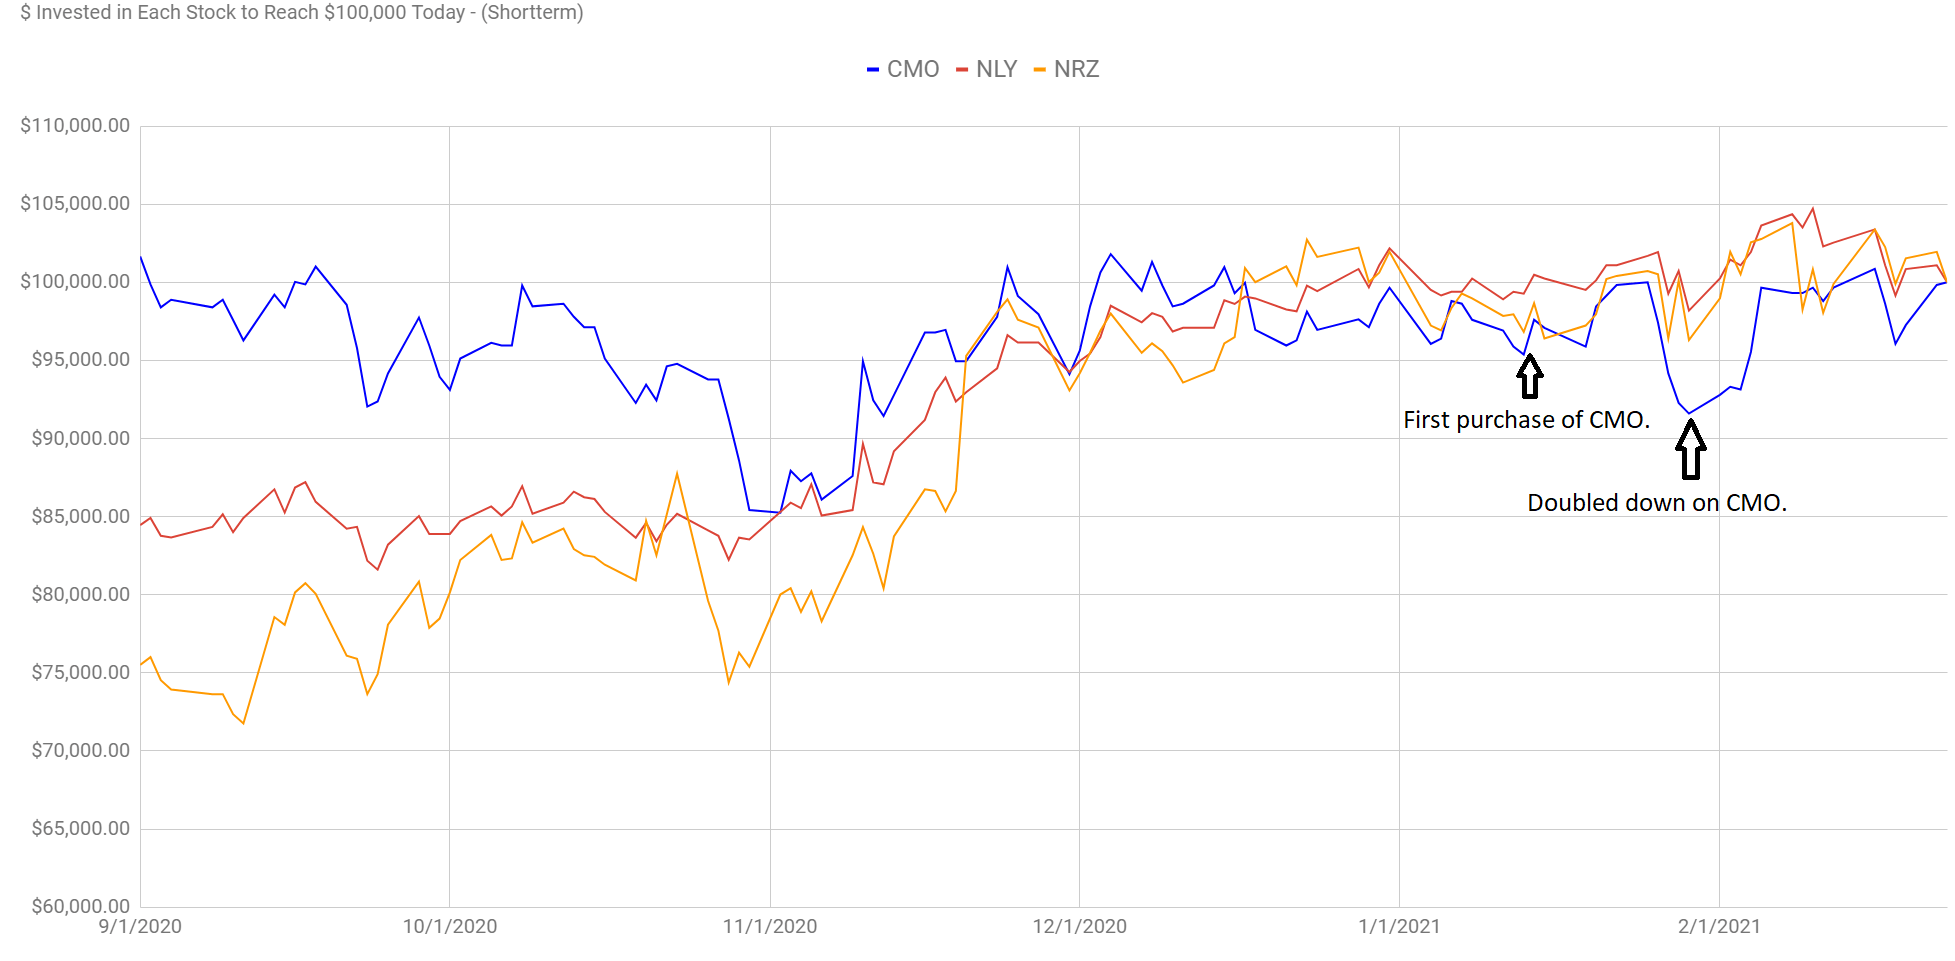
CMO had a respectable performance here, especially from the day we doubled down.
We waited for months while the opportunity developed in CMO. When it appeared, we were ready to take it. The risk/reward profile had tilted in our favor.
There’s nothing wrong with an investor who wants to “buy and hold.” It’s a fine strategy and I encourage people to use it in other sectors. For some people, it makes sense in this sector. Who should use buy and hold in this sector? Investors who are determined to invest in this sector without reading our work.
Where does buy-and-hold really excel? When you’re dealing with a long-term growth stock, it’s a great choice. You also can use it effectively on the preferred shares where you can be confident that the face value won’t change. When we talk about mortgage REITs, we are talking about a leveraged portfolio of option-embedded bonds with extensive hedging. Investors who can visualize the change in value of that portfolio in real time are going to be months ahead of investors who are just waiting for earnings updates. There’s a huge difference between saying: “I wonder what the earnings release will contain” and "let’s see if it confirms my projections."
Stock Table
We will close out the rest of the article with the tables and charts we provide for readers to help them track the sector for both common shares and preferred shares.
We’re including a quick table for the common shares that will be shown in our tables:
Type of REIT or BDC | ||||
Agency | Hybrid | Multipurpose | Commercial | BDC |
Let the images begin!
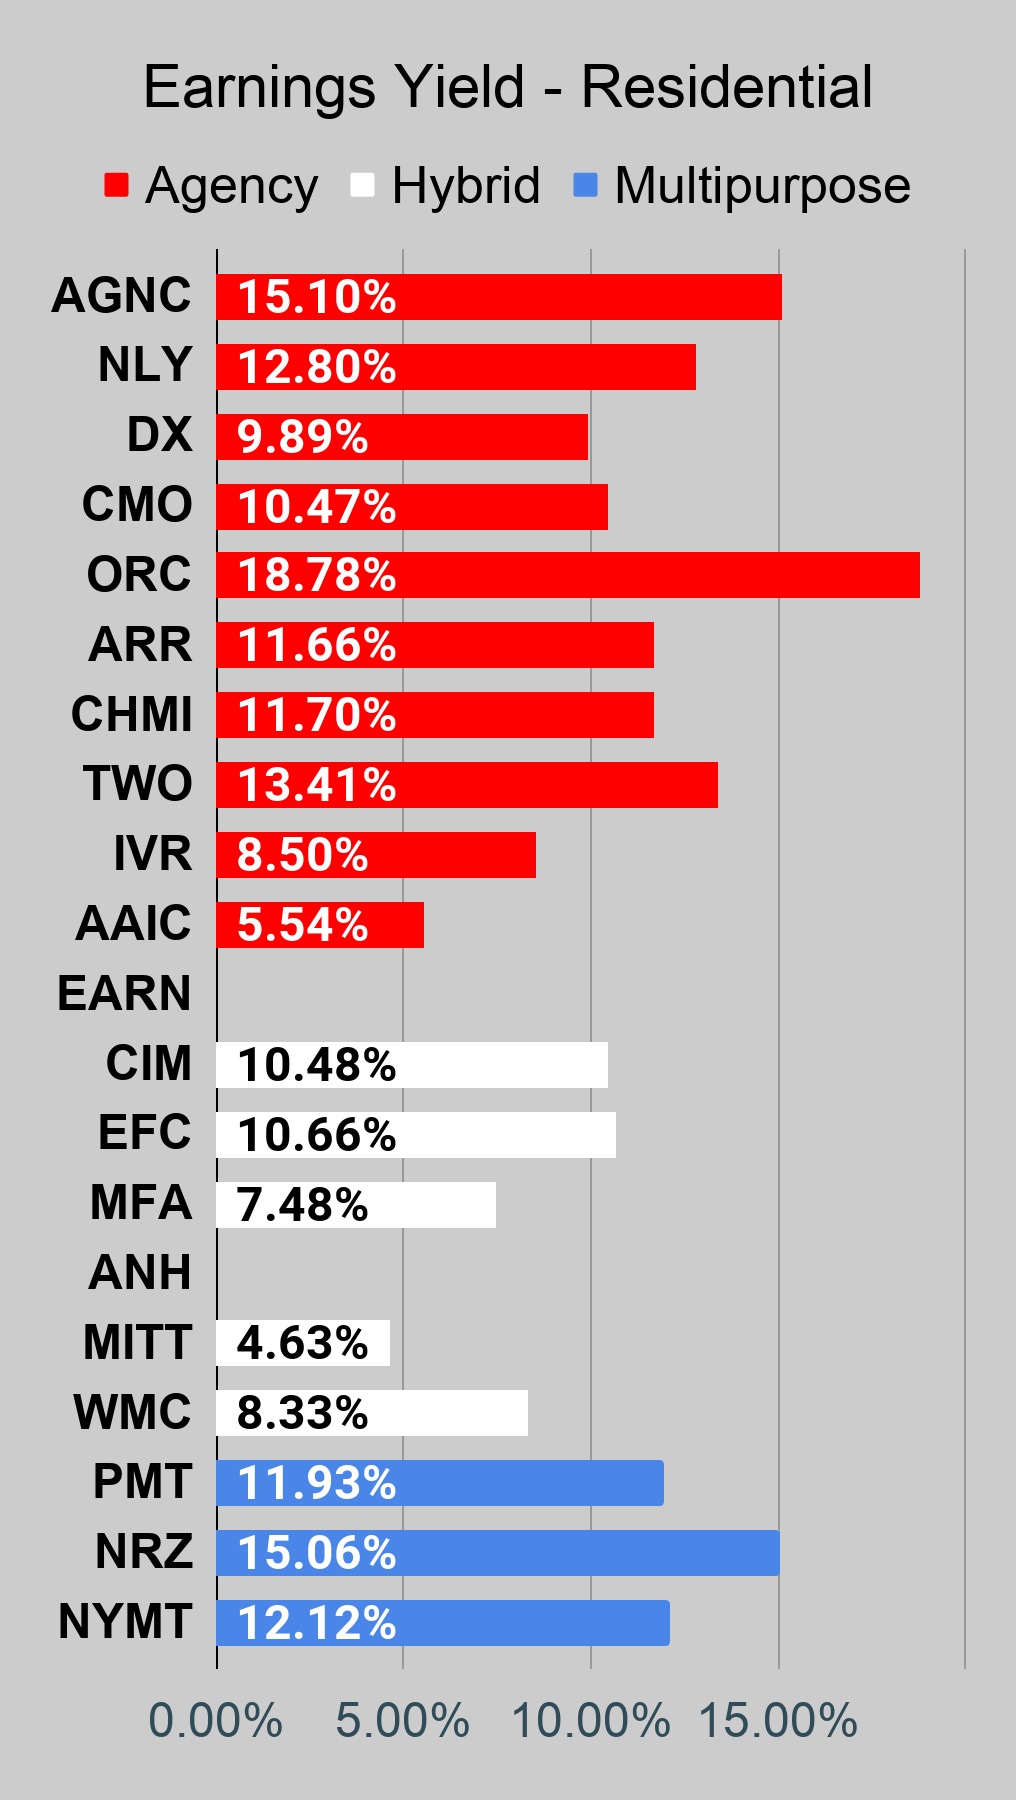
Residential Mortgage REIT Charts
|
|
|
Source: The REIT Forum
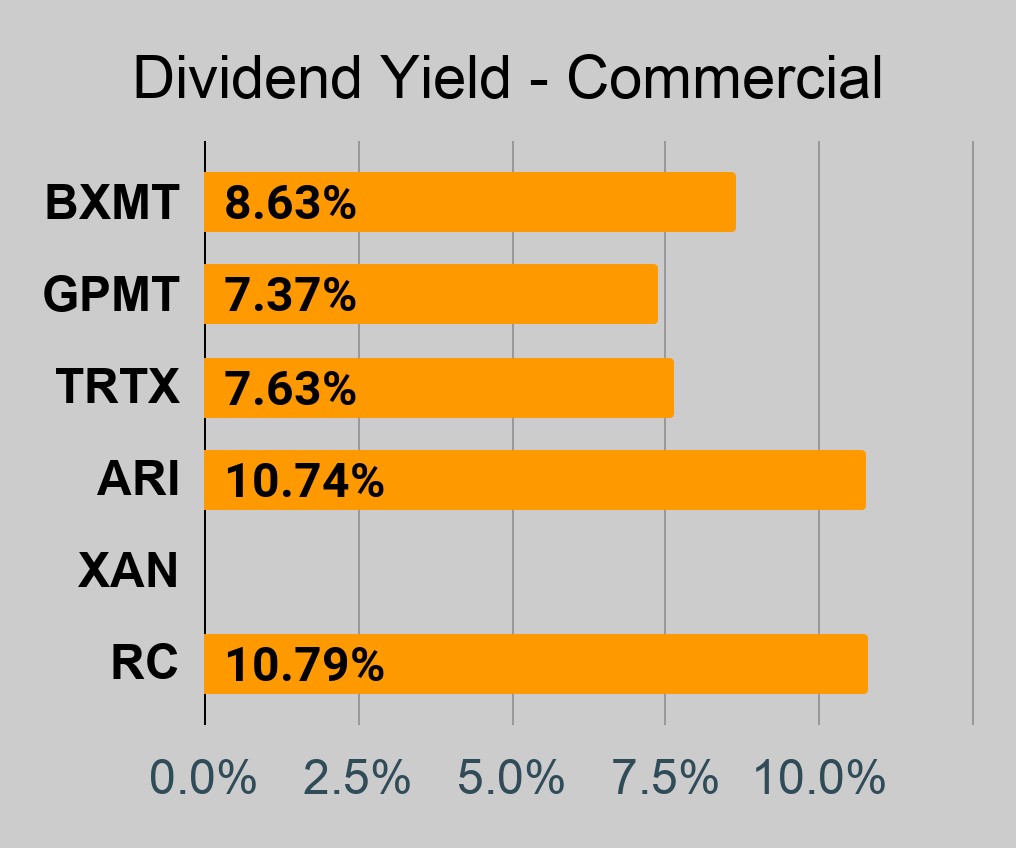
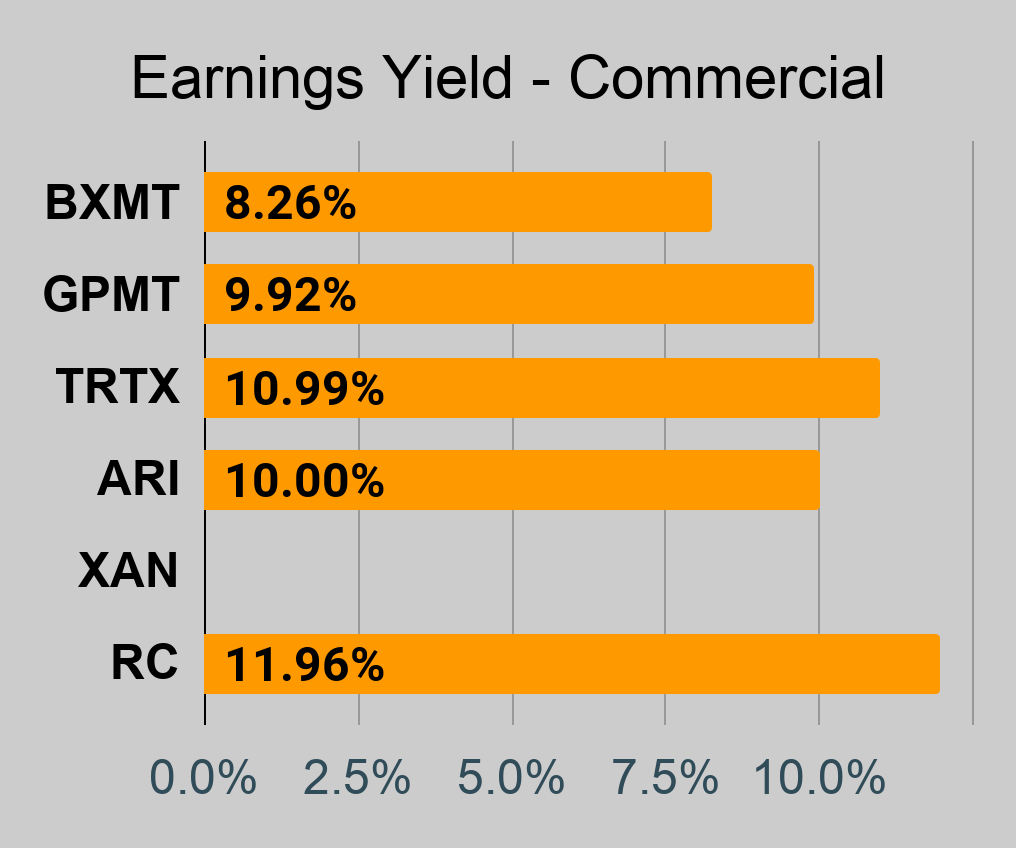
Commercial Mortgage REIT Charts
|
|
|

BDC Charts
|
|
|
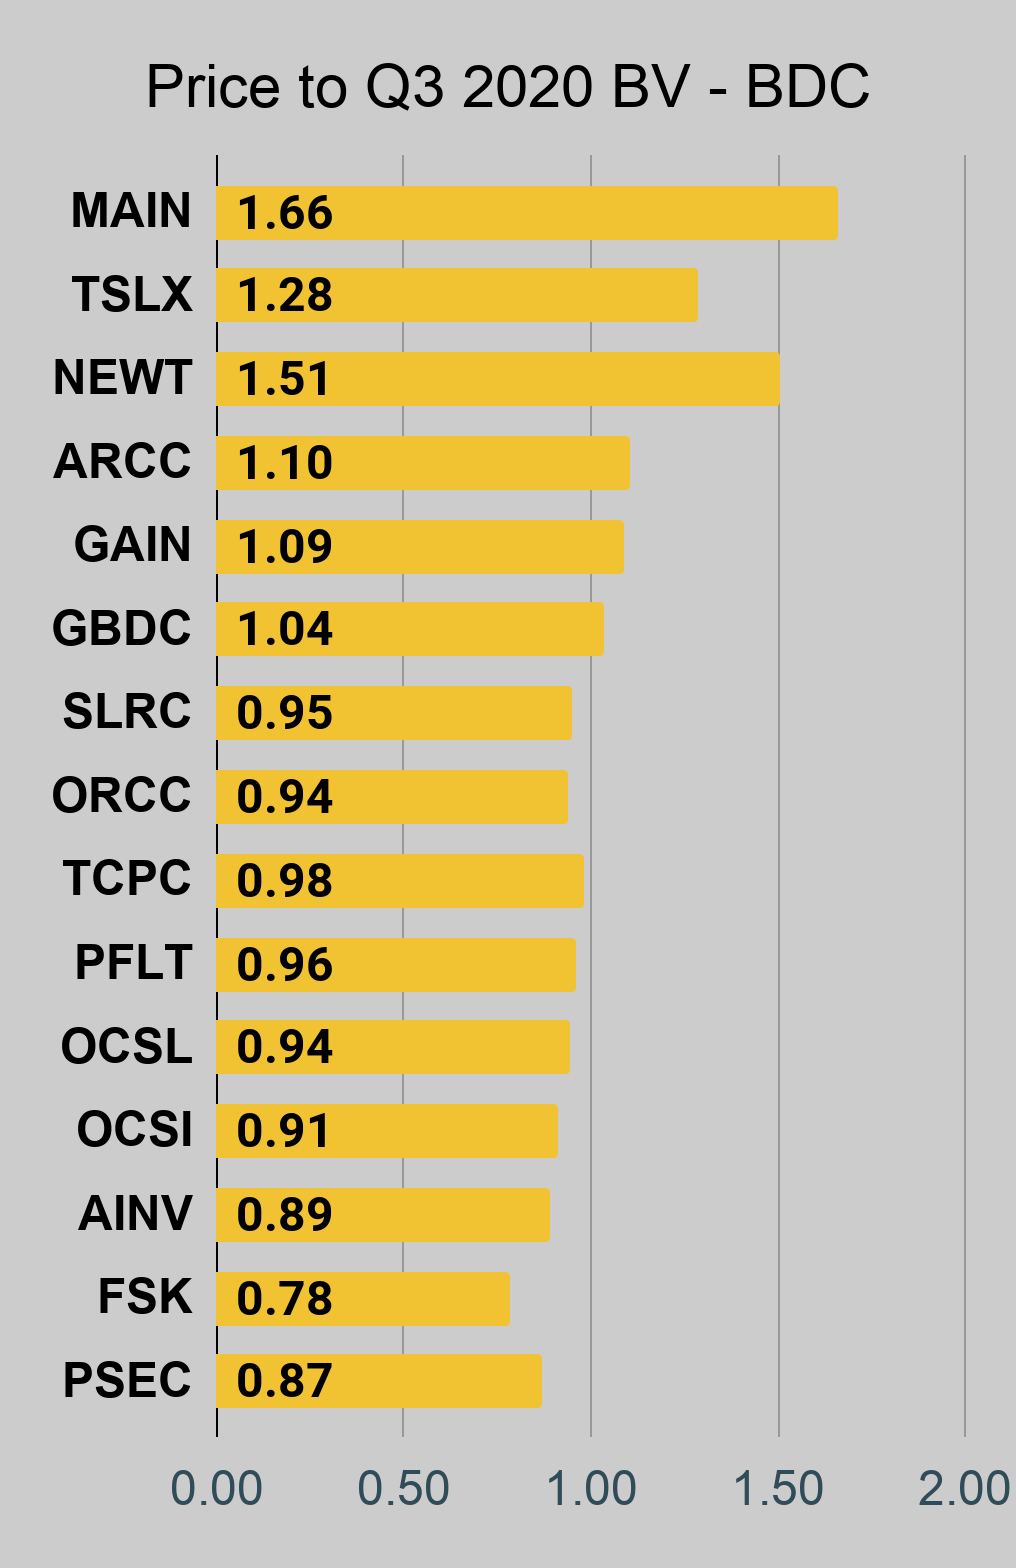
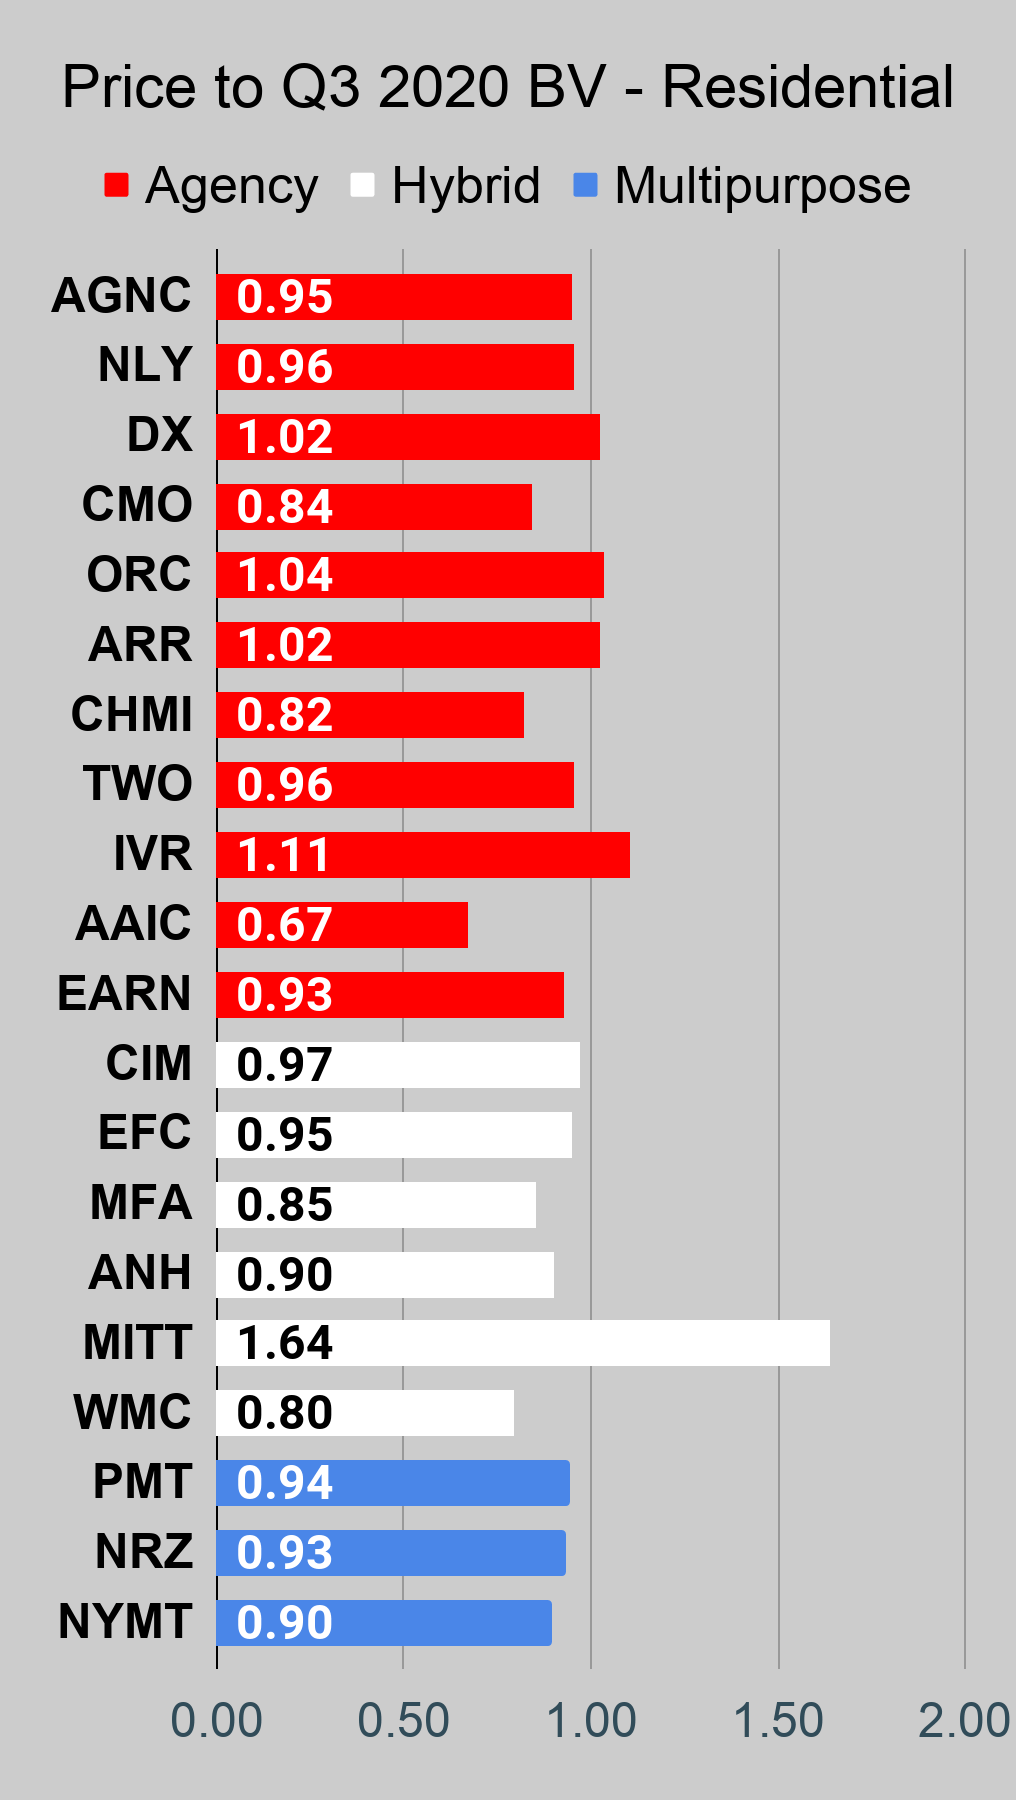
Notes on Price-to-Trailing Book Ratios - Using Q3 2020 Book Value
Remember that these are price-to-trailing-book ratios. They are not using estimates of current book value. Book values continue to change every day. Scott Kennedy provides frequent updates on estimated book value, ratings, and price targets through The REIT Forum.
Repeated Note: There are two mortgage REITs we need to highlight here:
- AG Mortgage Investment Trust - We are using the Q3 2020 book value reported by management, which does not deduct the value of accrued dividends for preferred shares. If the preferred dividends were paid, it would reduce common book value under these calculations. This method is accepted under GAAP.
- MFA Financial reports “GAAP book value” and “economic book value.” We’ve chosen to use the GAAP book value to remain consistent.
Unfortunately, we have to repeat those bullet points every time we publish because it regularly comes up if we don’t mention it.
Notes on Price-to-Trailing Book Ratios - Using Q4 2020 Book Value
This chart isn’t ready yet because we haven’t had that many reports. However, we will be adding it to the sheet soon. For a while, we will be running price-to-trailing book ratios in two charts. Why? Investors shouldn’t compare the price to Q4 2020 book value for one REIT against the price to Q3 2020 book value for another REIT. By simply providing two charts, we will enable investors to ensure they are using comparable data. Here is a chart using Q4 2020 data. If the REIT didn’t report at least a few days ago, the line will be blank:
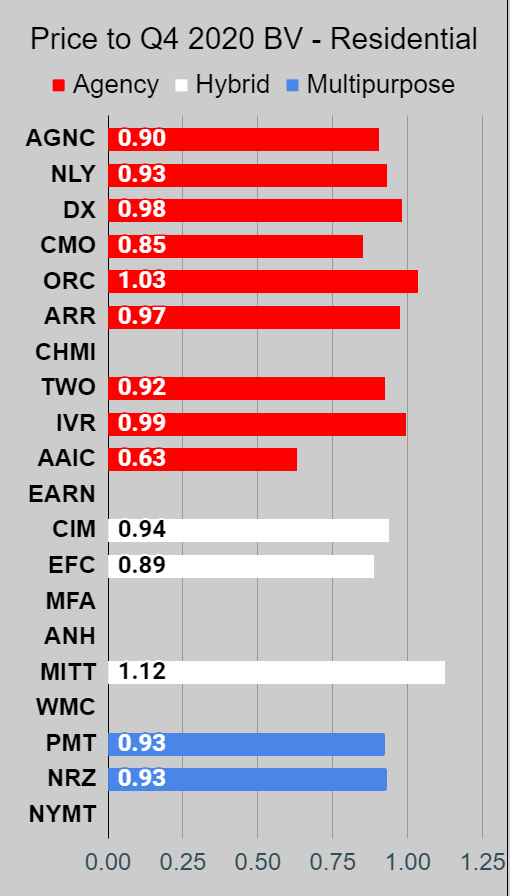
Source: The REIT Forum
We have updates shortly after the earnings are announced, but we’re focusing on using current estimates rather than trailing values. Consequently, this chart is just built for the public article.
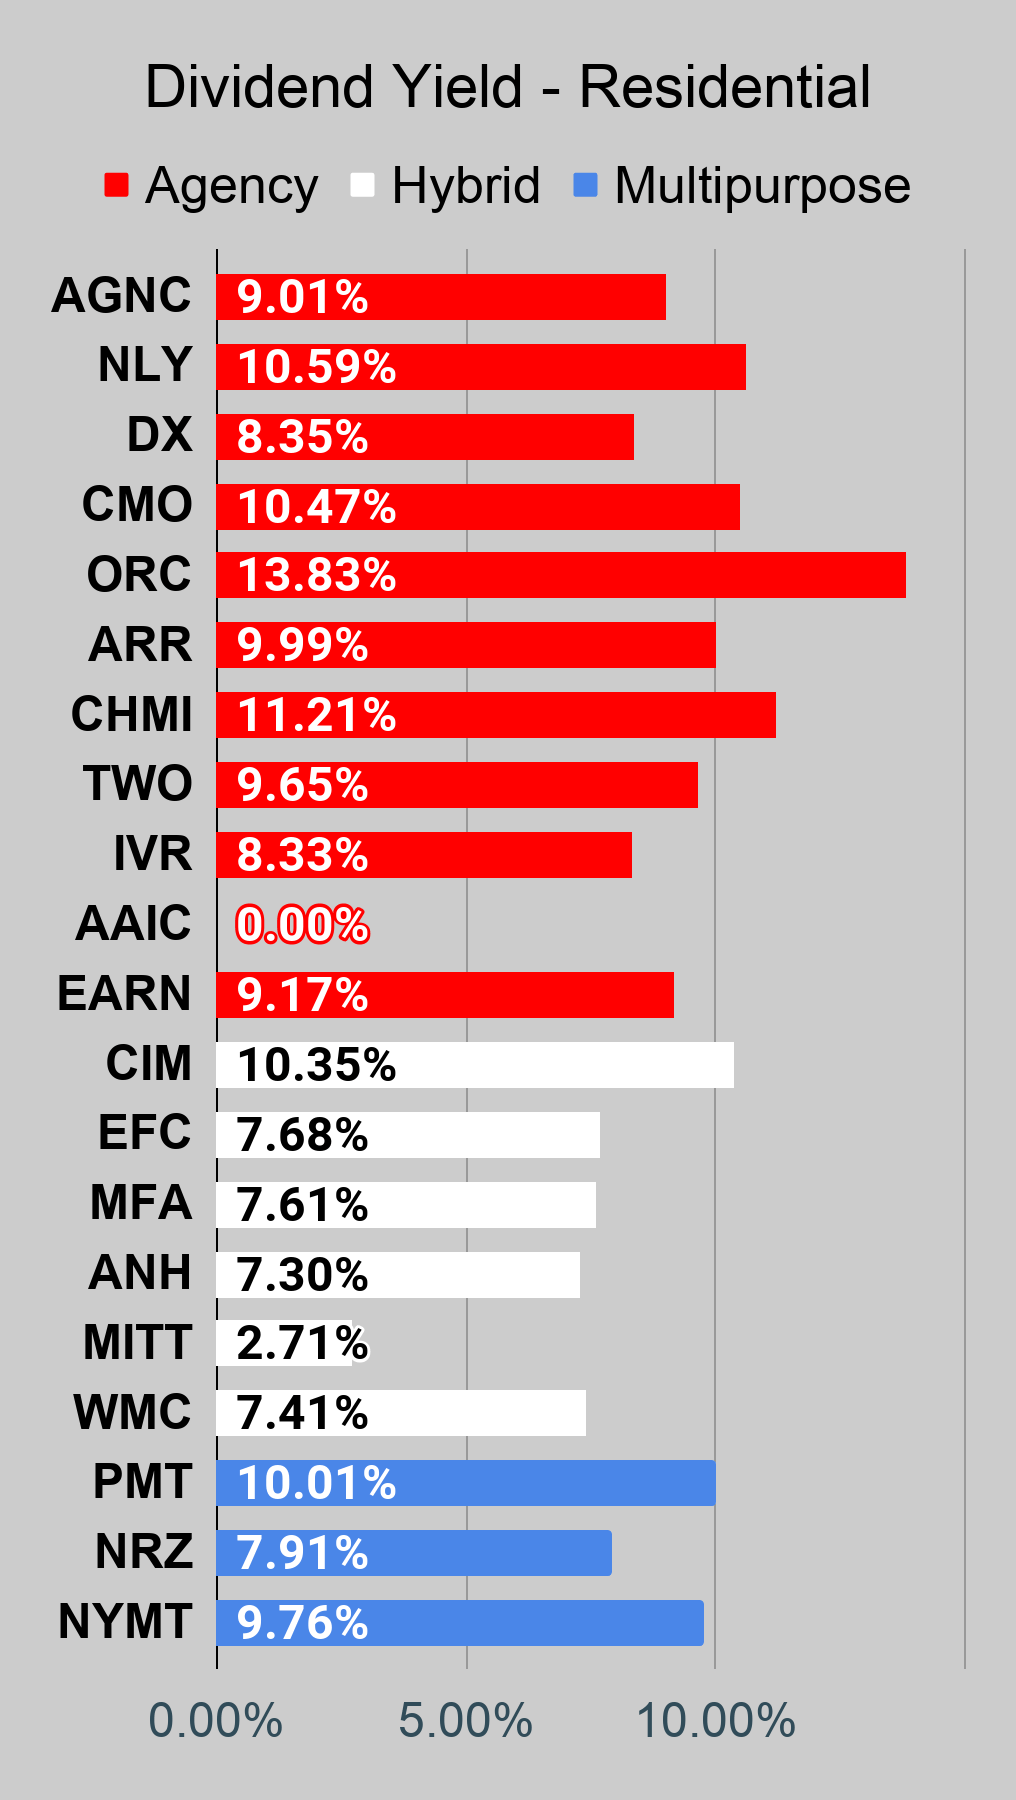
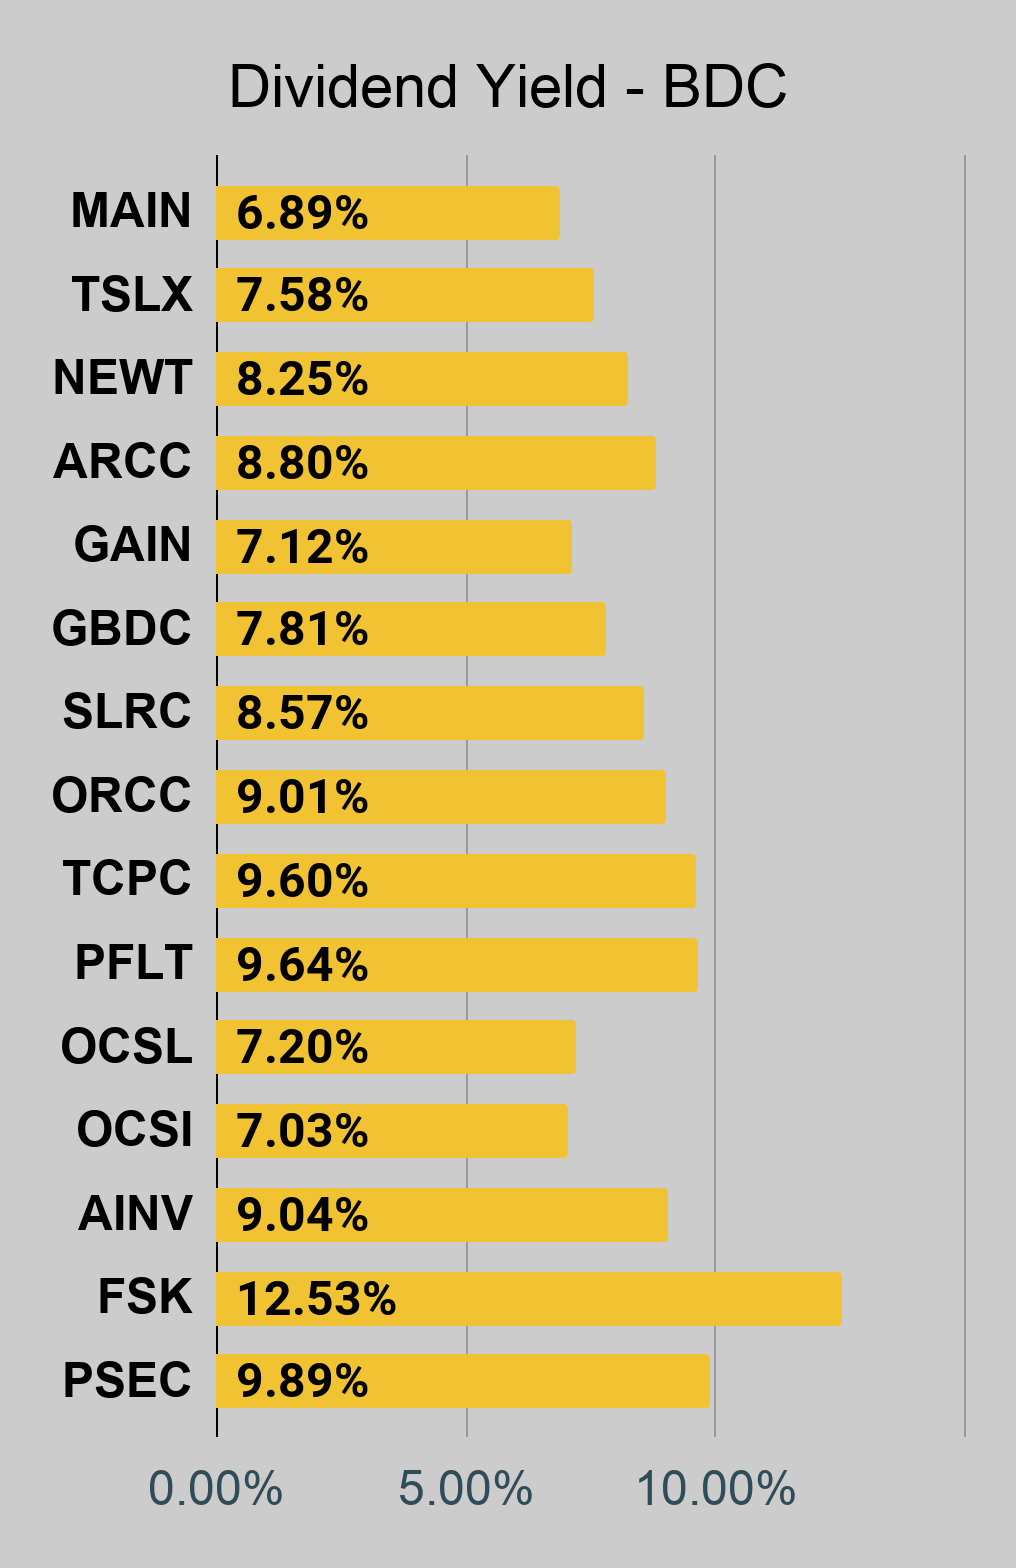
Notes on Common Share Dividend Yield
Dividend yield often comes up in the comments, but picking based on dividend yield is stupid and regularly results in terrible performance. Don’t do it.
This chart is still in the same order as the prior charts. Consequently, you know the highest price-to-book ratios (using trailing GAAP book value) for each segment will be at the top. If you see a mistake, please feel free to say something. Occasionally the data for dividend rates requires a manual update.
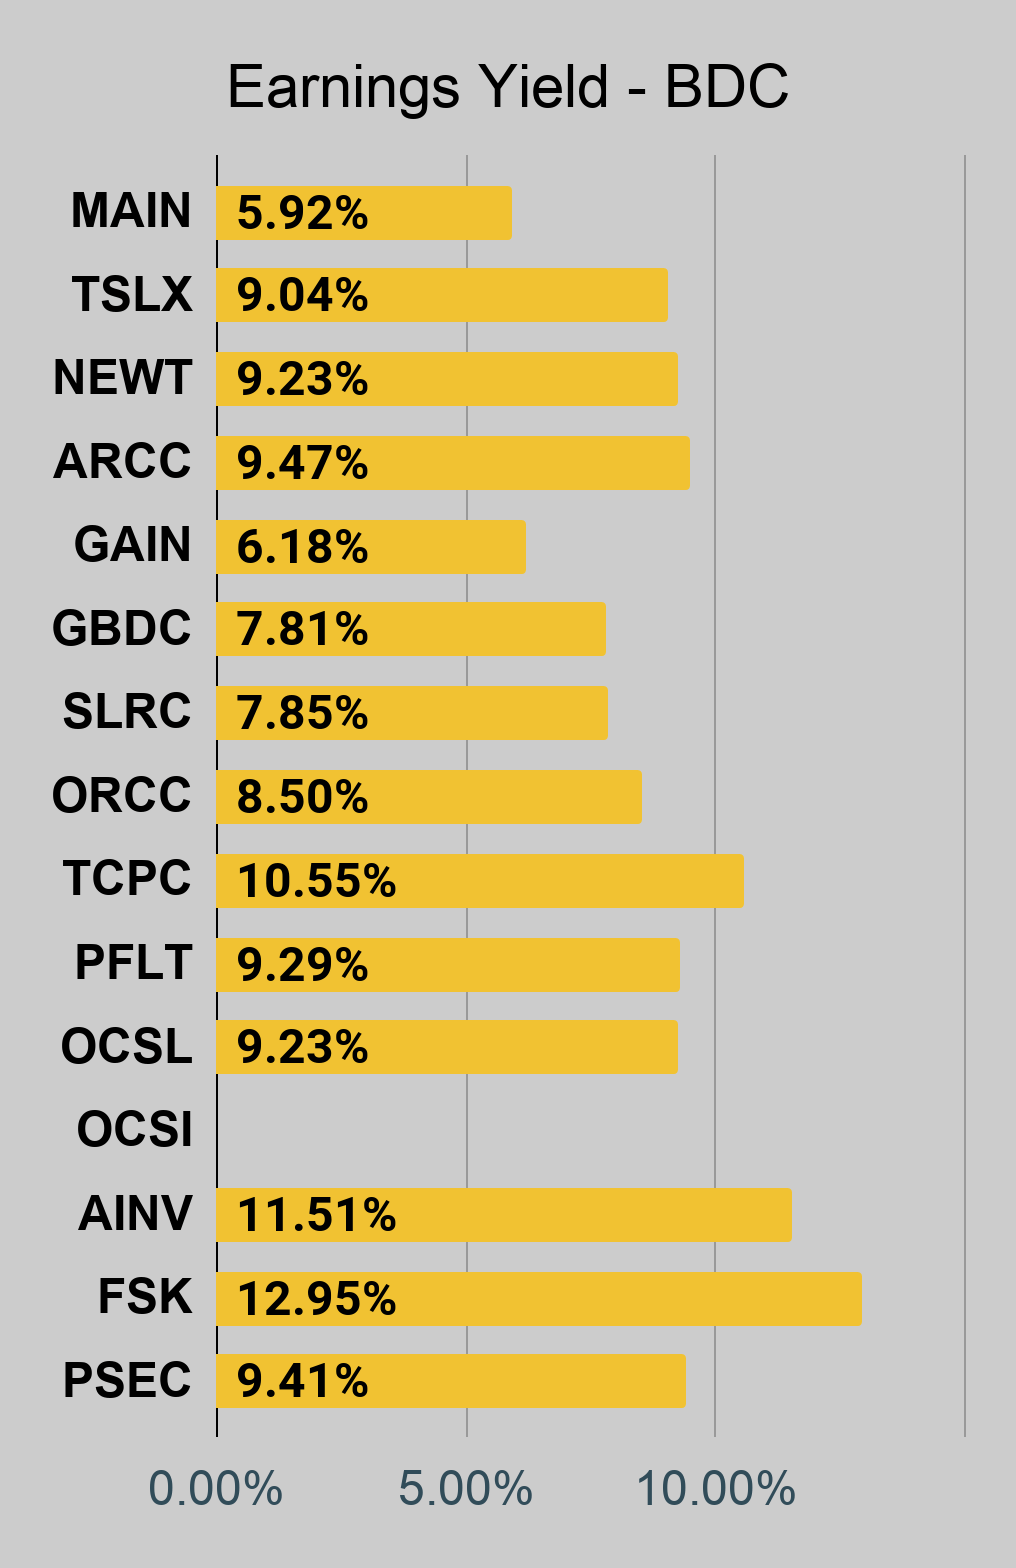
Notes on Earning Yields
One of the next things investors may ask about is the yield using core earnings. This chart puts together the core earnings based on the consensus analyst estimate. Beware that the consensus estimate may not always be the best estimate. Further, there are ways to increase “Core Earnings” through accounting decisions or modifying hedges. Consequently, investors should still take these values cautiously. We do not depend on the consensus estimate to make decisions.
Preferred Share Charts
|
|
|
|
|
|
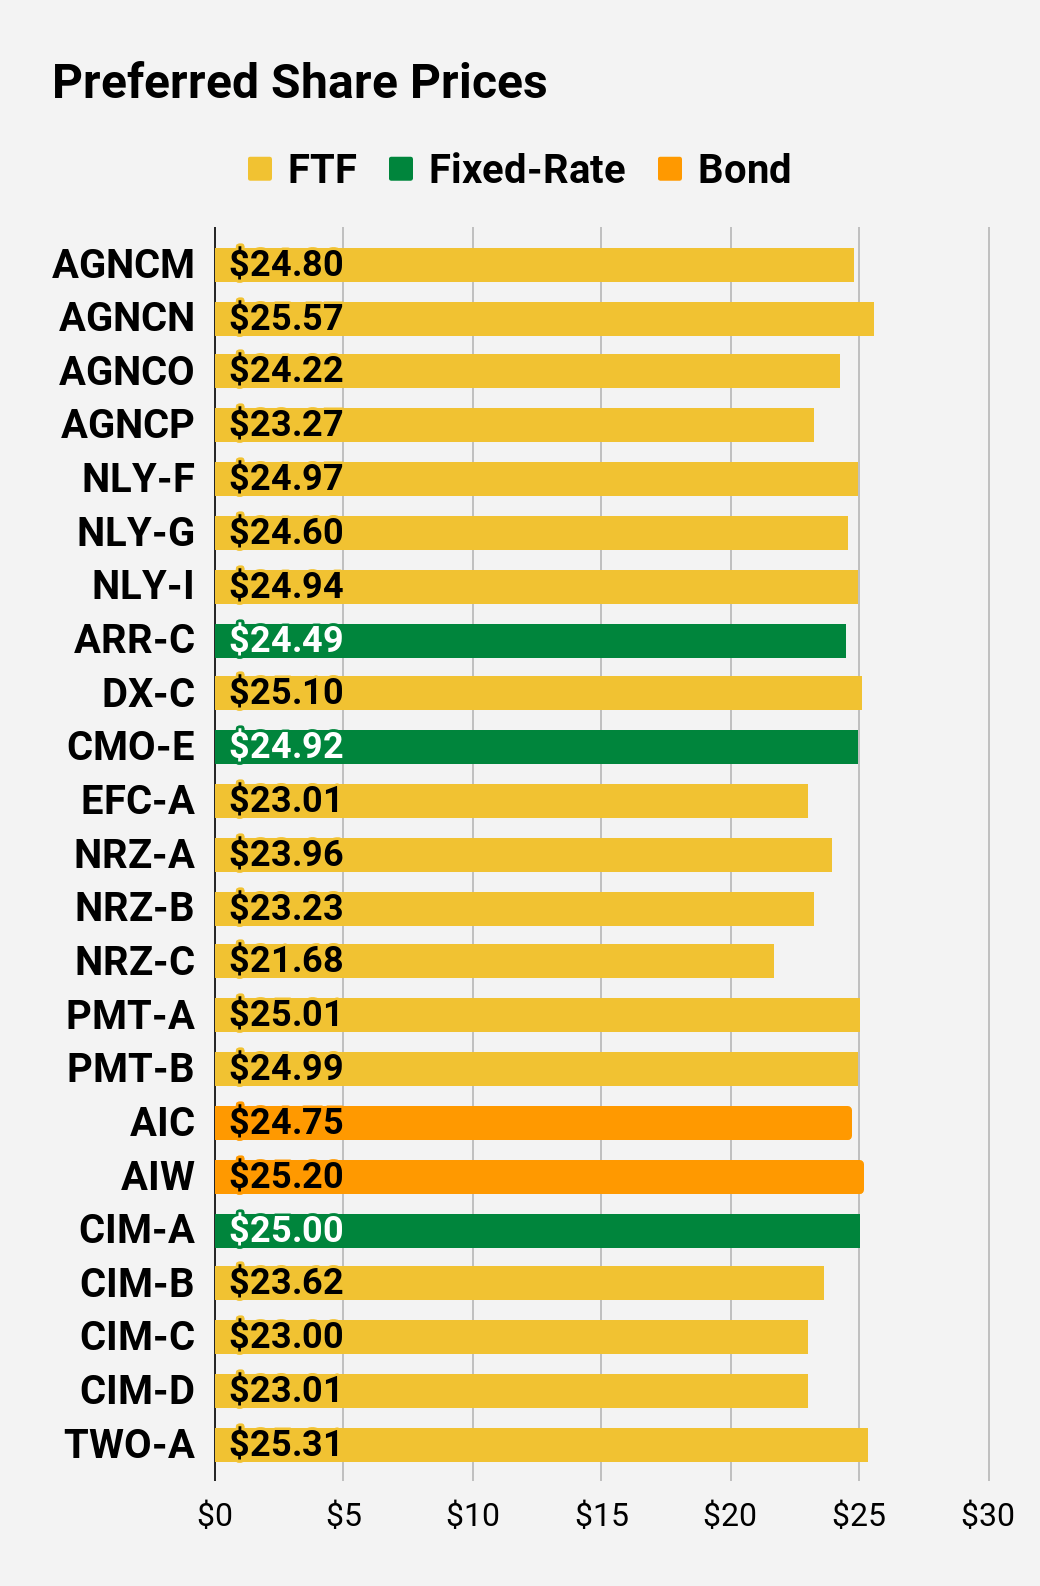


Notes on Preferred Share Prices
This chart gives you a pretty quick feel for which shares are trading at a discount to call value. Each of these preferred shares has a call value of $25.00, but that doesn’t mean a share will be called. The company decides if they want to issue a call or not.
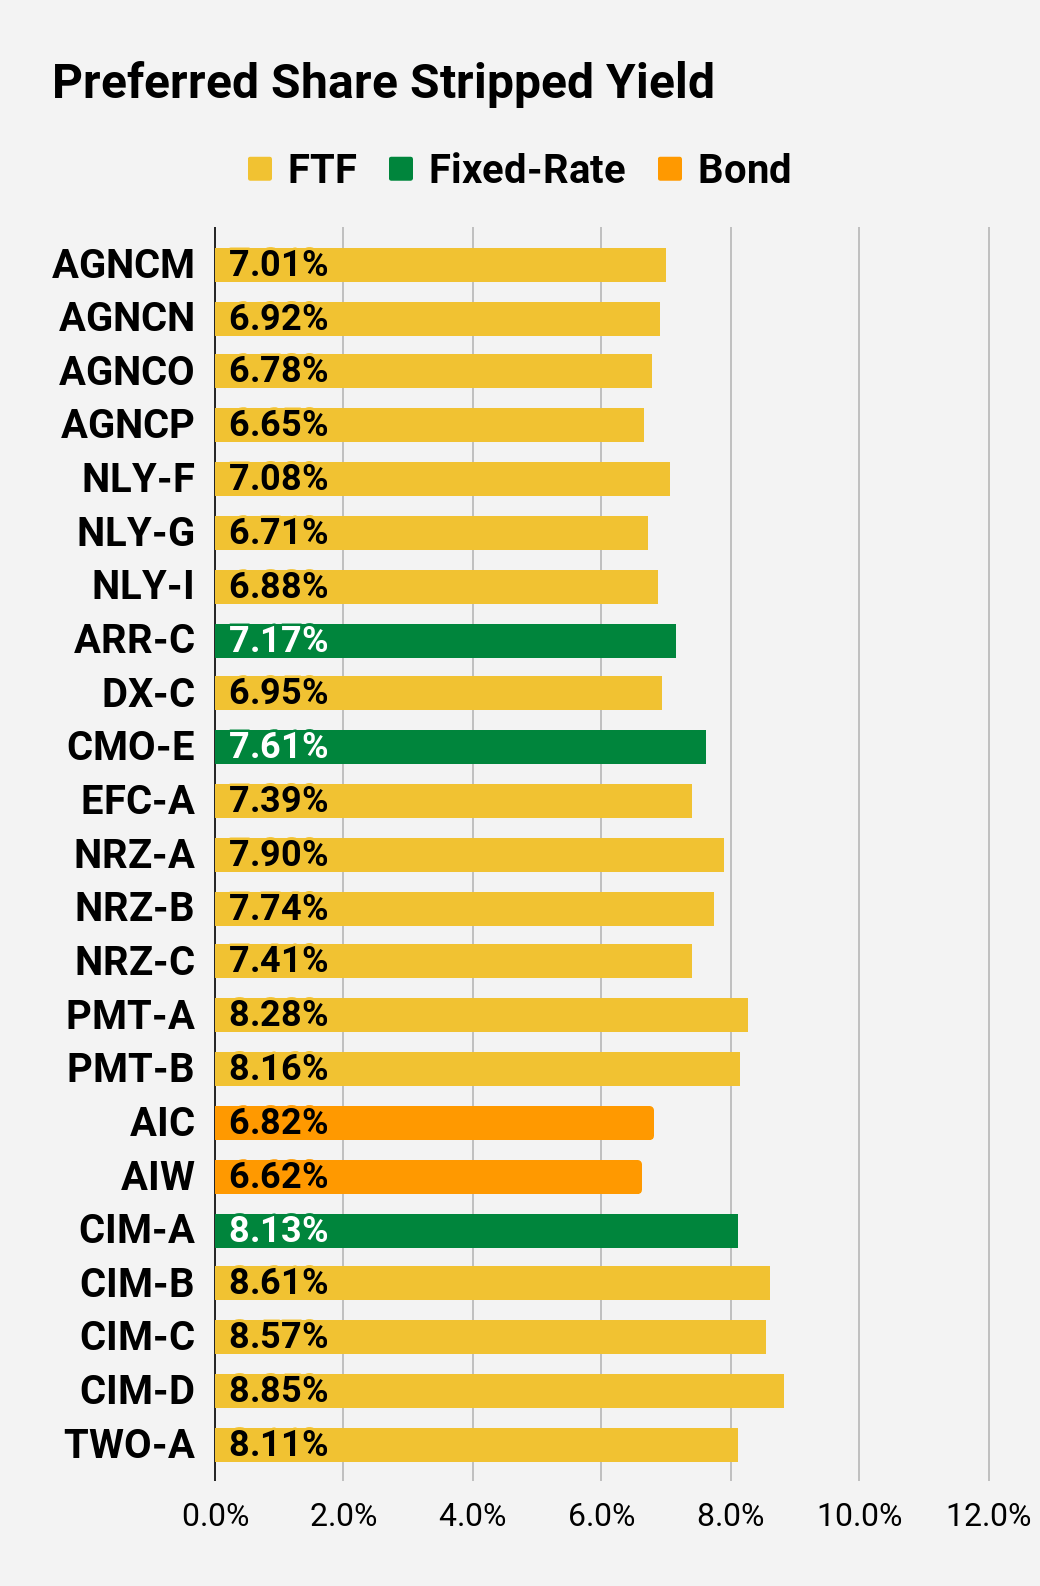
Notes on Dividend Yield / Stripped Yield
Stripped yields are vastly more useful than “current” yields for preferred shares. The stripped yield uses the stripped price. That’s different from using the current price because it means we already adjusted for dividend accrual. This makes the process easier for investors.
We can talk about shares using “regular prices.” Those are the prices an investor would actually use when entering an order.
However, we will provide the stripped yield to adjust for the dividend accrual. In the spreadsheets we host for subscribers, we include the actual ex-dividend date, or the projected ex-dividend date if the actual date isn’t yet known. If you’re planning to buy a share, it’s always wise to check if the shares just went ex-dividend so you can adjust your targets accordingly.
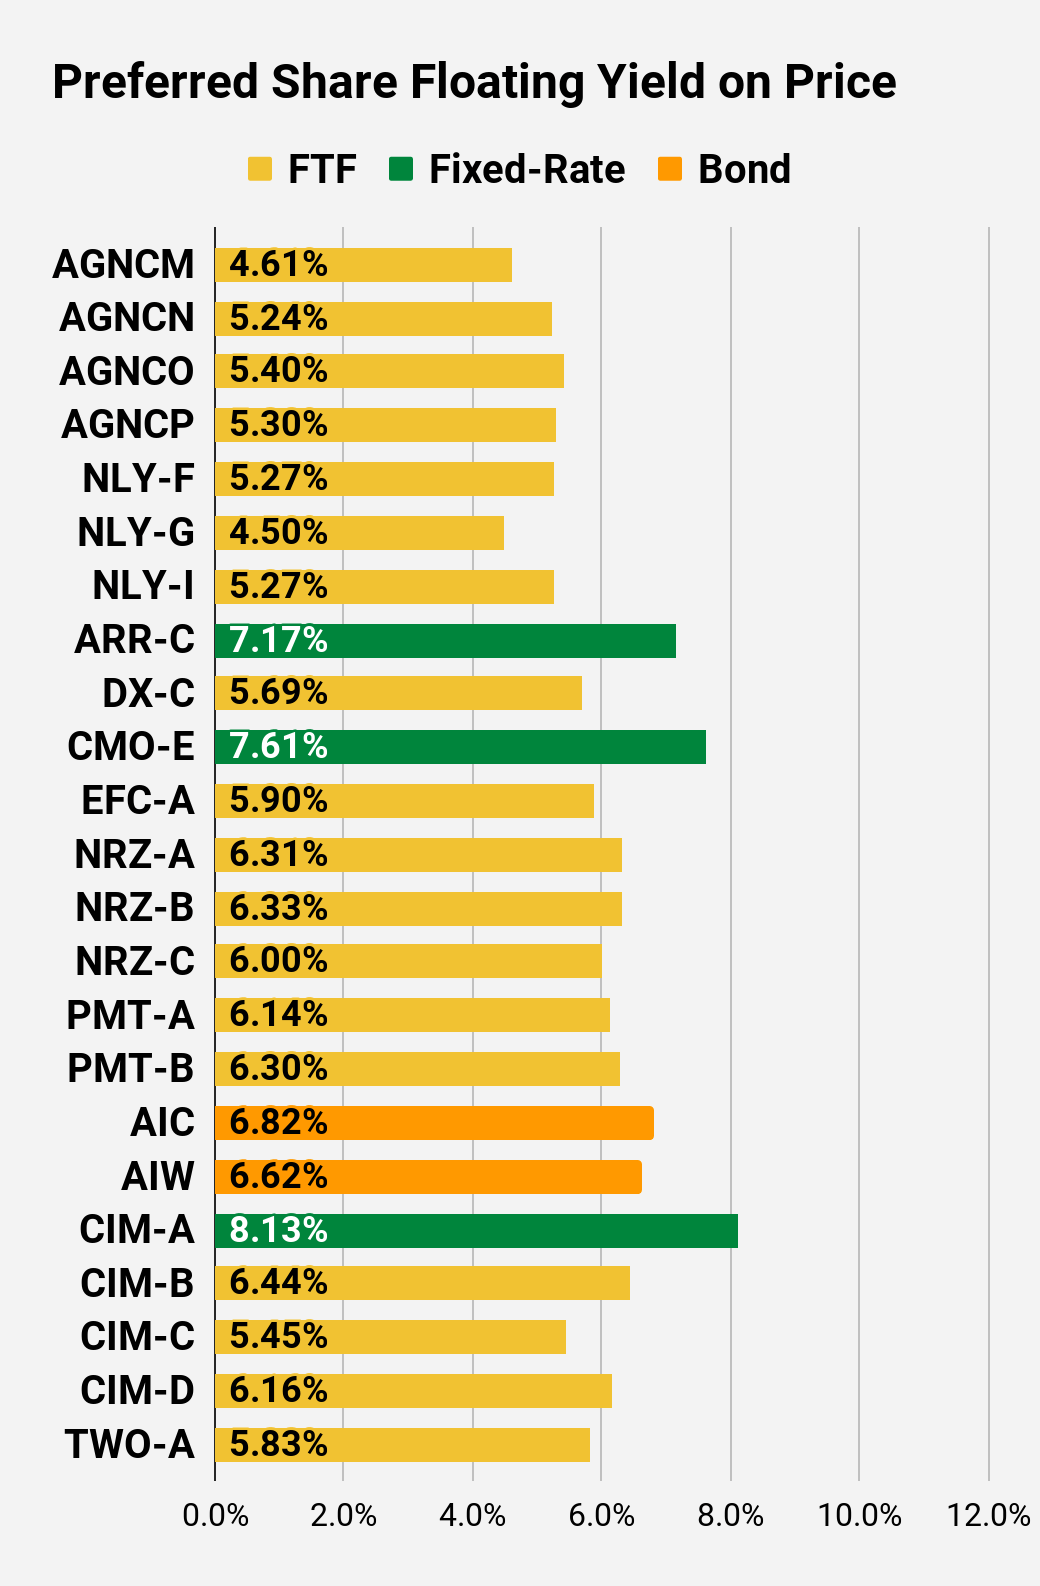
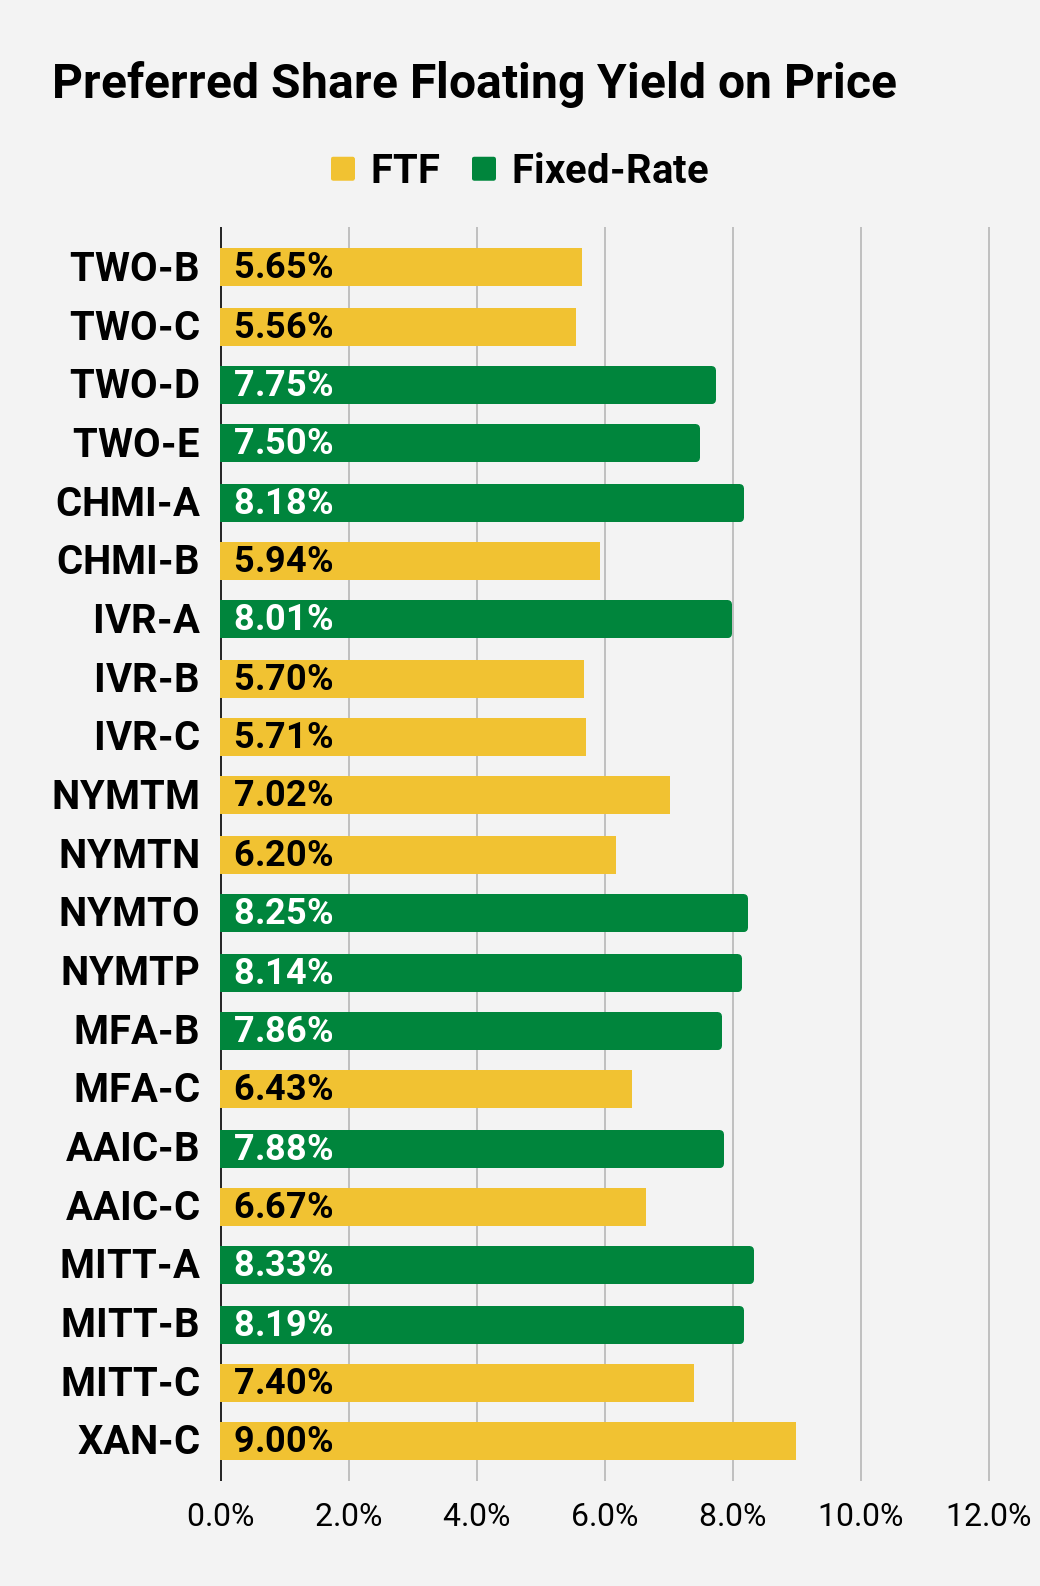
Notes on Floating Yield on Price
Since many of these shares switch over to floating rates, we also want to consider what the yield would be if the floating rate was in effect and shares were still at the current price. To demonstrate that, we use the “Floating Yield On Price.” If the share remains at a fixed rate indefinitely, then the value doesn’t change.
One point we need to emphasize here is that we are dealing with yields. A yield must involve the share price. We aren’t simply showing the new “rate” if the share began floating, we are adjusting the new rate for the stripped price.
Floor
XAN-C has a floor that interferes with the eventual floating rate. The floor prevents the floating rate from being less than the initial fixed rate. Consequently, while XAN-C is one of the FTF shares, it doesn’t exhibit the same decrease as other FTF shares when we switch over to the “Floating Yield on Price.” However, it remains a higher-risk share because of the type of assets the REIT owns.
Preferred Share Data
Beyond the charts, we’re also providing our readers with access to several other metrics for the preferred shares.
After testing out a series on preferred shares, we decided to try merging it into the series on common shares. After all, we are still talking about positions in mortgage REITs. We don’t have any desire to cover preferred shares without cumulative dividends, so any preferred shares you see in our column will have cumulative dividends. You can verify that by using Quantum Online. We’ve included the links in the table below.
To better organize the table, we needed to abbreviate column names as follows:
- Price = Recent Share Price - Shown in Charts
- BoF = Bond or FTF (Fixed-to-Floating)
- S-Yield = Stripped Yield - Shown in Charts
- Coupon = Initial Fixed-Rate Coupon
- FYoP = Floating Yield on Price - Shown in Charts
- NCD = Next Call Date (the soonest shares could be called)
- Note: For all FTF issues, the floating rate would start on NCD.
- WCC = Worst Cash to Call (lowest net cash return possible from a call)
- QO Link = Link to Quantum Online Page
Ticker | Price | BoF | S-Yield | Coupon | FYoP | NCD | WCC | QO Link | P-Link |
$24.80 | FTF | 7.01% | 6.88% | 4.61% | 4/15/2024 | $5.79 | |||
$25.57 | FTF | 6.92% | 7.00% | 5.24% | 10/15/2022 | $2.49 | |||
$24.22 | FTF | 6.78% | 6.50% | 5.40% | 10/15/2024 | $6.88 | |||
$23.27 | FTF | 6.65% | 6.13% | 5.30% | 4/15/2025 | $8.24 | |||
$24.97 | FTF | 7.08% | 6.95% | 5.27% | 9/30/2022 | $3.07 | |||
$24.60 | FTF | 6.71% | 6.50% | 4.50% | 3/31/2023 | $4.05 | |||
$24.94 | FTF | 6.88% | 6.75% | 5.27% | 6/30/2024 | $5.97 | |||
$24.49 | 7.17% | 7.00% | 7.17% | 1/28/2025 | $7.37 | ||||
$25.10 | FTF | 6.95% | 6.90% | 5.69% | 4/15/2025 | $7.22 | |||
$24.92 | 7.61% | 7.50% | 7.61% | 3/23/2021 | $0.42 | ||||
$23.01 | FTF | 7.39% | 6.75% | 5.90% | 10/30/2024 | $8.32 | |||
$23.96 | FTF | 7.90% | 7.50% | 6.31% | 8/15/2024 | $7.61 | |||
$23.23 | FTF | 7.74% | 7.13% | 6.33% | 8/15/2024 | $8.01 | |||
$21.68 | FTF | 7.41% | 6.38% | 6.00% | 2/15/2025 | $9.71 | |||
$25.01 | FTF | 8.28% | 8.13% | 6.14% | 3/15/2024 | $6.59 | |||
$24.99 | FTF | 8.16% | 8.00% | 6.30% | 6/15/2024 | $7.01 | |||
$24.75 | Bond | 6.82% | 6.75% | 6.82% | 3/23/2021 | $0.28 | |||
$25.20 | Bond | 6.62% | 6.63% | 6.62% | 3/23/2021 | $0.02 | |||
$25.00 | 8.13% | 8.00% | 8.13% | 10/30/2021 | $1.59 | ||||
$23.62 | FTF | 8.61% | 8.00% | 6.44% | 3/30/2024 | $7.80 | |||
$23.00 | FTF | 8.57% | 7.75% | 5.45% | 9/30/2025 | $11.13 | |||
$23.01 | FTF | 8.85% | 8.00% | 6.16% | 3/30/2024 | $8.41 | |||
$25.31 | FTF | 8.11% | 8.13% | 5.83% | 4/27/2027 | $12.38 |
Second batch:
Ticker | Price | BoF | S-Yield | Coupon | FYoP | NCD | WCC | QO Link | P-Link |
$24.75 | FTF | 7.78% | 7.63% | 5.65% | 07/27/2027 | $12.63 | |||
$23.60 | FTF | 7.75% | 7.25% | 5.56% | 01/27/2025 | $8.65 | |||
$25.30 | 7.75% | 7.75% | 7.75% | 03/15/2021 | $0.00 | ||||
$25.29 | 7.50% | 7.50% | 7.50% | 3/15/2021 | $0.00 | ||||
$25.38 | 8.18% | 8.20% | 8.18% | 8/17/2022 | $2.79 | ||||
$24.80 | FTF | 8.43% | 8.25% | 5.94% | 4/15/2024 | $6.82 | |||
$24.49 | 8.01% | 7.75% | 8.01% | 3/23/2021 | $0.83 | ||||
$24.00 | FTF | 8.23% | 7.75% | 5.70% | 12/27/2024 | $8.77 | |||
$24.40 | FTF | 7.82% | 7.50% | 5.71% | 9/27/2027 | $13.27 | |||
$23.86 | FTF | 8.36% | 7.88% | 7.02% | 1/15/2025 | $9.01 | |||
$24.05 | FTF | 8.43% | 8.00% | 6.20% | 10/15/2027 | $14.45 | |||
$24.18 | 8.25% | 7.88% | 8.25% | 3/23/2021 | $1.18 | ||||
$24.10 | 8.14% | 7.75% | 8.14% | 3/23/2021 | $1.25 | ||||
$24.30 | 7.86% | 7.50% | 7.86% | 3/23/2021 | $1.12 | ||||
$21.90 | FTF | 7.55% | 6.50% | 6.43% | 3/31/2025 | $10.00 | |||
$22.20 | 7.88% | 7.00% | 7.88% | 5/12/2022 | $4.77 | ||||
$21.94 | FTF | 9.40% | 8.25% | 6.67% | 3/30/2024 | $9.27 | |||
$24.75 | 8.33% | 8.25% | 8.33% | 3/23/2021 | $0.25 | ||||
$24.41 | 8.19% | 8.00% | 8.19% | 3/23/2021 | $0.59 | ||||
$22.51 | FTF | 8.88% | 8.00% | 7.40% | 9/17/2024 | $9.47 | |||
$24.28 | FTF - Floor | 9.00% | 8.63% | 9.00% | 7/30/2024 | $8.26 |
There are a few things you should know at the start:
- When a share can be called on short notice, the annualized yield-to-call reaches absurd levels. Investors shouldn’t put too much weight on it. On the other hand, a negative number can be a significant concern. Consequently, we decided to include it in the chart.
- We sort our spreadsheet for subscribers by risk ratings within each sector. We decided to use the same technique for this series since it communicates more information to readers. You’ll notice a general correlation where lower risk correlates with a higher price and lower yield, though this link isn’t absolute.
- Worst Cash to Call example: Imagine a preferred share that could be called in a few months and would pay out a total of $.75 in dividends by that time. If an investment in those shares ends in a call, the smallest amount of cash inflows possible would be $25.00 (call value) plus $.75 (total dividends). If the share price was $25.60, then the “Worst Cash to Call” would be $.15. That comes from the following equation: $25.00 + $.75 - $25.60 = $.15. If the share price increased by $.20 in the next hour, the “Worst Cash to Call” would decline to negative $.05.
Strategy
Our goal is to maximize total returns. We achieve those most effectively by including “trading” strategies. We regularly trade positions in the mortgage REIT common shares and BDCs because:
- Prices are inefficient.
- Long term, share prices generally revolve around book value.
- Short term, price-to-book ratios can deviate materially.
- Book value isn’t the only step in analysis, but is the cornerstone.
We also allocate to preferred shares and equity REITs. We encourage buy-and-hold investors to consider using more preferred shares and equity REITs.
Performance
We compare our performance against four ETFs that investors might use for exposure to our sectors:
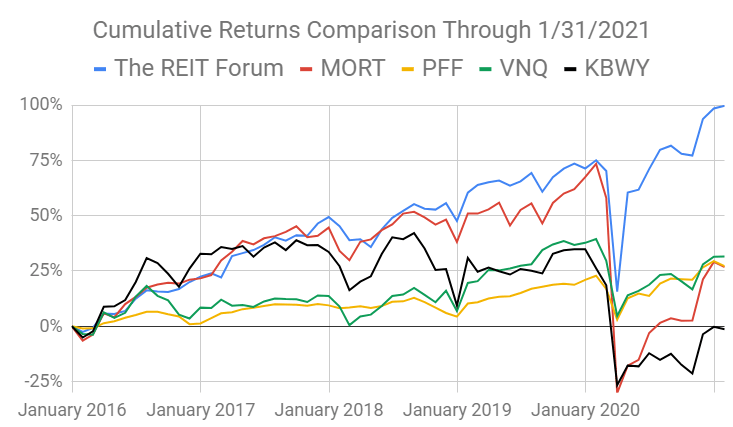
Source: The REIT Forum
The four ETFs we use for comparison are:
Ticker | Exposure |
One of the largest mortgage REIT ETFs | |
One of the largest preferred share ETFs | |
Largest equity REIT ETF | |
The high-yield equity REIT ETF. Yes, it has been dreadful. |
When investors think it isn’t possible to earn solid returns in preferred shares or mortgage REITs, we politely disagree. The sector has plenty of opportunities, but investors still need to be wary of the risks. We can’t simply reach for yield and hope for the best. When it comes to common shares, we need to be even more vigilant to protect our principal by regularly watching prices and updating estimates for book value and price targets.
Conclusion
You don’t have to follow us. You don’t have to care about our research. If you’re happy with a high dividend yield and a dwindling account value, there are plenty of authors who can cater to you. On the other hand, if you’re focused on generating total returns and want to use REITs to do it, you may love our research. Hit the “Follow” button beside my name to start seeing more of our research.
Make sure to leave a comment and let us know what you think of the layout.
Ratings:
- Bullish on NLY and NRZ.
- What about CMO? If I was publishing this article prior to Thursday's dip, we’d have a rating to update. Shares broke over $6.00 briefly Thursday morning before the dip began.
Want the best research? It’s time to raise your game. Get access to several features you won’t find on the public side.
You can get access to everything we have to offer right now. Try our service and decide for yourself.