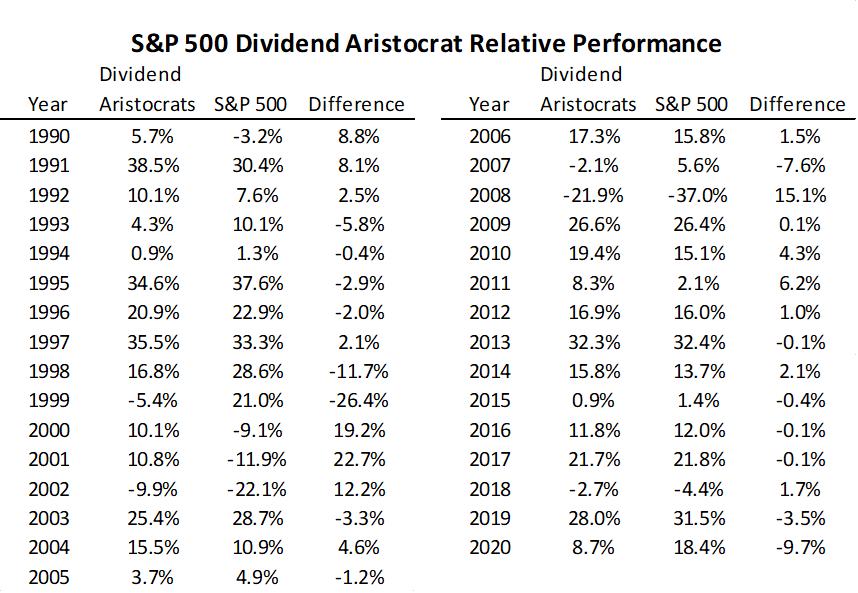
Over the past three-plus decades, the Dividend Aristocrats (BATS:NOBL) have outperformed the broader S&P 500 (SPY) from which they are drawn by 1.68% per year. The strategy has outperformed in the past six down years for the broad market - 2018, 2008, 2000-2002, 1991. In 2020, the dividend growth strategy returned 8.7%, meaningfully lagging the 18.4% for the S&P 500. That was the worst relative return for the strategy since 1998 and 1999 when Tech drove the capitalization-weighted market index towards its bubble heights, leaving dividend growth stocks behind.
The table below shows the key driver of the underperformance of the Dividend Aristocrats in 2020. Like the 1998-1999 episode, the driver of the performance differential in 2020 was the tech weighting. The dividend growth strategy was meaningfully underweight Tech, and did not have exposure to high-flying Amazon (AMZN), the largest Consumer Discretionary company in the S&P 500 Index. Away from tech and Amazon, the average Dividend Aristocrat stock did better (8.7% vs. 5.1%) than the average non-tech, non-Amazon S&P 500 constituent. Unfortunately for dividend growth investors, this outperformance was overwhelmed by the underweight to high-flying tech.
With the Dividend Aristocrats lagging the tech-fueled gains of the broad market, there could be relative opportunities as we look forward into 2021. A cooling of the tech-fueled gains could lead to relative outperformance of dividend growth stocks. While the dividend growth strategy only outperformed by 5bp in February, its underweight to Tech contributed positively to performance (+44bp). Similarly the exclusion of Tesla (TSLA) +19bp, and exclusion of Amazon (AMZN) +14bp in the dividend growth index boosted performance as these recent megacap market leaders lagged on the month.
In the table below, the list of the current Dividend Aristocrat constituents is sorted descending by indicated dividend yield, and lists total returns, including reinvested dividends, over trailing 1-, 3-, 6-, and 12-month periods.
Here are a couple of notable observations from this list and the broader performance trends in February:
- While the Dividend Aristocrats slightly outperformed in February, they tend to lag when interest rates are moving higher. The 10-year Treasury yield climbed 35bp on the month. While the Dividend Aristocrats have generated higher long-run performance (+1.68% per annum), they have tended to lag in months when rates were up this much or more (equivalent of -1.77% annualized).
- The best performing stock on the month was People's United (PBCT), which is being acquired by M&T Bank (MTB) to create a northeastern/mid-Atlantic super-regional.
- The worst performing stock on the month was Clorox (CLX) - another sign that market participants are flooding into recovery trades and leaving the early COVID-crisis winners behind. A full distribution of February returns for the Dividend Aristocrat constituents is below:
- Exxon Mobil (XOM) and Chevron (CVX) climbed 23.3% and 19% respectively. Boosted by rising oil and gas prices, Exxon is the second best performer over the past three months, slightly trailing only takeover target PBCT.
- I found it interesting to look at the far right column of the first table above. The 44 dividend payers with the lowest dividend yields all produced positive total returns over the past 12 months, a period that featured the COVID-related drawdown. Of course, lower dividend yields can be driven by rising share prices, so the fact that the list is split in this fashion does not imply causality.
- Zeroing in on the period from the March lows, and all of the Dividend Aristocrats have produced positive returns. Continental Edison (ED) is the laggard among the Dividend Aristocrats up just 5%. Atmos Energy (ATO), which faced stress this past month due to the need to purchase wholesale power during the Texas power crisis, is the second worst performer up 8%.
- From the February 19th, 2020 high for the market prior to the large drawdown, nearly one-third of the constituents have produced a negative total return, which may suggest that a recovery trade of these issuers is still possible versus the broad market index. Over this one year-plus period, the S&P 500 has returned over 14%.
I hope this information provides useful for Seeking Alpha readers looking at opportunities to enhance their dividend growth portfolios. The tech and Amazon underweights explained all of the relative underperformance versus the broad capitalization-weighted index in 2020. This single year underperformance for the strategy was largest since the tech run-up in 1998 and 1999. Three of the four best relative years for dividend growth stocks versus the broad market were to follow, which may be a notable precedent for investors today. In February 2021, the tech underweight inherent in the dividend growth strategy was a positive differentiator. If you believe that the tech-fueled multiple expansion of the cap-weighted index has the market stretched, there still may be relative opportunity in these dividend growers moving forward. Each of these dividend growers have traversed another stress period while increasing shareholder payouts, demonstrating the types of business models that can generate long-run returns over multiple business cycles.
Disclaimer: My articles may contain statements and projections that are forward-looking in nature, and therefore, inherently subject to numerous risks, uncertainties and assumptions. While my articles focus on generating long-term risk-adjusted returns, investment decisions necessarily involve the risk of loss of principal. Individual investor circumstances vary significantly, and information gleaned from my articles should be applied to your own unique investment situation, objectives, risk tolerance and investment horizon.