J. M. Smucker: Show Me Growth Or Give Me Buybacks

Passive Income Pursuit
4.33K Followers

Summary

  • J. M. Smucker Company is a Dividend Contender with 23 consecutive years of dividend growth. Shares currently yield 3.10%.
  • J. M. Smucker is a defensive consumer staple.
  • Analyzing J. M. Smucker through its cash flow and balance sheet and valuing the business through multiple angles.

JM Smucker Brands

Image source

J. M. Smucker (NYSE:SJM) is a well-known consumer staples business with several well-known brands outside of its namesake including JIF, Folgers, Meow Mix and many others. While the business has been steady, the share price has severely underperformed the S&P 500. Over the last five years, Smucker's share price is down 8.9% compared to the S&P 500's 88.0% rise. The stagnant share price while the business has continued to post modest results has led to an arguably cheap share price.

Dividend History

The dividend growth strategy is the one that appealed most to me when I began investing into individual companies. The concept is simple which is to focus on businesses that have a history of paying and growing their dividend payout as a means to harvest the fruit while keeping the tree.

JM Smucker Dividend History

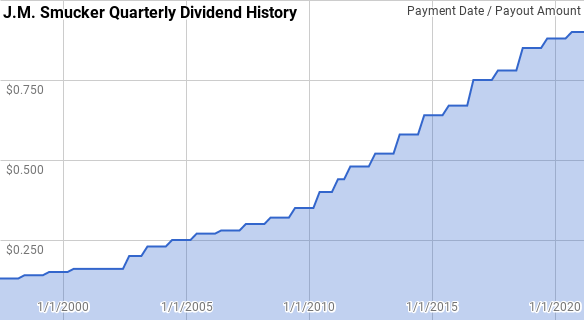
Image by author; data source J. M. Smucker Investor Relations

Smucker is a Dividend Contender with 23 consecutive years of dividend growth. Its consecutive year streak dates back to 1997 which is quite impressive considering the numerous economic environments that have occurred over that time.

During its streak, there have s been 23 year-over-year periods with annual dividend growth ranging from 1.6% to 41.0% with an average of 10.4% and a median of 8.2%.

There have been 19 rolling 5-year periods during Smucker's streak with annualized dividend growth ranging from 6.3% to 13.1% with an average of 9.8% and a median of 10.4%.

Over that same period, there have been 14 rolling 10-year periods with annualized dividend growth ranging from 8.6% to 11.7% with an average of 9.8% and a median of 9.6%.

The rolling 1-, 3-, 5- and 10-year annualized dividend growth rates since 1997 can be found in the following table.

Year Annual Dividend 1 Year DGR 3 Year DGR 5 Year DGR

This article was written by

4.33K Followers
I started a dividend growth investment strategy a few years ago and am aggressively growing my portfolio to churn out enough dividends to reach financial independence.

Analyst’s Disclosure:I am/we are long SJM. I wrote this article myself, and it expresses my own opinions. I am not receiving compensation for it (other than from Seeking Alpha). I have no business relationship with any company whose stock is mentioned in this article.

I am not a financial professional. Please consult an investment advisor and do your own due diligence prior to investing. Investing involves risks. All thoughts/ideas presented in this article are the opinions of the author and should not be taken as investment advice.

Seeking Alpha's Disclosure: Past performance is no guarantee of future results. No recommendation or advice is being given as to whether any investment is suitable for a particular investor. Any views or opinions expressed above may not reflect those of Seeking Alpha as a whole. Seeking Alpha is not a licensed securities dealer, broker or US investment adviser or investment bank. Our analysts are third party authors that include both professional investors and individual investors who may not be licensed or certified by any institute or regulatory body.

Recommended For You

About SJM Stock

SymbolLast Price% Chg
Market Cap
PE
Yield
Rev Growth (YoY)
Short Interest
Prev. Close
Compare to Peers

More on SJM

Related Stocks

SymbolLast Price% Chg
SJM
--