On March 9, the Nasdaq Composite finished the trading session 10.5% below the record it notched in February 12. While the 10 percent threshold for a correction may be arbitrary, it is symbolic in showing that investors have turned more pessimistic about the market and more of the tech stocks. And with a full economic reopening within reach, coupled with a surge in interest rates, investors are rotating out of high growth tech stocks and into value and cyclical stocks. On the timing and the magnitude of the rotation, Mike Wilson, Morgan Stanley's chief US equity strategist, had very specific predictions in a recent note:
"There will be a big shift in the top and bottom quintiles of 12-month price momentum by the end of this month (March). Most of the stocks going into the top quintile are value and cyclical stocks. Conversely, many of the stocks moving out of the top quintile are tech and other high-growth stocks.”
"Based on the technical damage to date, the Nasdaq 100 appears to have completed a head and shoulders top and should test its 200-day moving average," Wilson said. The 200-day moving average of the Nasdaq 100 currently sits at 11,635, representing potential downside of 10% from Friday's close (March 5).
At the eve of month-end, the Nasdaq 100 just closed at 13,138. Although Wilson’s predictions may not realize exactly the way he prescribed, his points are still well taken. In this post, I add more color on the timing and the magnitude of the rotation using a fundamental, bottom-up approach.
Due to the widespread chip shortage, the fading WFH ("Work From Home") demand and the underlying seasonality, the revenue growth for an average tech firm is estimated to drop by 12% in 1H 2021. As a result, the tech stocks may see an immediate 8% drop by Q1 and another 10% by Q2.
Reflation Trades?
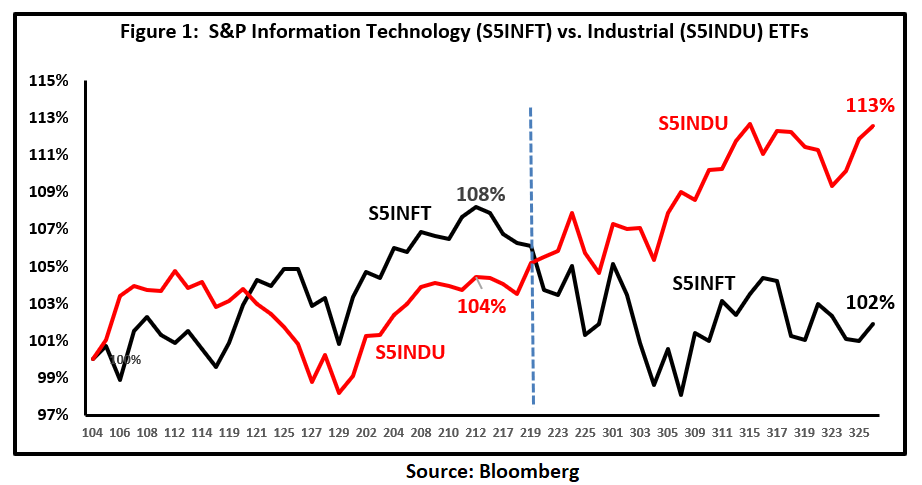
The relative stock performance between the tech sector and industrial sector has reflected the reflation trades that have been going on since late 2020. For the month of February, the S&P 500 Industrial Index (SSP500-200) ("INDU") has underperformed the S&P 500 Information Technology Index (SP500-45TR) ("INFT") by 4%. Yet, in March, INDU outperformed INFT by 11% (Figure 1). An obvious question is that "Is the Rotation Over?"
What Fundamentals Drive the Tech Sector?
Typically, it is more difficult to look at the technology sector because the fundamental data on the sector level is not readily available. The S&P 500 Information Technology Index is one of the exceptions that stock-like fundamental sector data is aggregated from the 76 constituency tech stocks. Based on the data on Bloomberg, I was able to evaluate the fundamentals of the tech sector proxy, INFT, like a typical tech stock.
The first step is to identify the financial metrics which have driven the sector index price movements. On this account, I borrowed the prior experience that a typical tech stock is affected by the expected revenue, earnings per share/gross margin, free cash flow/dividend, and capital expenditure. To verify that the relevance on the stock level can apply to the sector level, I present the relationship between the INFT share prices and the financial metrics (Figures 2A, 2B, 2C).
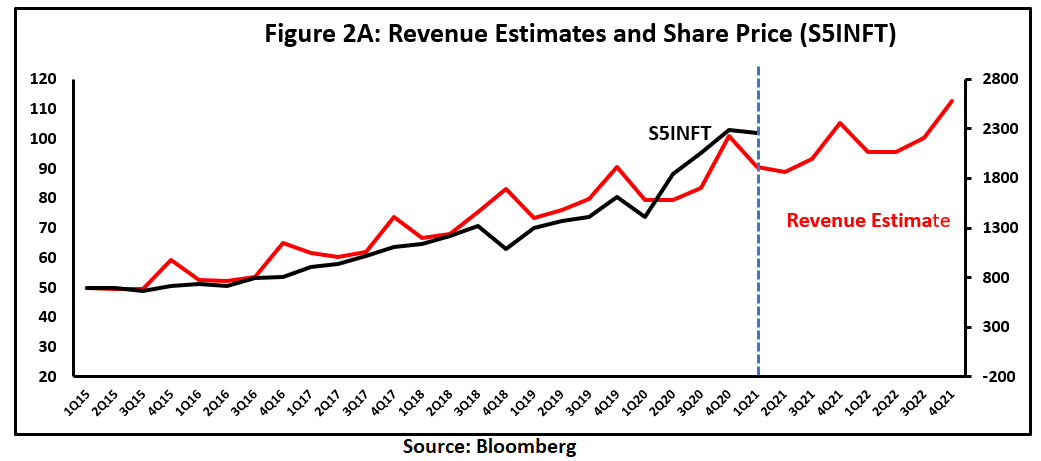
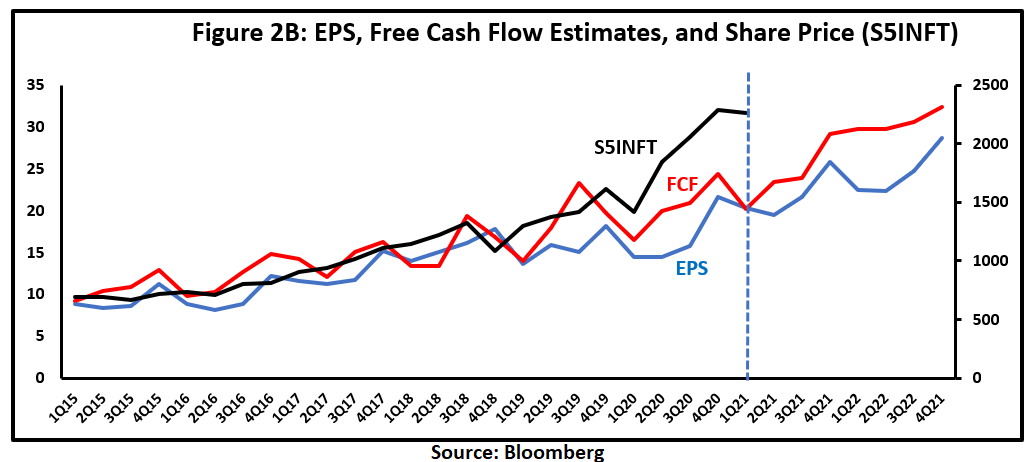
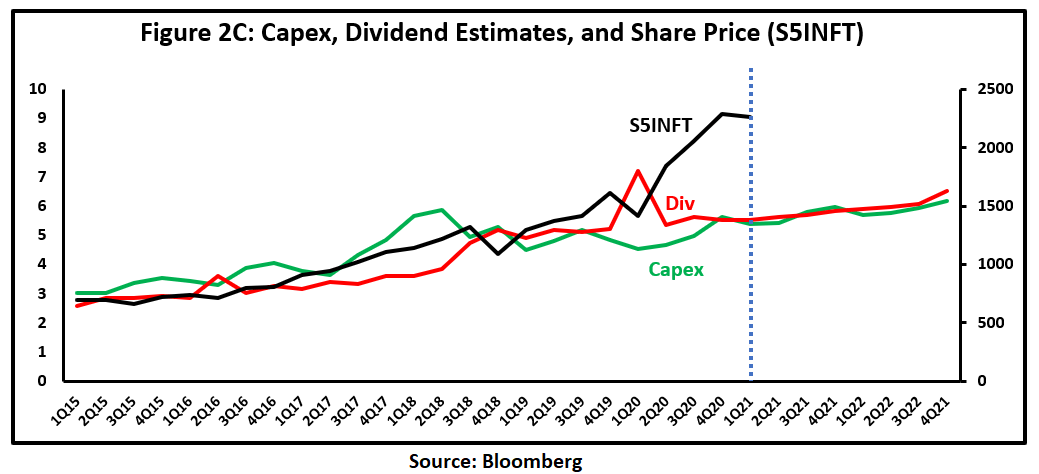
At the first look, INFT prices generally correlate well with each financial metric. Statistically, INFT prices track more closely with revenue and EPS estimates. The close relationship somewhat validates the use of future financial metrics to estimate future price moves.
More importantly, it is clear that the current INFT price is trading “higher” off the regular historical relationship of the relevant financial metrics. The similar pattern across all 5 financial metric factors suggests that INFT may overvalue the underlying fundamentals.
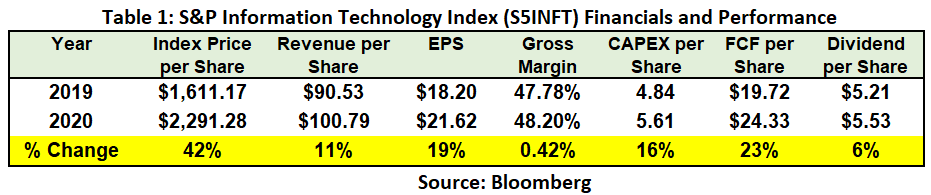
Another clue to indicate the same conclusion is the obvious “delink” between the share price changes and the corresponding changes in fundamentals. For the year 2020, as a result of the WFH demand, INFT's price has increased by 42%. But it was significantly higher than the fundamentals changes during the same time period, e.g., revenue 11%, EPS 19%, free cash flow 23% (Table 1). The large positive discrepancy between INFT share price changes and INFT fundamentals changes implies the possibility of mispricing. INFT at today’s $2318 may be overvalued currently and a further correction maybe forthcoming.
From Tech Sector Financials to Tech Sector Prices
To be more specific, I estimated the “model” INFT prices which correspond to the relevant financial metrics at the time. To get there, I first estimated a historical relationship between the historical stock prices and these financial metrics using the standard regression method. Then, the current forecast of these financial metrics at different time points are plugged into this relationship to generate the corresponding stock prices.
Keep in mind that although I used historical data to estimate a historical relationship, it is still a forward-looking process. This is because, at any point in time in history, INFT's share price is estimated by the forward estimates of the five financial metrics at that time. The only assumption I made is that investors used the same (forward-looking) valuation structure to price tech stocks consistently. To account for the rising yield effect and high valuation effect, I included two additional factors for (1) expected 10-year Treasury yield up moves (from futures contracts) and (2) the current mispricing from the street target price.
Tech Stocks May Have An 8% Immediate Downside
In Figure 3 and Table 2, I showed the corresponding “model prices” in red and the actual INFT price in black. If you can go along with my approach, Figure 3 becomes quite telling. First, up until today (blue dotted line), the model prices seem to map the actual INFT price quite closely. The tight relationship implicitly validates the power of the model.
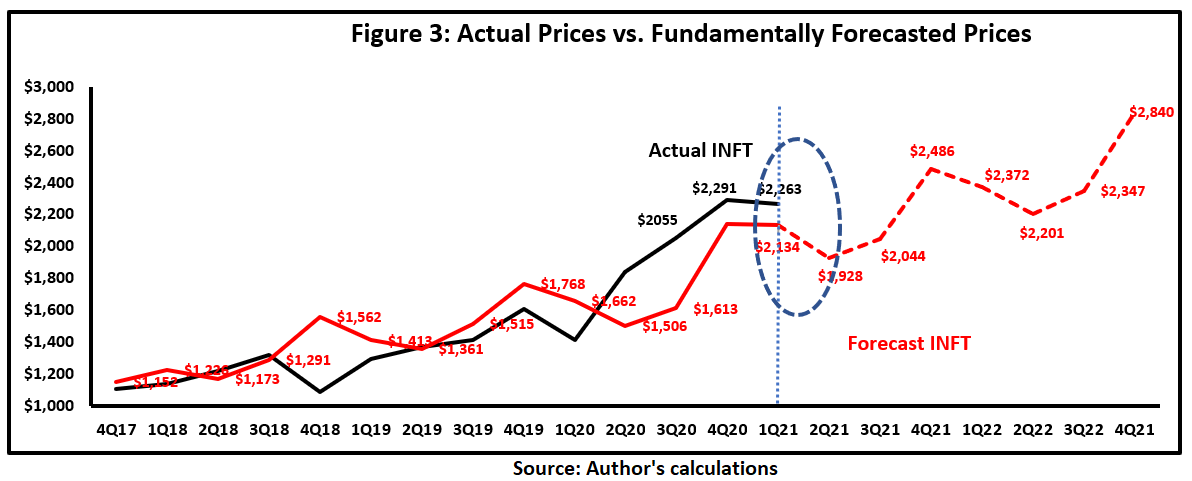
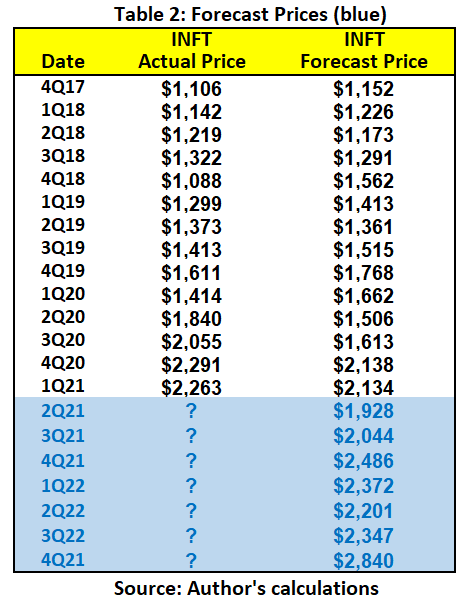
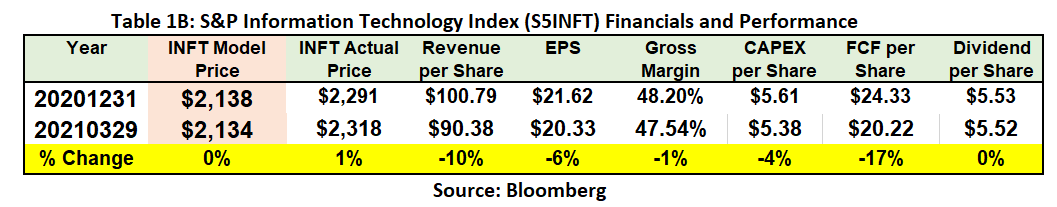
Second, if the power of the model is assured, the current model prediction suggests that INFT should be at $2134 which is 8% lower than the actual price at $2318 (Table 1B & Table 2). As a result, this suggests a similar conclusion that the current tech sector has not dropped fully to the fundamentally supported price level.
The reasons for the model price drop as outlined in Table 1B warrant more explanation. For one, most tech sector fundamentals have deteriorated from Q4 2020. The expected sector Q1 revenue growth is estimated to be down -10% with EPS down -6%. Other metrics also show a marked decrease. The muted financial forecast may be a result of the supply shortage currently hurting the entire semiconductor supply chain.
Virtually, all tech firms’ revenue growth and margins are inevitably constrained by the shortage at least for Q1 2021. Further, the fact that the market has been in reflation trades suggests that the WFH macro is fading due to the economic recovery. Tech fundamentals which benefitted from the WFH macro start to reverse themselves.
Another 10% Retracement May Follow
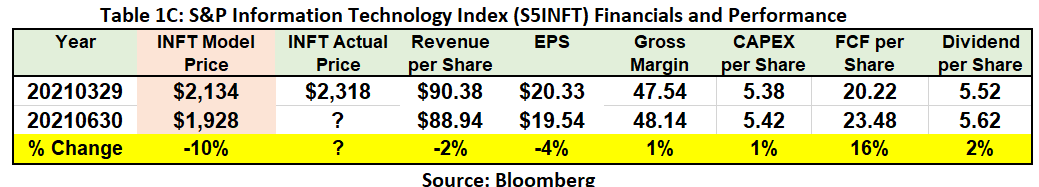
Finally, based on the current estimates of the future financials, the model proceeds to predict that the tech sector will go lower to $1928 by Q2, before it finally rebounds to $2486 around Q4 (Table 2). In other words, there could be another 10% downside by Q2 2021 before INFT will rebound (Table 1C). The 10% further tech loss in Q2 is supported by the forecasts of both revenue and EPS declines in Q2 (-2% and -4%).
Though, cautions should be made about using this "linear thinking" approach. Admittedly, the validity of this approach rests on the assumption that investors will consistently price the tech stocks as rational as usual. And this may be the one thing the market will not do, per recent history.
Takeaways
Tech stocks, which briefly bounced off the -10% territory, gave the market the illusion that the tech sector valuation has been corrected. Using the S&P 500 Information Technology Index as a proxy for the tech sector, the sector fundamentals suggest that tech stocks may have an immediate 8% downside in order to fully correct to Q1 fundamentals.
Looking ahead, the Q2 forecast fundamentals also predict that tech stocks need to drop another 10%. It is important to recognize that the first -8% is the correction for mispricing which should happen fairly soon. The second -10%, resulting from the realization of declining financials, should be completed by Q2.