When we begin an investment, we begin with a thesis. We have a clear reason to believe that the particular security we’ve chosen will deliver healthy returns to us in the future. We're not successful 100% of the time, but (so far) we have a very high percentage of our trades delivering positive returns. When we eat a loss, it might be small or it might be significant. The decision to eat a loss is based on a change in our expectations.
In this article, we're going to walk investors through the process that enabled us to beat the indexes for our sectors:
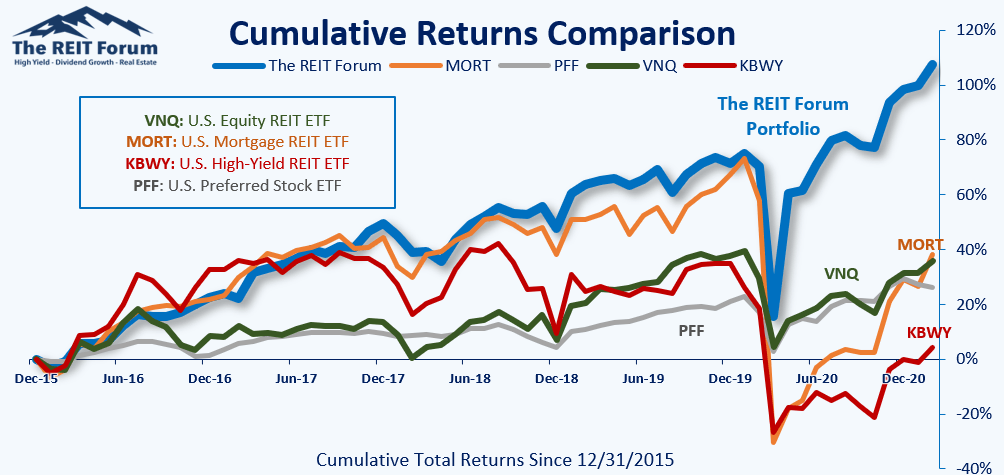
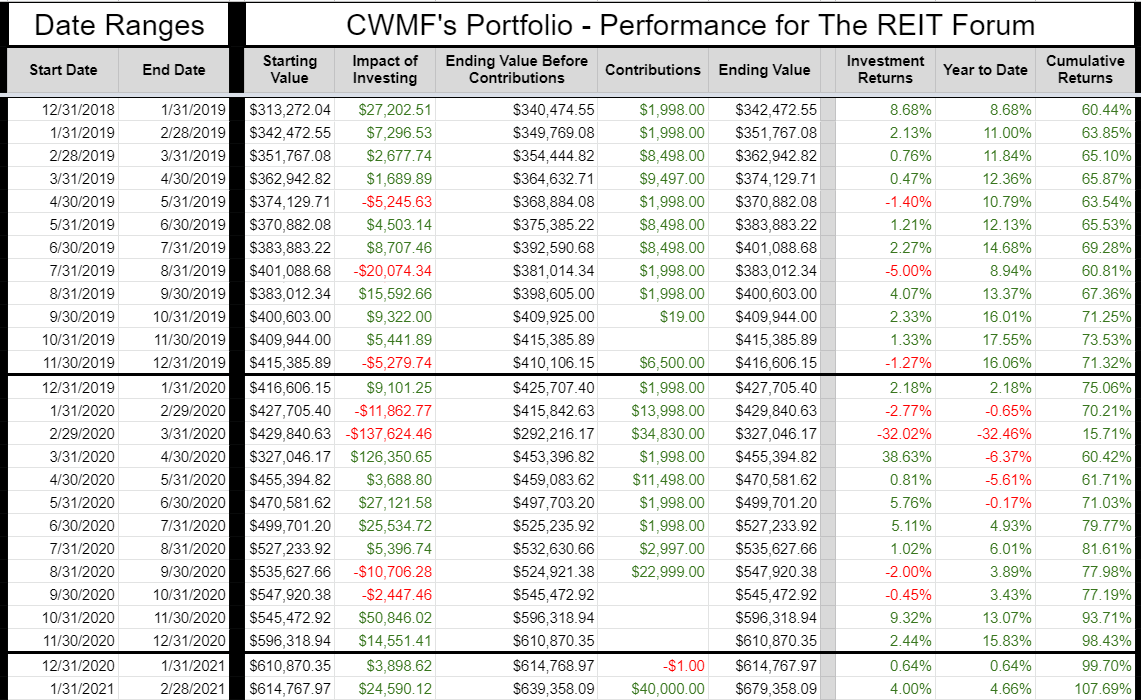
Source: The REIT Forum
The Mindset
We approach investments with a consideration of the potential rewards and the risks. That may seem obvious, but many “analysts” will significantly downplay the risks to give the appearance of a “great pick.” Often investors will find that another analyst can find more buy ratings than we can, even if they cover the same stocks. Why is that? In my experience, the other analyst is often less cautious about setting price targets to maximize future returns. We spend an enormous amount of time thinking about risk. When deciding to recommend a position, the majority of my research is attempting to disprove my own thesis.
Questions Before Investing
The worst question:
- How could this stock be a great investment?
Some great questions:
- How could this stock wreck my portfolio and my reputation?
- What scenario could cause this to be a poor investment?
- How can I see if that scenario is occurring?
- What time frame am I attempting to predict? Less than six months? More than four years?
You may notice that this is a very pessimistic mindset. We don’t approach stocks with the mindset of a salesman looking for a deal. We approach stocks with the mindset of a security guard. Our goal is to protect the portfolio so it can continue to grow over time. If we’re not confident, we don’t want to risk a bad recommendation. However, we don’t want to buy into a general panic in the market either. When we see panic, we need to be ready to act.
Long-Term Positions and Trading Positions
When we approach positions, we generally look at them as either trading positions or long-term positions. There are a few (generally preferred shares) where we decide that either is perfectly viable. As a quick guide:
My positions in the common shares of mortgage REITs and BDCs will be intended for trading. I will focus primarily on the price-to-buy ratio using Scott’s latest targets. I may cut a position because the price ceases to be attractive or because there is a similar stock in the sector offering a better risk/reward profile.
My positions in the equity REITs will usually be intended for a buy-and-hold strategy. They are closed out far less frequently.
Contrasting with Mortgage REITs and Equity REITs
Since we don’t intend to close equity REIT positions often, we don’t need to review them as frequently. We are focused on finding opportunities to put new capital to work. So why do we use more of a buy-and-hold approach for equity REITs?
Valuations on the equity REIT common shares cannot be nailed down as precisely as we see Scott nailing down the mREIT and BDC common shares. It simply can’t be done, and the current accounting laws complicate the analysis rather than simplifying it. While many investors find mortgage REITs confusing, there's clarity within the statements that can be used to nail down targets with greater precision. It requires an enormous amount of accounting expertise, but it can be done. Is it any wonder our mortgage REIT expert is so experienced with accounting?
Why are equity REITs so different? Three major reasons:
- Equity REIT NAV estimates have a much larger margin for error.
- Equity REIT NAV values are less useful because the underlying portfolio of real estate is less liquid.
- Even if the equity REIT’s portfolio of real estate was liquid, the market for real estate is less efficient than the bond market.
Because of these differences, we don’t believe it's possible to trade equity REITs actively with the precision and success we’ve enjoyed in mortgage REITs. That doesn’t make equity REITs a poor investment. On the contrary, they have provided a substantial amount of wealth to shareholders over long time periods. Further, I believe it's easier to make long-term projections for equity REITs than it is for mortgage REITs. The following bullet points break down this concept:
- Mortgage REITs: Short-term we can be confident on precise estimates. Long-term projections are not realistic.
- Equity REITs: Short-term estimates are significantly less precise. Long-term projections can be realistic.
Want a comparison? There are six apartment REITs we currently cover. There were previously seven, but one split the company into two parts. The total returns for that REIT are comparable with the six we still track, but they don’t show up as well in the chart. The following chart shows the total return (including dividends) for the last three years:
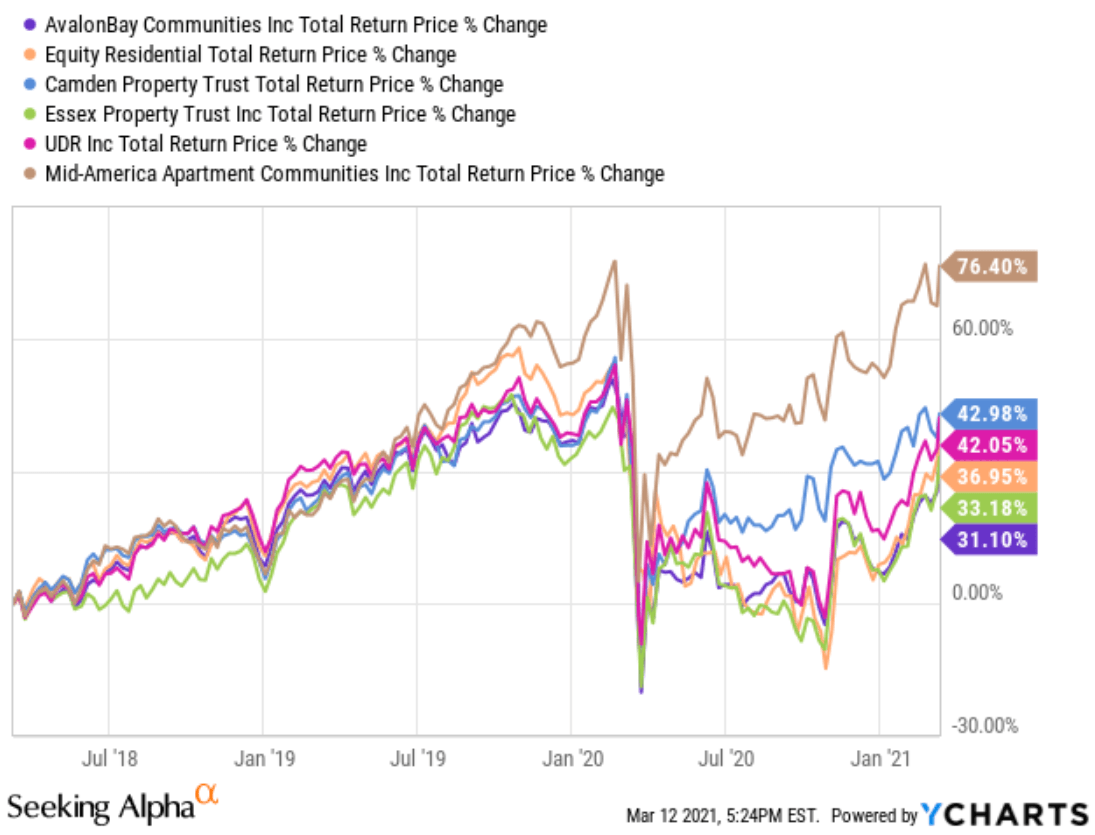
The best performance went to Mid-America Apartment Communities (MAA), primarily because their exposure to more rural markets outperformed in the pandemic. However, the range of performance runs from 76% to 31%. Despite a pandemic, the REITs recovered and are generally at least even with the pricing they had in the middle of July 2019. Investors who didn’t predict a pandemic (that’s most of them) were still fine if they simply held positions.
For contrast, we pulled the mortgage REIT performance for several of the mortgage REITs which had credit exposure prior to the pandemic. Some of these mortgage REITs changed their strategy during 2020, which is an additional factor that couldn’t be predicted years ago:
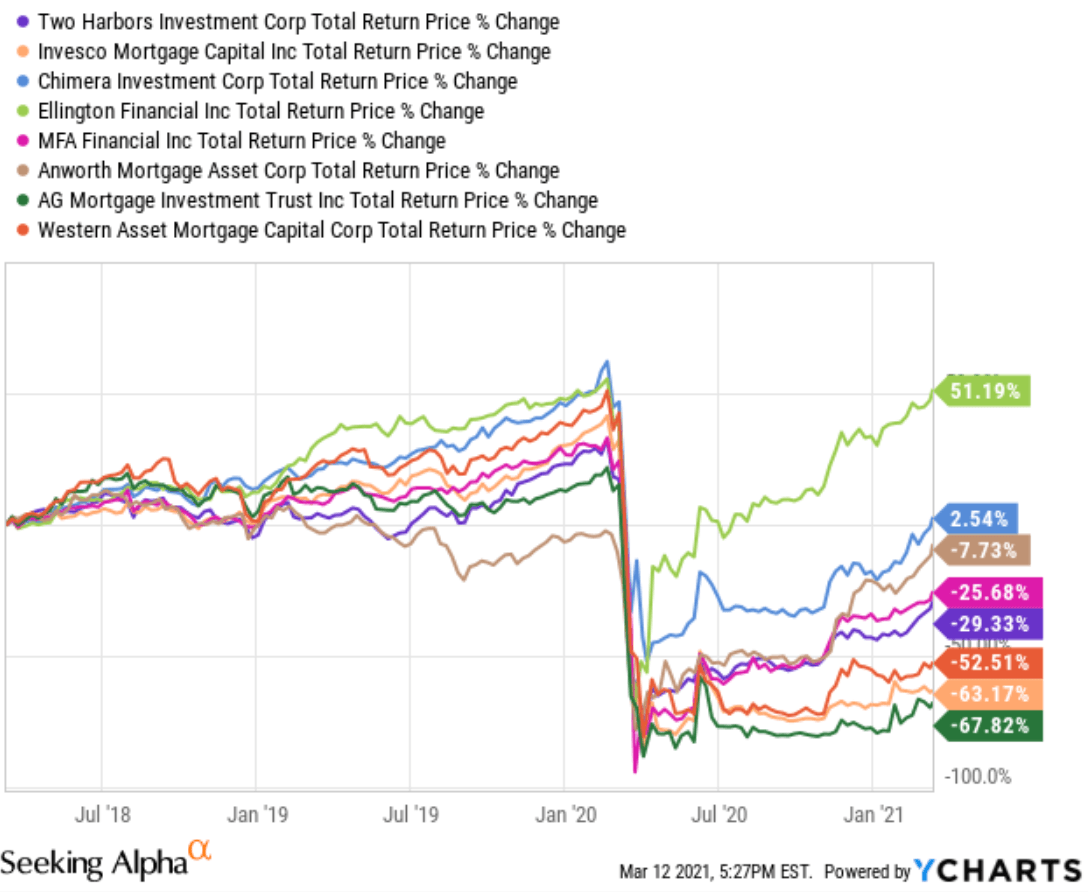
Returns ranged from positive 51% to negative 68%. Investors in early 2018 could not remotely predict where shares would be in three years. Long-term predictions here are not viable because a long-term prediction would rely on predicting the future changes in the value of a leveraged portfolio of option-embedded bonds. Investors can’t do that. Analysts can’t do it. Most mortgage REIT executives obviously cannot do it (as evidenced by the dramatic losses in several names).
Note: A few mortgage REIT executives did an outstanding job of navigating the crisis. Perhaps it isn’t surprising that there is a huge overlap between the lower risk ratings and the mortgage REITs which succeeded in the pandemic.
The lesson we’re pounding home here is simple:
We need highly accurate short-term predictions for mortgage REITs. We have them. They are incredibly valuable for trading.
We need a long-term vision for equity REITs. We aren’t trying to predict three-month performance, we want years of performance.
Performance on Common Shares
At the REIT Forum, we put a huge emphasis on performance. We expect one of the main reasons for investors to choose our service is because we’ve consistently performed better than our competition. There are several ways to measure performance. Our preferred method is simply measuring the total returns on the portfolio as a result of our investing. However, we can also break it down by looking at the gains and losses for a sector. The following chart demonstrates the total values for all trades based on whether the returns were positive or negative:
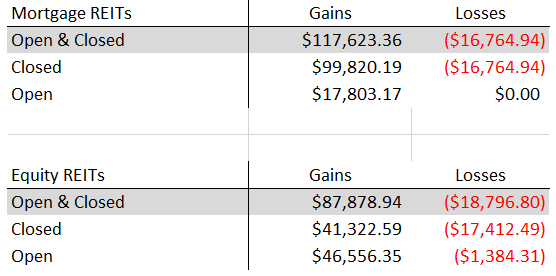
Source: The REIT Forum
Note: Dividend income is lumped in with the change in share price to determine the total gain or loss for a position.
Note 2: We use the actual dividend amount, rather than plugging in the yield and adding that to performance. That's the only acceptable way to do it.
Note 3: We’ve lumped BDCs in with mortgage REITs since we have so few of them.
We would caution investors that this technique isn’t perfect because it can lead investors to think that a trade that repositions the portfolio for better returns is a bad choice simply because it locks in “a loss” to free up cash for a better investment. However, it may give investors more context for thinking about the strategy. You can see at a glance that our ratio of wins to losses is quite strong.
If you only looked at the closed positions in equity REITs, the ratio would only be $2.37 in gains per $1.00 in losses. However, the open positions drive the performance substantially higher. The thing which might surprise investors is seeing that across all positions our ratio of gains to losses was actually higher on the mortgage REITs than on the equity REITs. Let’s take a moment and dive into the losses. We aren’t trying to fixate on the “negatives,” but we learn more from losses than wins.
What Were the Trades?
Before posting the charts, I need to highlight that this piece was prepared for subscribers in the middle of March. Due to changes in share prices, the numbers for our open positions will be slightly different. However, different doesn't mean worse. Prices generally rose slightly, so today's values should be slightly higher. The charts we are about to post only reference common share positions. They do not include preferred share positions.
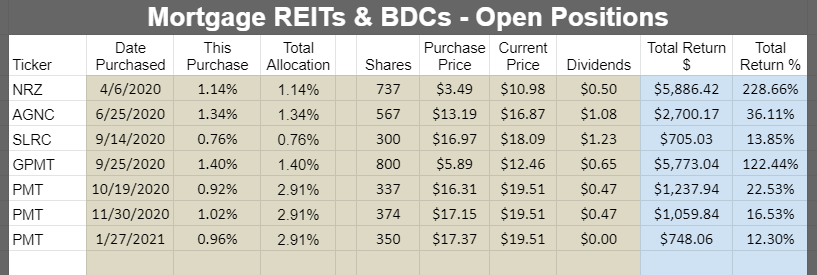
Here are the open positions:
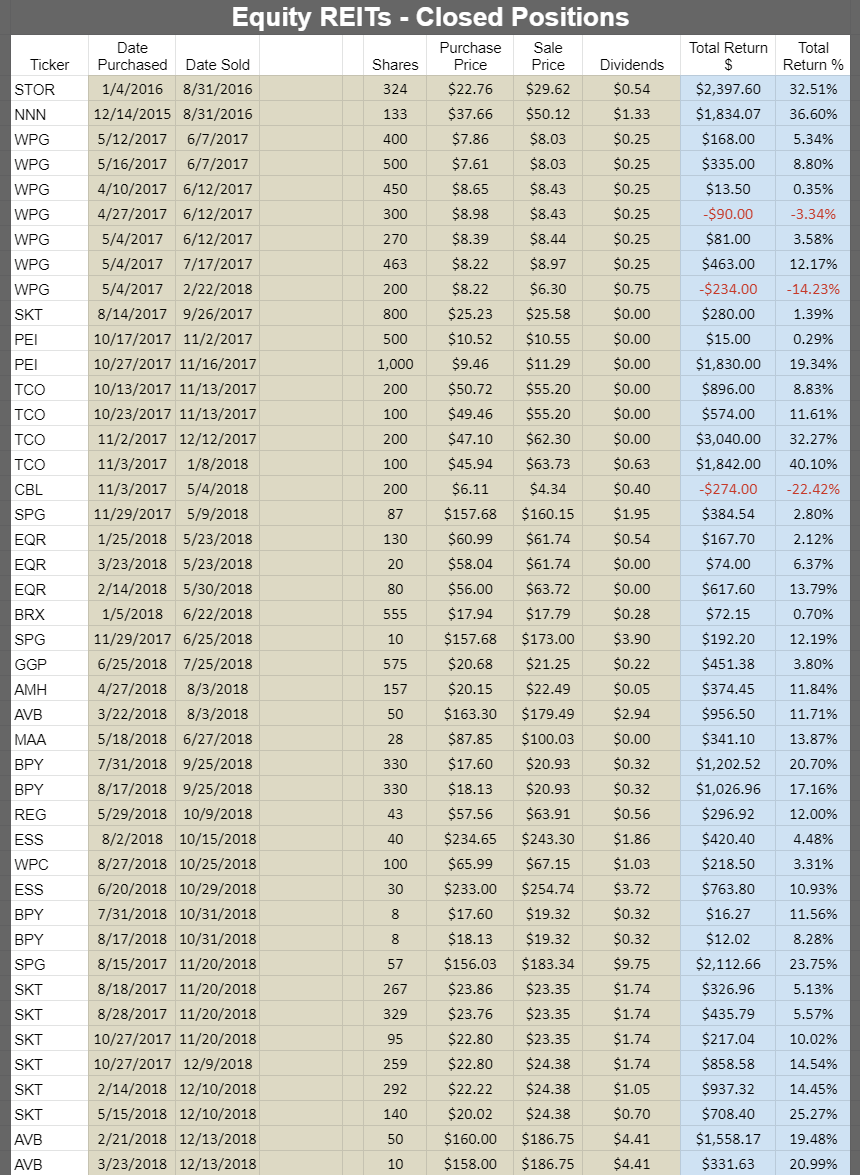
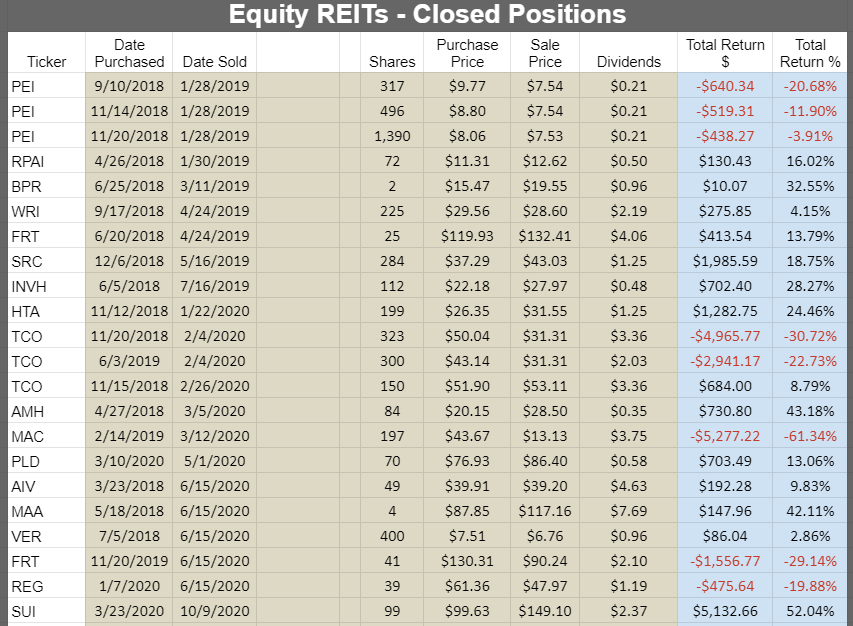
Here are the closed positions:
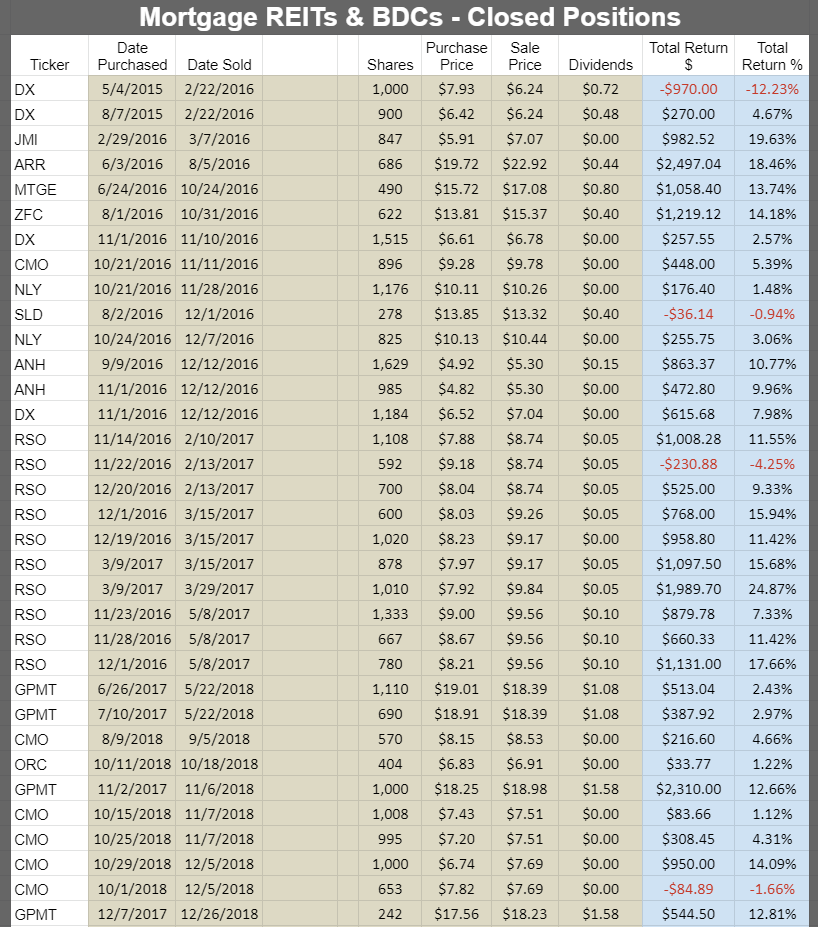
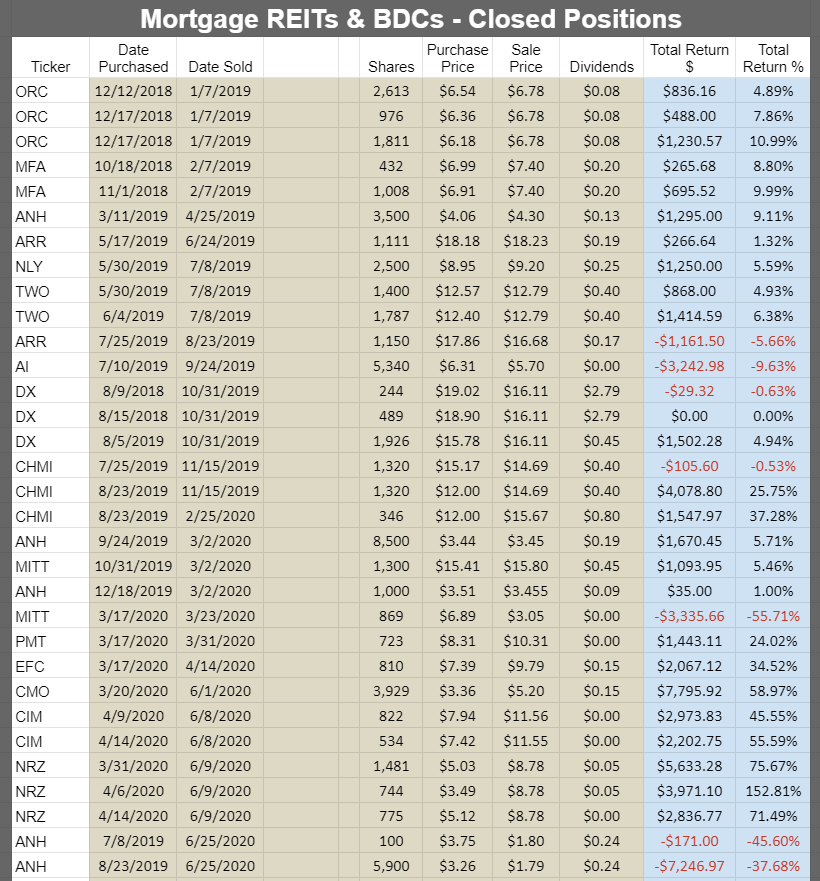

Source: The REIT Forum
Doubling Down
Before we get into the meat of the article, we need to highlight that we will discuss “doubling down.” When we double down, we record two positions in the stock. If we bought shares at $10 and shares at $5, there are two investments in the stock. If we sell all the shares at $9, we have a loss of $1 and a gain of $4. The net impact is $3, but we still record the gain and the loss. That makes a strong ratio of gains to losses much harder. Most analysts would simply set the weighted average cost at $7.50 and say the gain was $1.50 per share, for a total gain of $3.
Mortgage REIT Questions For Open Positions
Our mortgage REIT positions are reviewed frequently. There are a few questions in my mind:
1. Do my positions align with shares Scott recommends buying at today’s price?
2. Am I comfortable with my current risk exposure? Do I want more or less? This is a reason we are more likely to be invested in the lower-risk shares.
3. How does the valuation of this mortgage REIT look in a historical context? This question is generally already reflected in Scott’s targets.
Why are we monitoring these positions so carefully? The mortgage REIT sector hasn’t delivered exceptional returns if we look at the performance of the ETFs for several years. While it looks great “since early April 2020,” the losses from March 2020 could take years to recover. Despite that, we’ve delivered exceptional returns because we’re watching the positions carefully and using Scott’s targets.
The Negative Trades - Mortgage REITs
We have a grand total of $16,794.94 in losses across our mortgage REIT trades. As investors know, the mortgage REIT sector performed very poorly during March 2020.
What percentage of the losses come from that period? 64%.
Out of $16,794.94 in losses, $10,753.63 occurred in trades that were held during the middle of March. Specifically, they are tied to investments in AG Mortgage Investment Trust (MITT) and Anworth (ANH). We had other successful trades in those shares as well, but those were the two that accounted for nearly 2/3rds of our losses.
To understand our decision to eat those losses, it would help if investors had the context.
We lost $7,246.97 in ANH. We sold the shares on 6/25/2020 to reduce risk by swapping from ANH to AGNC Investment Corp. (AGNC). That position in AGNC is still open and has an unrealized total return of $2,473.37. That isn’t enough to offset the loss, but it does help.
We could’ve lost more in ANH, but on 3/2/2020 (as the pandemic was just starting to come to light), we dumped the majority of our investment in ANH to lock in a gain of $1,670.45. Consequently, we went through the pandemic continuing to hold 6,000 shares of ANH, rather than the 14,500 shares we owned in late February. In that early March trade, we also dumped shares of MITT collecting a 5.46% gain. We used the cash to purchase shares in STORE Capital (STOR) and Americold (COLD), both of which suffered in the pandemic but have since recovered to deliver positive returns (dividends plus unrealized gains) of 20% on COLD and 7% on STOR. For insight into our thinking at the time, see our real-time alert for STOR, COLD, MITT, and ANH.
While we got out of MITT in early March with a nice profit, we went back in a few weeks later. This re-entry on MITT looks a bit ugly at first glance. In about one week we saw the position fall by 55.7%. That’s pretty ugly. However, we saw an opportunity in swapping from the common shares to the preferred shares.
We dumped shares of MITT with a loss of $3,335.66 and salvaged $2,650.45.
We promptly spent that $2,650.45 on buying shares of MITT-B (MITT.PB).
We sold the shares of MITT-B less than three weeks later for a gain of $5,381.09. That gain was more than twice the amount we lost in MITT. However, if we simply sort out the trades by winners and losses, it would be a “loss” on MITT and a “win” on MITT-B. Since MITT-B is a preferred share, rather than a common share, the gain of $5,381.09 is not included in our gains for the sector.
We discussed our reasoning in real-time inside our MITT for MITT-B real-time alert.
Note: While we had losses on those positions, we were buying aggressively in late March/early April and ended up with several huge gains. However, this section isn't about the gains.
When to Double Down on Mortgage REITs
A large part of our success comes from being willing to double down or significantly increase positions when prices are irrational. Scott’s research is incredibly useful here because it provides us with the guideposts to use in evaluating potential trades. We need to be able to assess whether a change in price is intelligently incorporating the latest projections for the underlying portfolio. Often, the market is being unreasonable, and we see some solid opportunities. If prices fall and we believe the portfolio wasn’t hurt, we may look to raise positions. However, this strategy requires having some cash on hand so we also look to harvest profits so we can be ready for the next opportunity. It's important for investors to understand that we are taking on significant risk and that navigating this sector successfully requires having excellent (and timely) analysis. Investors following this strategy need to be comfortable with the risks as we do occasionally eat a significant loss.
Prior to doubling down, we check the performance of our existing position. If the position is down 5% to 10%, we will evaluate if the outlook changed. If not, we will be thinking about whether we want to raise the position. If the price-to-buy target hasn’t changed, then the discount to that value will be larger and we’re more likely to raise the position. However, before placing these trades we like to check for sector momentum. If the whole sector dipped, we need to evaluate if we want to increase that particular position or if we would be better served by purchasing another similar REIT which may be even more attractive. We're more likely to raise our position if our particular pick has underperformed the sector without a material negative change in the target.
When to Sell Mortgage REITs
We try to make this easy. Here’s a quick checklist of things to do:
- Check in on Scott’s articles. You’ll see a graphic showing you the changes in ratings and the target values.
- Check the Google Sheets to see prices/ratings update in real-time (sometimes a 15-minute delay).
- Check our “Portfolio Update” to see some top picks and get ideas for what we might buy or sell.
- Monitor for trade alerts. You can easily check all our trade alerts using our trade alert channel.
- See trade alert articles. When we place a trade (for CWMF, but usually not for Scott) there will be an article that follows the trade alert from the chat channel.
In general, I’ve found that we (that’s CWMF) tend to take gains a bit earlier while Scott waits a bit longer looking for larger gains on each trade. Either strategy is fine. We’ve both generated dramatically positive performance over many years in a sector where the ETFs delivered much weaker performance.
A Recent Example
We can use a recent trade as an example. We recently closed our position in Annaly Capital Management (NLY), while Scott’s position in NLY remains open. Shares are currently (as of writing this) trading within our “neutral” range. That means the price is above the target “buy under,” but below the “overpriced” level. When we trade mortgage REITs, we want to consider the price-to-book ratio. The ideal method utilizes constant updates to book value per share. However, it takes time to generate these estimates. Scott regularly creates updated estimates for use in targets. To create a simplified model of price-to-book ratios, we can use a chart of the historical share price and the book value per share from the end of each quarter:
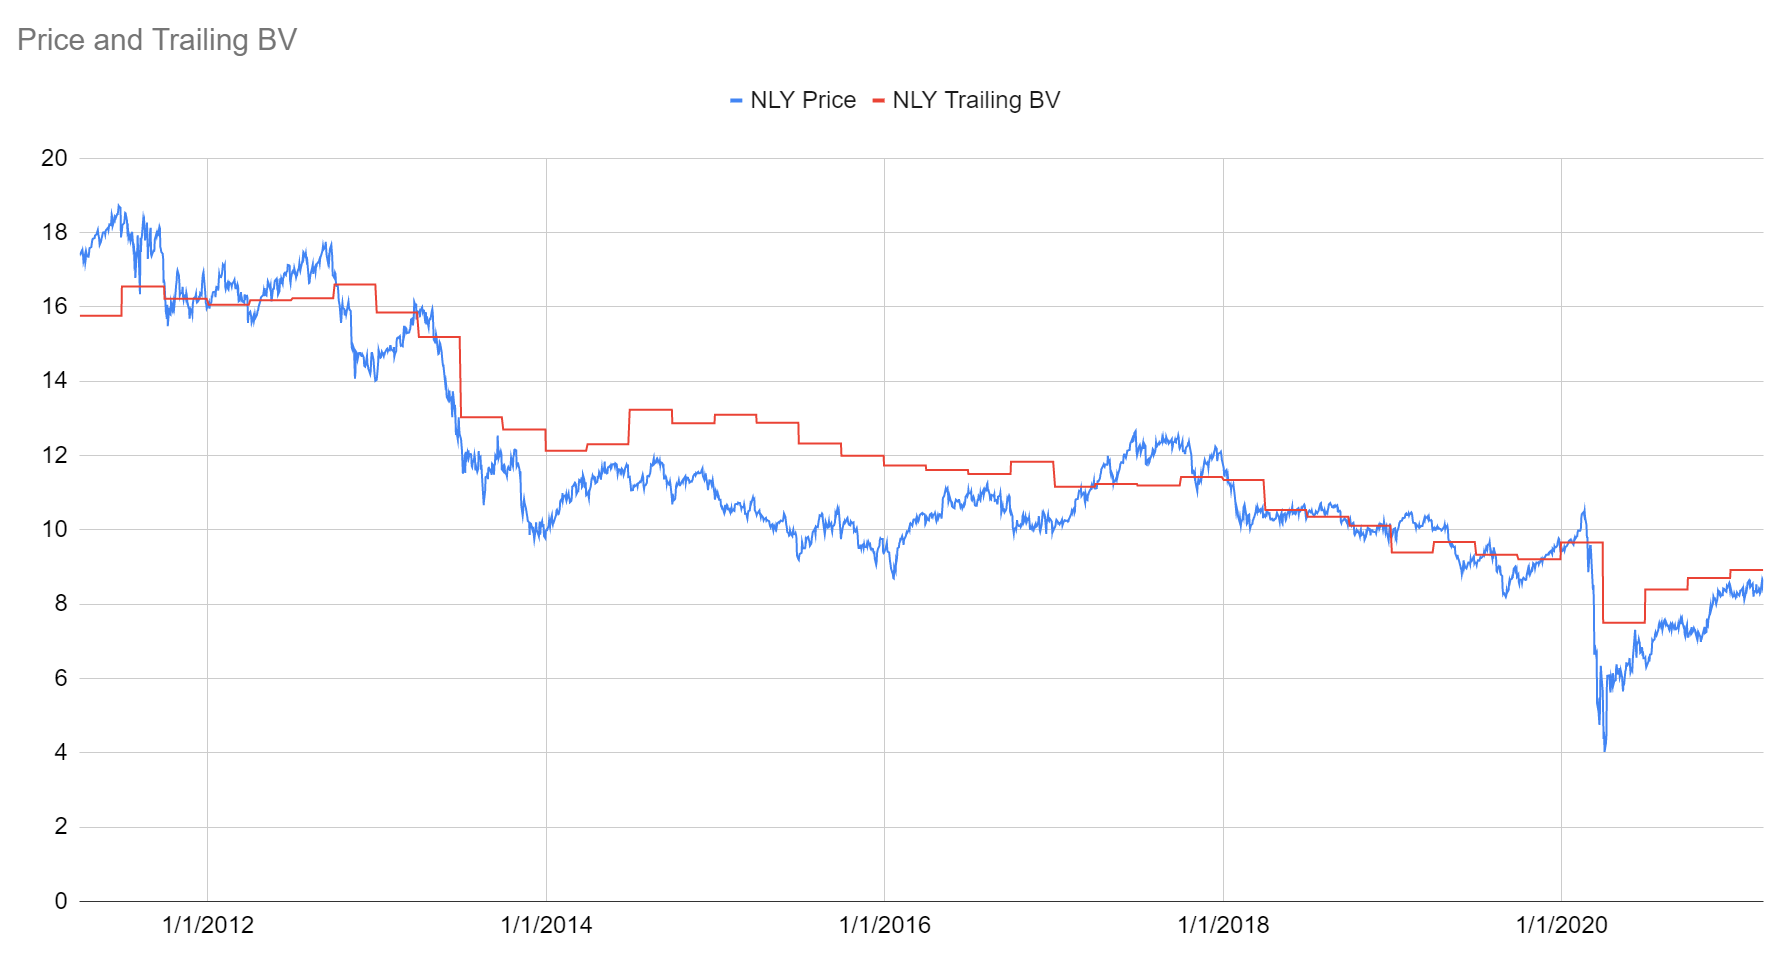
Source: The REIT Forum
This model doesn’t update book value within each quarter. Instead, it waits until the quarter ends. However, you can clearly see that there's a mighty correlation between the price and the book value. The one major downside to this model is that updating the book value at the end of each quarter can lead investors to think the price is doing a better job of predicting the book value during major swings lower. However, those swings often involved book value and share price falling together. The book value just isn’t updated on a daily basis.
We also can run the chart as a comparison between the two values. That gives us the price to trailing book value as a ratio:

Source: The REIT Forum
Using a model like this, you can see that almost all of the values land between 80% and 110%. This creates a range where we would expect the REIT to trade. However, we need to emphasize that this chart is still restricted by using trailing book value per share. If it used the current estimated book value per share, it should be slightly less volatile because it would smooth out the changes in book value per share. When we sold NLY, it was trading around the middle of this range, a bit over 96% (or a .96 price-to-book ratio). In reaching our decision, we had the current estimated book value per share. Currently, the estimated value is very similar to the value as of 12/31/2020 so the result is still a ratio of about .96.
Clearly, there's still more upside in the price. It isn’t near the top of the range and there are some factors, like the steepening yield curve, that could cause investors to be more excited about the stock and drive up the price-to-book ratio. However, we tend to lock in gains a bit early so we closed it out. Scott tends to look for larger gains, so he may look for a higher ratio.
Buying Low Or Selling High
Our focus is on buying low. We don’t need to wait for the very peaks in the price-to-book ratio to have a significant gain. Buying low is the most important thing investors can learn here. However, "buying low" does not simply mean “buy after any decline.” It's critical to understand when a decline is warranted. That’s where Scott’s research comes in. He’s figuring out how much of a change is warranted (primarily due to projected changes in book value, but also considering earnings and dividends) and comparing that with the share price change that actually happened.
This emphasis on buying low is why our long-time subscribers will be so familiar with our “knife-catching” strategy. We tend to go into the sector and deliberately buy the falling knives, but we only do it after Scott has evaluated the changes in the fundamentals. If the price is a falling knife, but the fundamentals remain in place, we know we can reach out to catch the knife with relatively little risk of getting a bad cut. This is demonstrated by the returns on our mortgage REIT trades. We regularly reached out to catch those falling knives yet we’ve only gotten cut a few times in the span of several years.
What confirmation do investors have that we think the knife is ready to be caught? Well, they can use the same five bullet points we listed previously for knowing when to sell.
Holding Forever
The core of a mortgage REIT is simply a leveraged portfolio of option-embedded bonds. Management of a mortgage REIT can’t say with any certainty what environment we will see over the next few years and they have better visibility into those metrics than the analysts. Consequently, there's no viable way to predict the future. We don’t predict the future. We evaluate the risk/reward profile as it exists at a given point in time. There's a world of difference. Many investors are simply stuck in a bullish position indefinitely and want to suggest an indefinite holding period for mortgage REITs.
There were precisely two analysts who warned investors to sell AGNC Investment Corp. before the collapse (see the “Bearish” tag):
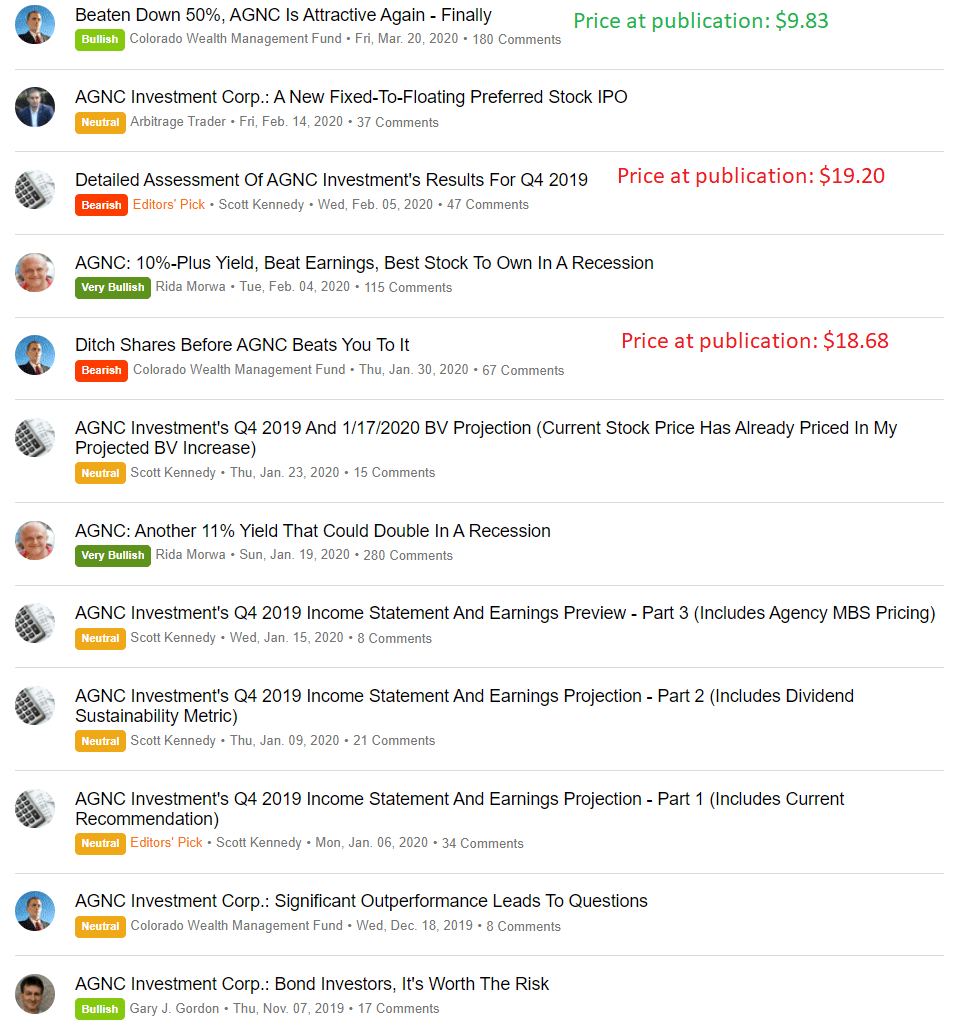
Source: Seeking Alpha
Is it any surprise those two analysts work together to bring you the best research on REITs? You can also see the bullish rating we provided on 3/20/2020 when shares were $9.83 (they are $17.15 today).
Note: At the time we submitted the article for 3/20/2020, the price was $9.38. That's lower than the $9.83 price at publication and thus warranting the “down 50%” title.
However, we also posted warnings on NLY:
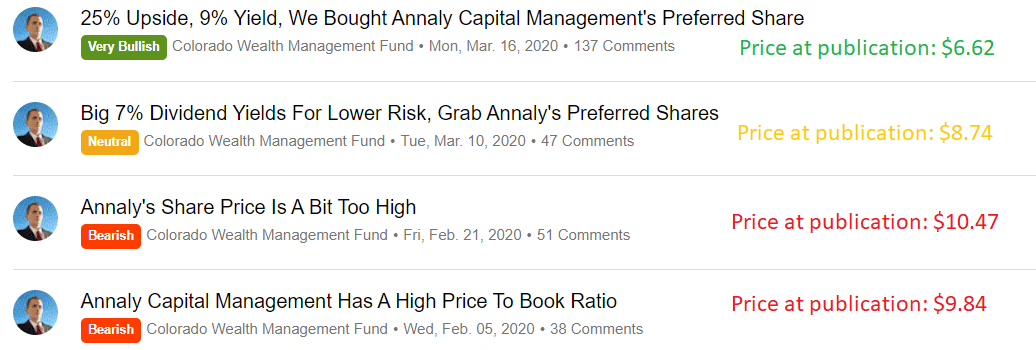
Source: Seeking Alpha
Those two bearish articles are two of the only three bearish articles posted on NLY from January 1st, 2019 to March 1, 2020. That's 14 months for the largest mortgage REIT to get only three bearish ratings.
The one other bearish rating was posted by... "drumroll." It was us. You had to see that coming.
Of course, we’re only pulling the public articles for this demonstration. We had more warnings posted for subscribers and most of my public articles don’t have a primary ticker.
The Pre-Pandemic Warning
The market can get pretty optimistic at times and the risk/reward profile can become heavily skewed. Let’s consider the chart from one of Scott Kennedy’s REIT Forum articles, published on 2/23/2020:
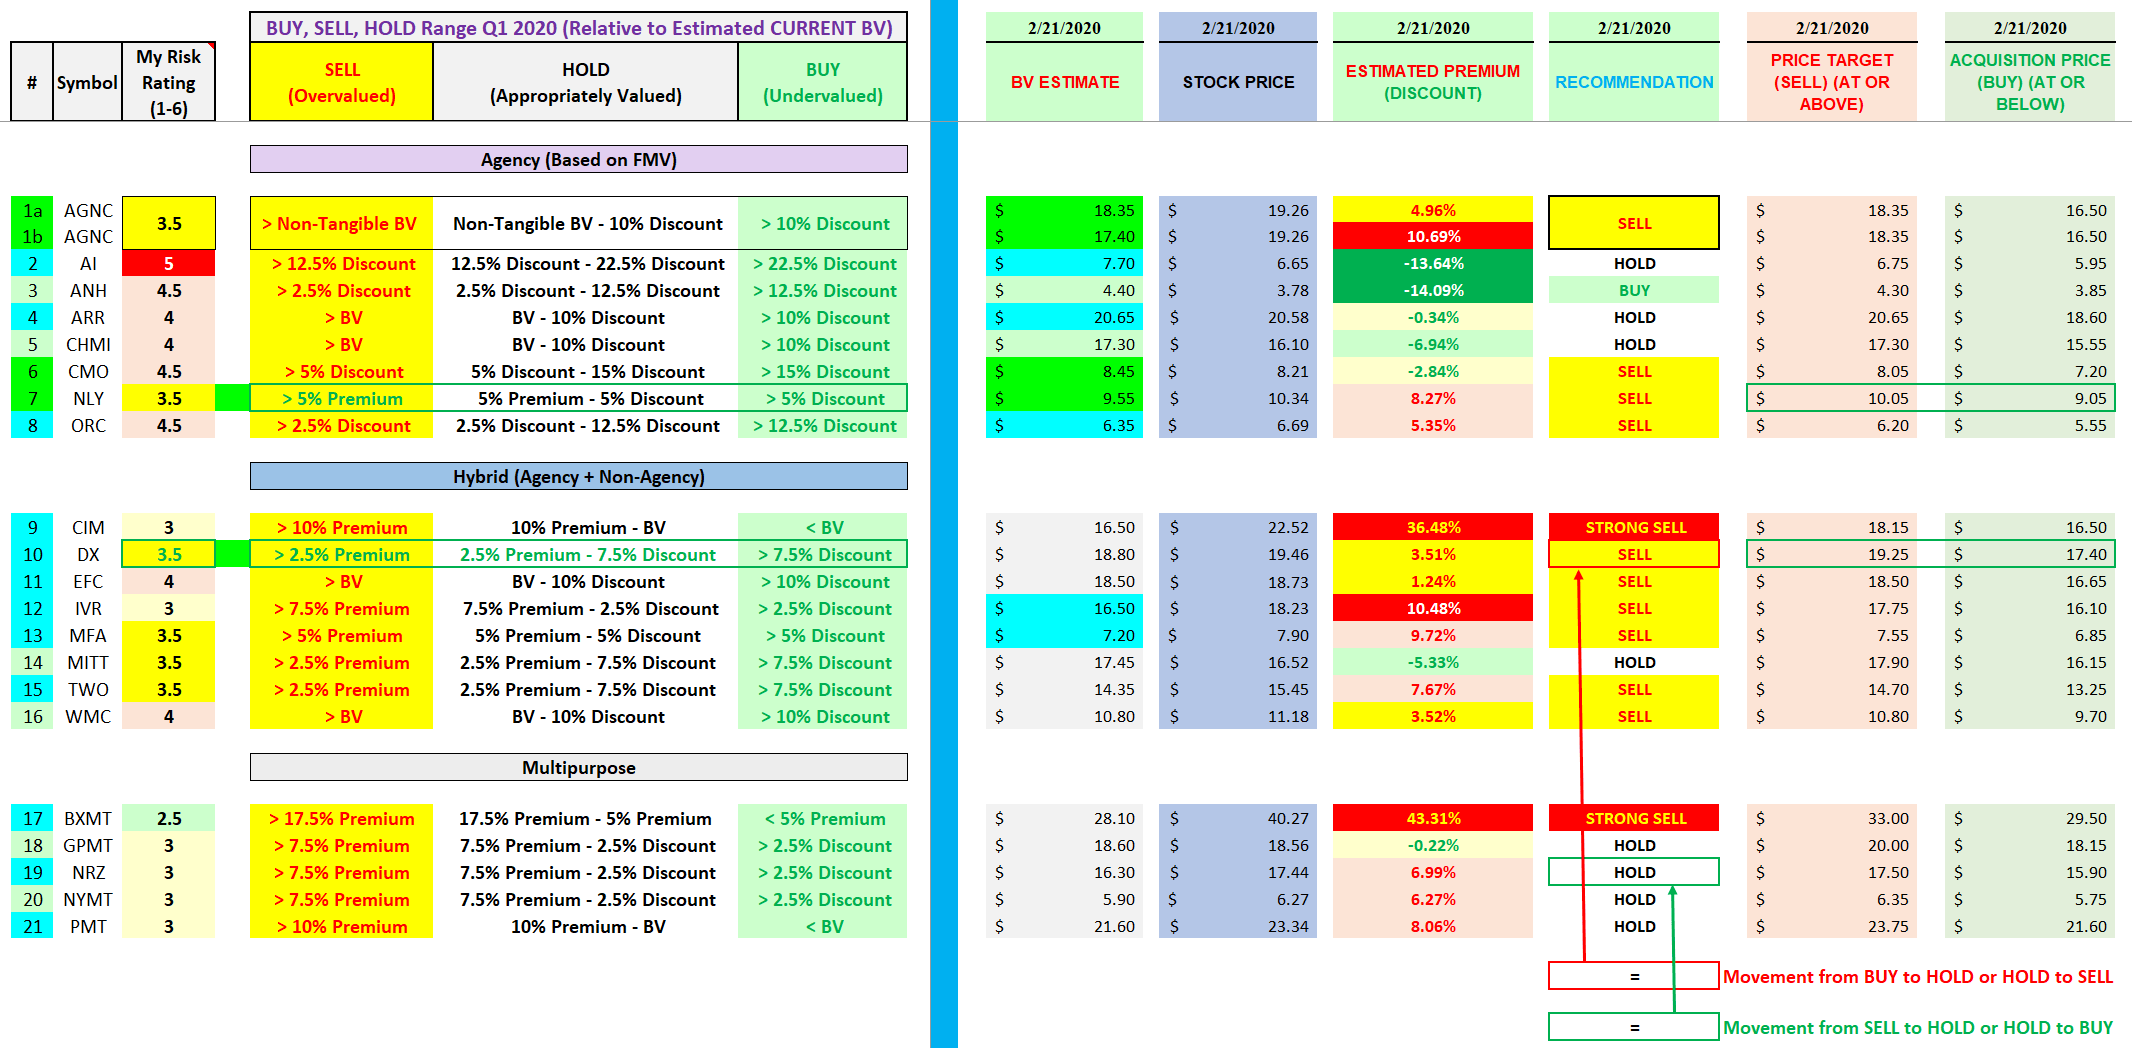
Source: The REIT Forum
Investors can clearly see in that image that there were mostly bearish ratings, a few neutral ratings, and a single bullish rating. This was quite arguably one of the most important things for investors to see in 2020 because it could protect them from large losses and give them the capital necessary to go on a buying spree in March 2020. Yet most analysts would contradict us and continue telling investors to plow their capital into the sector in February of 2020.
Buy and Hold for Dividends?
There's a reason analysts love the idea of buying high-yield securities and holding onto them. It makes them popular. That's great for convincing investors to follow them and even pay for their work.
Investors are far more willing to pay someone to encourage them to do precisely what they already wanted to do. Many are less excited about paying someone to contradict them. They are less excited to read something that challenges their beliefs, even if challenging those beliefs is the path to superior returns.
We’ve nailed the entry points repeatedly. We’ve caught the falling knives and the yields are high. What would happen if we simply removed bearish ratings like “Sell” and “Overpriced” and simply left them all at neutral? Subscription revenue would climb substantially. The majority of investors don’t want to hear the word “Sell.” They treat it as a “four-letter word.”
Great Investments
Investors are looking for analysts who are finding “Great” investments, especially if it produces a huge dividend. There's a conflict here because investors want “Great” investments, but what they actually buy is generally “the most bullish research they can find."
There's a much greater incentive to generate bullish ratings than there's to be accurate. It's much quicker to create a bullish rating based on a small amount of carefully selected information (selected to confirm the narrative) than it's to dig through and hunt for reasons not to buy the stock.
We cover a significant number of stocks and we’ve been remarkably accurate in our ratings. However, the worst thing that can happen for our signups is a rally in share prices. As our portfolio rallies higher, we have fewer bullish ratings and it has a material negative impact on revenue. It reduces new trials and it increases cancellations because investors want a service that’s finding more opportunities. They look for someone with a more bullish outlook and sign up for someone who is willing to lead them right over the cliff. That’s why so many analysts like high-yield REITs indefinitely.
In February 2020, we were posting a bearish outlook for the majority of the sector. Only one in 21 mortgage REITs got a bullish outlook. Which service do you think customers want to try? They want to hear about an exciting new opportunity, not caution about the richly valued market.
I often hear investors say that they want to sign up for research after more opportunities appear. It intuitively makes sense to focus on getting research that identifies shares to buy rather than reasons not to buy those shares. However, it's like a bank manager saying he will wait to hire security until a string of bank robberies hits the area. Don't you want to weed out the bad investments before a negative event takes them down?
Portfolios
Many investors might think that anyone who is perpetually bullish would eventually be destroyed by the losses in portfolio value during a decline. Not so much. An analyst who loses money simply needs to avoid ever posting a table like this:
Source: The REIT Forum
There are three points we need to make:
- It is simple to not track the numbers.
- It is simple to not create a table to display the numbers
- It is simple to not post a table.
Why would an analyst post such a table other than loving transparency?
Our strategy of selling off shares when the risk/reward becomes less favorable enabled us to earn solid returns during 2020, a year when REIT indexes had a terrible performance. What happens after such a strong performance? We have fewer bullish ratings. What do you suppose happens with fewer bullish ratings?
When it comes to evaluating returns, these are the numbers that really matter. It isn't simply the percentage of trades that work out or the ratio of losses to gains. It's the compound annual growth rate created by investment performance throughout the total portfolio.
Equity REIT Questions For Open Positions
Our equity REIT positions are intended for longer investments. However, we do occasionally close a position and often we have doubled down.
When I think about selling an equity REIT, there are three major questions:
- Has my thesis changed materially?
- Do I have other options that I want to own instead?
- Have prices or macro factors shifted abruptly in a way that causes me to question my decision?
In our sales over the last year, the answers were:
- Yes (most of the time)
- Yes (every time)
- Yes (most of the time)
Let’s run through those questions with a quick review of several trades from the last year.
We sold Macerich (MAC) on 3/12/2020. Terrible performance on this trade. Thesis changed. Wanted NYMT preferred shares instead. Huge shift in macro factors.
We sold Prologis (PLD) on 5/1/2020. Great performance but missed out on more growth. Thesis unchanged. Wanted Rexford (REXR) instead. No shift in macro factors.
We sold AIV, Mid-America Apartment Communities, VEREIT (VER), Federal Realty Trust (FRT), and Regency Centers (REG) on 6/15/2020. Thesis changed. Wanted more AvalonBay (AVB). Shift in macro factors. These positions were from prior to the pandemic.
We sold part of our position in Sun Communities (SUI) on 10/9/2020. Thesis unchanged. Wanted apartment REITs instead. Moderate shift in macro factors. In this case, the valuation shift was massive.
The one trade here where the thesis was unchanged and the valuation shift was less than massive is PLD. Perhaps it's no surprise that PLD is the one position we would like to have back.
The Negative Trades - Equity REITs
When we use the term “equity REITs,” we’re talking about a sector that includes several subsectors. We could be looking at housing REITs, data center REITs, mall REITs, or many other categories. As most subscribers will know, retail REITs (mall REITs and to a lesser degree shopping center REITs) have generally performed poorly over the last several years. However, we actually had a slightly positive performance investing in them. It just wasn’t near good enough and it relied far too much on successfully closing positions to lock in gains. The chart below breaks down the performance of our open and closed positions by equity REITs comparing the retail REITs with “any other equity REITs”:
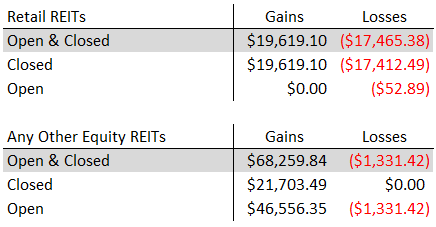
Source: The REIT Forum
Note: We're not classifying triple net lease REITs as “retail REITs” because they have some substantial differences in their fundamentals and demonstrate a low correlation to retail REITs.
You can tell at a glance that our performance in retail REITs wasn’t too great. We turned a slight profit but closed out the vast majority of our exposure. The retail REITs have been dreadful, at least excluding the surge over the last several months. On the other hand, when we look at our other equity REIT picks, we have a staggering ratio of gains to losses. Despite having many open positions and quite a few closed positions in the “any other equity REITs” category, the overall performance is outstanding. Investors could look at the performance for retail REITs and conclude either that our skill in REIT analysis doesn’t apply to retail REITs or that the sector was terrible.
Investors can make their own decisions, but the vast majority of the retail REITs we were using were mall REITs. There are six of them which are still publicly traded and two which were bought out. Among those that still exist, these are their returns since the start of April 2017. We use April 2017, because that is when we purchased the first mall REIT:
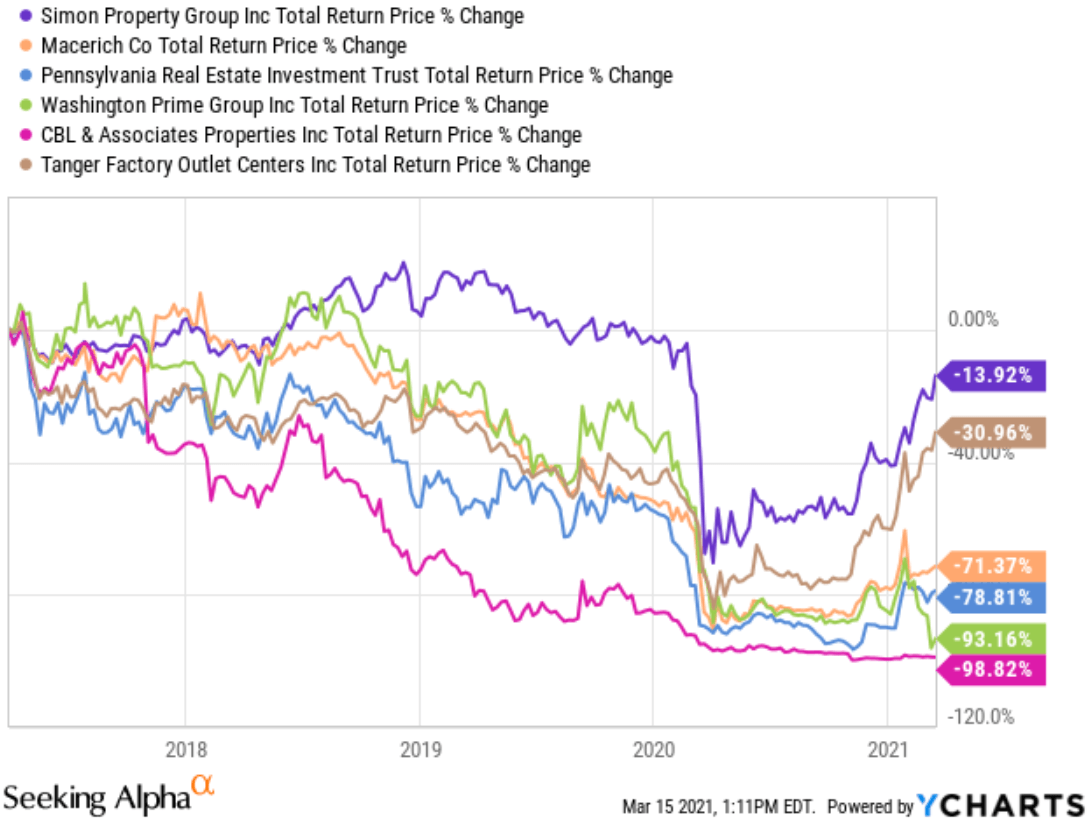
You may notice that during that period, all of them had negative returns. Two of them lost more than 90%. Two others also lost more than 70%. That was an extremely difficult environment for generating positive returns (without shorting). We did it through a series of relatively quick trades, in which we were treating the mall REITs as trading instruments rather than long-term investments. We can be grateful for that. If we weren’t taking gains quickly the decline in the sector would’ve overwhelmed our entry prices.
We learned an important lesson. Specifically, we learned to focus more of our equity REIT research efforts on evaluating our own long-term expectations for future revenue and NOI for the underlying property type. By focusing on REITs where we are far more confident about long-term expectations for growth in revenue and same-property NOI, we generated a buy-and-hold portfolio of equity REITs that we expect to perform over a long period.
Equity REIT Trades
In the interest of transparency, we'll include the equity REIT trades as well. This allows investors to check our math if they wish to.
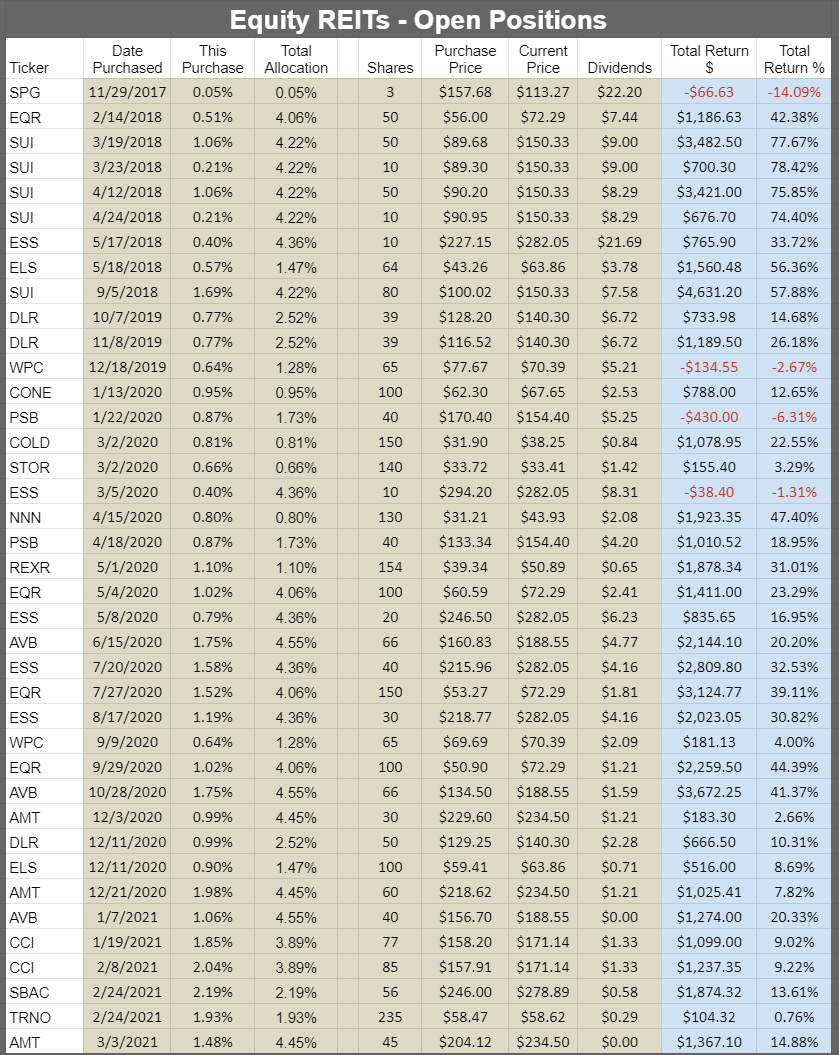
The open positions:
The closed positions:
Source: The REIT Forum
When to Double Down on Equity REITs
We’re happy to double down on positions here as well. Again, we want to consider swings across the sector to determine if we want to buy more of the same REIT or if we want to buy a similar REIT instead. Since we don’t close out our positions in the equity REITs as frequently, we can end up significantly overweight on an equity REIT if there is a large recovery after we increased the position a few times.
When we see the unrealized losses getting up around 5% to 10%, we will usually start glancing at the recent changes across the sector (such as using the $100k chart). That can assist us in deciding if this is the moment to pull the trigger. However, we don’t have any interest in watching the stock price all day. Most of the time goes to researching the underlying stocks. When we need to think about doubling down on a position, we need to pause other research temporarily while we review the potential trade.
When the entire equity REIT sector is declining, we need to think carefully about which REITs we want to increase our position in. Further, if the entire sector is declining together, we will tend to be more cautious about raising the position. If the REIT we own is down 5% but peers are down 10% to 15%, we generally won’t increase the position. We treat the sector weakness as a sign that the deck isn’t stacked in our favor as much as we might otherwise believe.
Long-Term Equity REIT Thinking
Because we take this long-term approach to equity REITs, we emphasize equity REITs with lower leverage and lower risk ratings. When things get ugly, those REITs are in a better position. In contrast, during a major correction event, we may see the weaker REITs forced to do things like issue equity at low prices or take on debt financing with disastrous terms. Those actions, forced by the macroeconomic environment, wouldn’t have been necessary if the REIT carried a stronger balance sheet and invested in better properties before the economic event. Due to the damage occurring during those periods, highly-leveraged equity REITs often underperform by a substantial margin over long time periods.
Because we’re looking for REITs with lower leverage, higher dividend sustainability, and better growth prospects, we will generally be picking REITs that trade at higher than average multiples of AFFO and lower dividend yields. This has been the recipe for success, but it doesn’t appeal to many investors. Consequently, we encourage investors to use other tools (like preferred shares) to enhance the total yield on the portfolio and to gain some diversification benefits.
Reducing Taxes
We don’t spend much time talking about taxes. We don’t specialize in handling tax situations. However, we do have a general rule of thumb. We would prefer to put the equity REITs into the taxable accounts since we expect to hold them for long periods and they have lower yields. All else equal, we would rather put positions with high yields and more short-term trading into tax-advantaged accounts. That means our mortgage REITs and preferred shares should get priority for those accounts, all else equal. That won’t always be possible for investors. When it's possible, it’s a nice way to reduce the total burden from taxes.
Preferred Shares
What about preferred shares? We’ve hardly mentioned them.
After reviewing the article and expanding on sections quite a few times, the word count feature shows we are nearing 7,000 words. I find articles exceeding 3,000 words tend to become more difficult to navigate. We could’ve split up the equity REIT and mortgage REIT sections to create two separate articles (maybe even seven or eight). However, they were already designed to flow together in a manner that would facilitate comparing and contrasting the strategies. Any technique I could find for splitting the sections would require repeating large chunks. When we look at preferred shares, the process has so many differences that it would really flow best as a separate article.
Conclusion
Whether we are looking at mortgage REITs or equity REITs, a large portion of our research goes into finding the right entry points. To get the right entry points, we need a strong understanding of the fundamentals and a plan for the investment.
With mortgage REITs (and BDCs), the transparency created through book value can help to define the reasonable trading range. When we combine that with excellent research on the underlying fundamentals, we build a system to catch opportunities that could otherwise be mistaken for falling knives. However, the trading ranges also give us ideas about when to close out positions.
Rather than having only one opportunity to close the trade, we have several of them so long as we are successfully buying low. By taking a “trading” approach where we are willing to buy and sell shares, we’re able to regularly invest when shares get cheap. Investors who make projections for the next few years on mortgage REITs are guessing blindly. It simply isn’t possible to make reliable projections that far out.
What prediction can you make about a mortgage REIT a few years in the future? We could say that 3 years from today, NLY will probably have a price-to-book ratio between .80 and 1.10. Why? Because that’s the historical range. It’s not certain, but there is a high probability of that happening. What earnings or book value will the REIT have three years from now? We couldn’t say. It isn’t possible to make that kind of a prediction (accurately, without a huge impact from luck) for a leveraged portfolio of option-embedded bonds (which is what we call a mortgage REIT). To invest effectively in this sector, a willingness to occasionally lock in gains will help investors to avoid periods where the risk/reward profile becomes far less attractive.
With equity REITs, a greater emphasis goes into evaluating the long-term projections for the underlying property. If we understand the underlying property, we can get a much better feel for the future cash flows. Since equity REITs are investing in physical real estate, we can predict average future results with greater certainty. For these projections to be reliable, we need to know that the REIT won’t be forced to dump properties at fire-sale prices or dilute shareholders.
Lower leverage can be a substantial advantage in this scenario since it reduces the odds of things going terribly wrong. Investors need only look back over the last two years to see the devastation which impacted many REITs. Leverage was a major factor in determining which REITs suffered permanent damage as opposed to a temporary decline in the share price. Many investors focus so much on low AFFO multiples that they don't realize the AFFO is inflated through dangerous amounts of leverage.
Don't mind me though. You can go back to speculating on the next 50% to 100% upside "opportunity." Don't blame me when it falls apart. I was the one telling investors to reduce risk in February 2020, to buy hard in March 2020, and warning investors again today.
We may raise our cash position over the next month as we seek to move into a more defensive position. Recent allocations have primarily been to lower-risk preferred shares, where we can capture a solid yield with less volatility.
Want the best research? It’s time to raise your game. Get access to several features you won’t find on the public side.
You can get access to everything we have to offer right now. Try our service and decide for yourself.