
Focus of Article:
The focus of this two-part article is to provide a very detailed analysis comparing Annaly Capital Management Inc. (NYSE:NLY) to all the mortgage real estate investment trusts (mREITs). I am writing this two-part article due to the continued requests that such an analysis be specifically performed on NLY and some of the company's mREIT peers at periodic intervals. For readers who just want the summarized conclusions/results, I would suggest to scroll down to the "Conclusions Drawn" section at the bottom of each part of the article.
PART 1 of this article analyzed NLY's recent results and compared several of the company's metrics to nineteen mREIT peers. PART 1 also showed how NLY's book value ("BV") as of 12/31/2020 compared to the nineteen other mREIT peers. PART 1 helps lead to a better understanding of the topics and analysis that will be discussed in PART 2. The link to PART 1's analysis is provided below:
The focus of PART 2 of this article is to compare NLY's recent dividend per share rates, yield percentages, and several dividend sustainability metrics to nineteen mREIT peers. This analysis will show recent past data with supporting documentation within Table 4 below. This article will also discuss NLY's dividend sustainability which is partially based on the metrics outlined in Table 4. A more in-depth analysis of NLY's dividend sustainability will be provided in Table 5 below. This includes a discussion of NLY's dividend decrease of ($0.05) and ($0.03) per common share which occurred during the second quarter of 2019 and 2020, respectively.
By analyzing these metrics, one will better understand which mREIT generally has a safer dividend rate going forward versus other peers who generally have a higher risk for a dividend decrease or a higher probability of a dividend increase and/or a special periodic dividend being declared. When both back testing and projecting the metrics within this analysis, the results have continued to be proven reliable. This is not the only data that should be examined to initiate a position within a particular stock/sector. However, I believe this analysis would be a good "starting-point" to begin a discussion on the topic. At the end of this article, there will be a conclusion regarding the following comparisons between NLY and the nineteen mREIT peers: 1) trailing 12-month ("TTM") yields based on a stock price as of 4/2/2021 (including annual dividend change); 2) annual forward yield based on a stock price as of 4/2/2021; and 3) annual forward yield based on my estimated CURRENT BV (BV as of 4/2/2021; same as 3/31/2021). I will also provide my current BUY, SELL, or HOLD recommendation, dividend per share rate projection for the second quarter of 2021, and price target on NLY.
Side Note: I believe there are several different classifications when it comes to mREIT companies. For purposes of this article, I am focusing on five. For readers who are new to my articles or for existing readers who need a "refresher" on several different mREIT classifications, please see PART 1 of this article (link provided above).
Dividend Per Share Rates and Yield Percentages Analysis
Overview:
Let us start this analysis by getting accustomed to the information provided in Table 4 below. This will be beneficial when comparing NLY to the nineteen mREIT peers within this analysis.
Table 4 - Dividend Per Share Rates and Yield Percentages
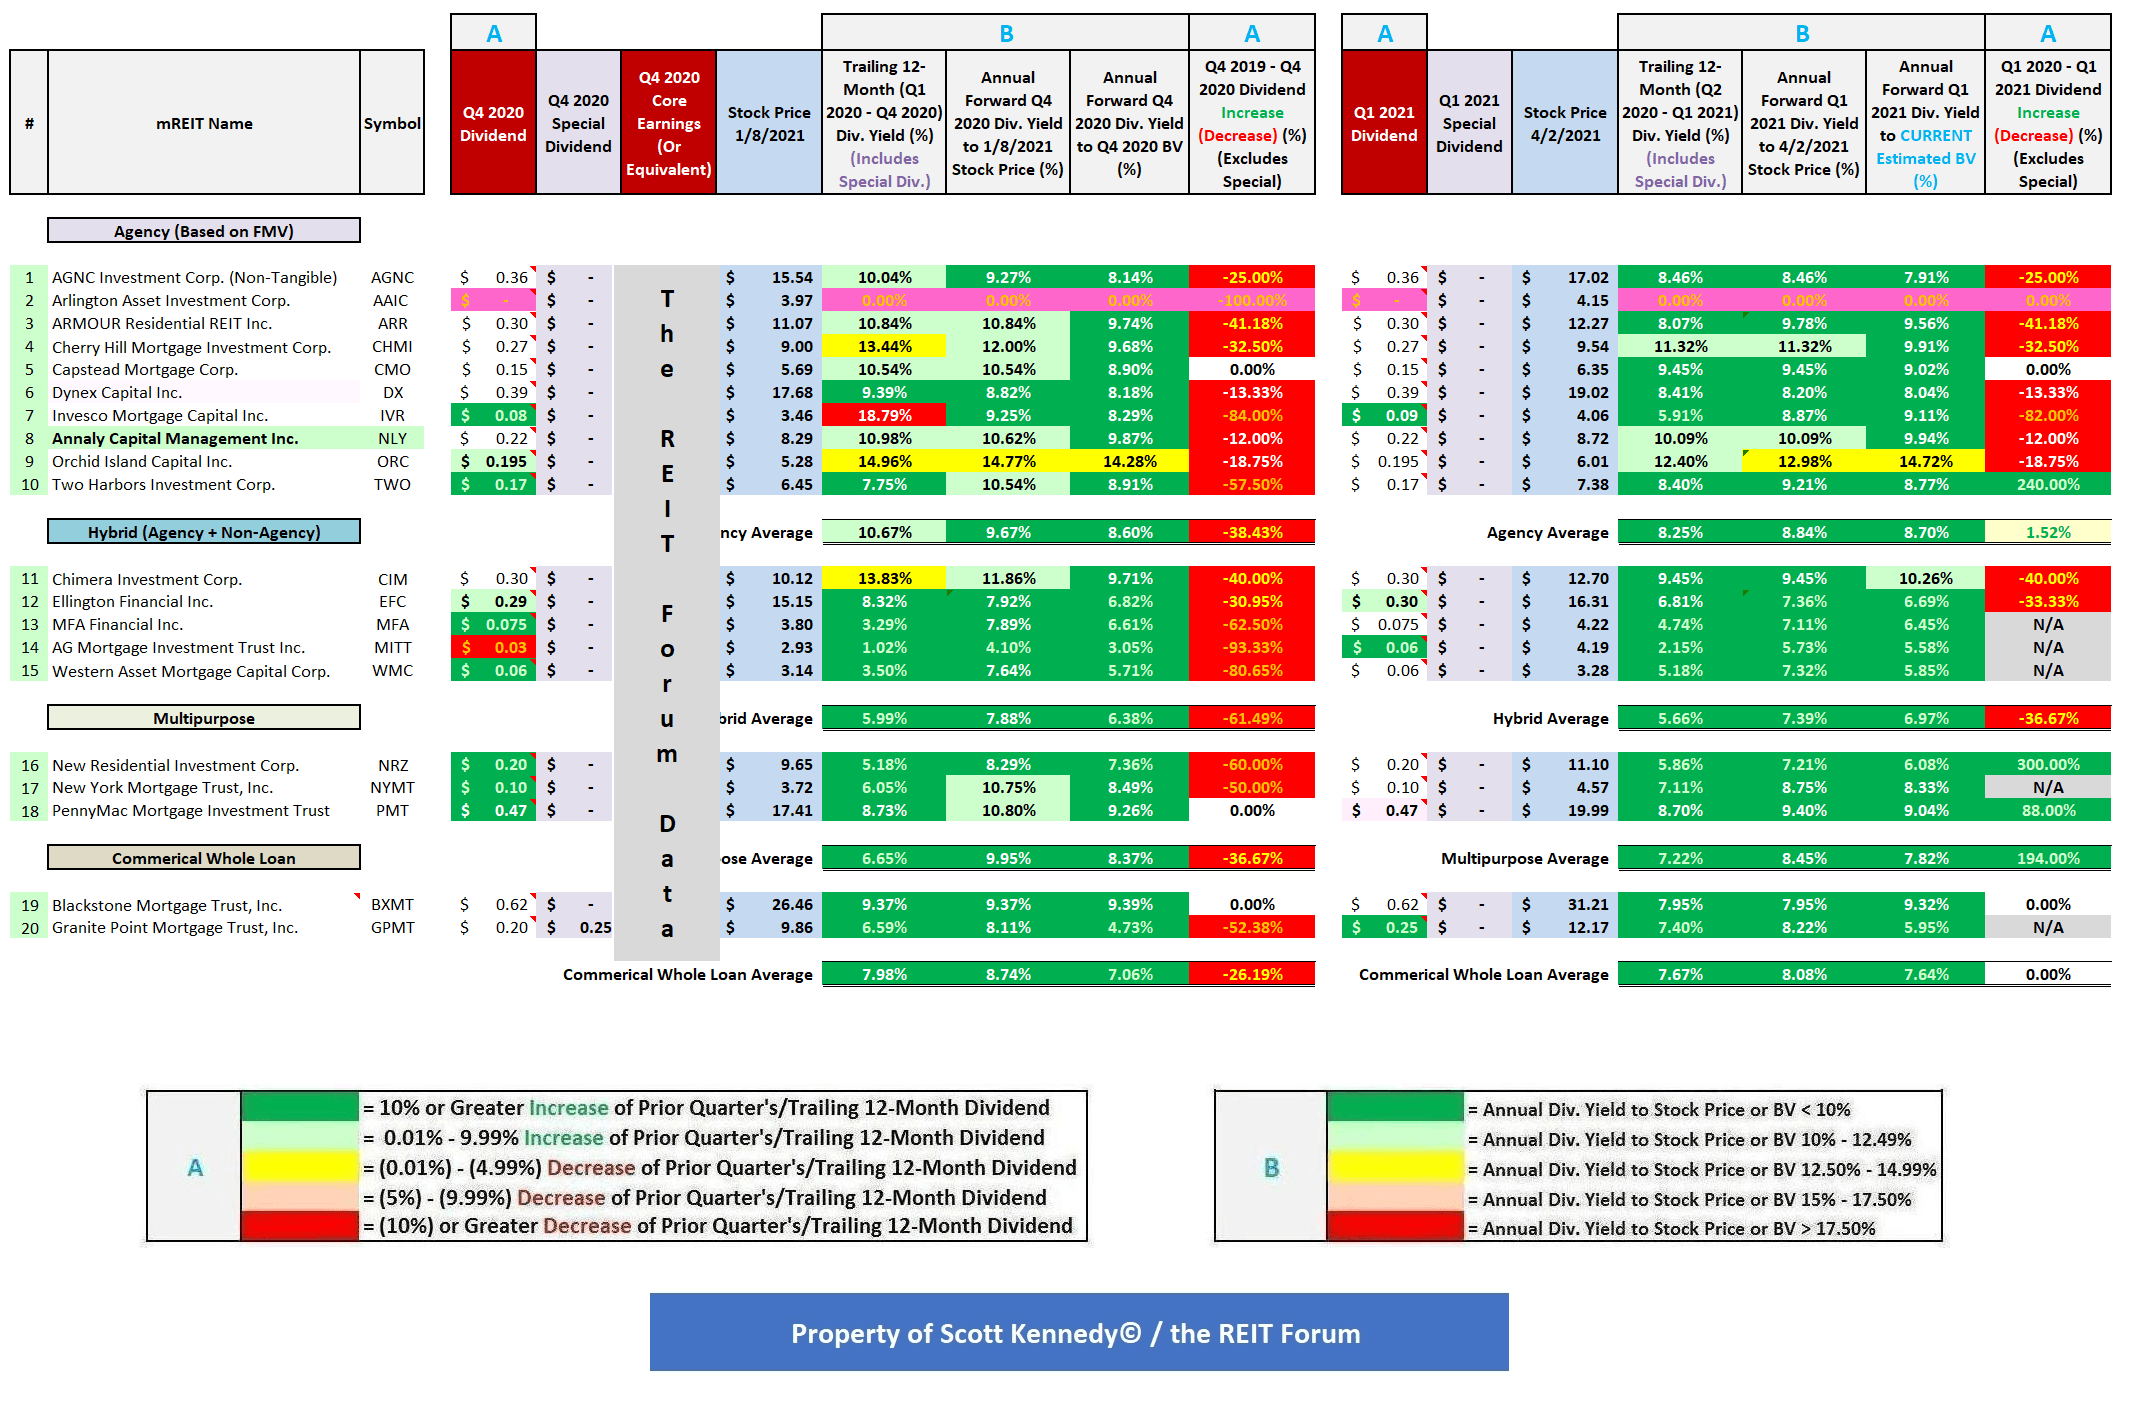
(Source: Table created by me, obtaining historical stock prices from NASDAQ and each company's dividend per share rates from the SEC's EDGAR Database)
Using Table 4 above as a reference, the following information is provided (see each corresponding column): 1) dividend per share rate for the fourth quarter of 2020 (for monthly dividend payers, the total monthly dividends during the quarter); 2) core earnings (or core earnings equivalent) for the fourth quarter of 2020; 3) stock price as of 1/8/2021; 4) TTM dividend yield (dividend per share rate from the first-fourth quarter of 2020); 5) annual forward dividend yield based on the dividend per share rate for the fourth quarter of 2020 using the stock price as of 1/8/2021 (for monthly dividend payers, the latest monthly dividend per share rate during the quarter); 6) annual forward dividend yield based on the dividend per share rate for the fourth quarter of 2020 using a BV as of 12/31/2020 (for monthly dividend payers, the latest monthly dividend per share rate during the quarter); 7) dividend per share rate for the fourth quarter of 2020 versus the fourth quarter of 2019 (percentage fluctuation); 8) dividend per share rate for the first quarter of 2021 (for monthly dividend payers, the total monthly dividends during the quarter); 9) stock price as of 4/2/2021; 10) TTM dividend yield (dividend per share rate from the second quarter of 2020 to first quarter of 2021); 11) annual forward dividend yield based on the dividend per share rate for the first quarter of 2021 using the stock price as of 4/2/2021 (for monthly dividend payers, the latest monthly dividend per share rate during the quarter); 12) annual forward dividend yield based on the dividend per share rate for the first quarter of 2021 using estimated CURRENT BV (BV as of 4/2/2021; same as 3/31/2021) (for monthly dividend payers, the latest monthly dividend per share rate during the quarter); and 13) dividend per share rate for the first quarter of 2021 versus the first quarter of 2020 (percentage fluctuation).
As of 4/2/2021 NLY, AGNC Investment Corp. (AGNC), ARMOUR Residential REIT Inc. (ARR), Cherry Hill Mortgage Investment Corp. (CHMI), Capstead Mortgage Corp. (CMO), Dynex Capital Inc. (DX), Orchid Island Capital Inc. (ORC), Two Harbors Investment Corp. (TWO), Chimera Investment Corp. (CIM), Ellington Financial Inc. (EFC), MFA Financial Inc. (MFA), AG Mortgage Investment Trust Inc. (MITT), Western Asset Mortgage Capital Corp. (WMC), New Residential Investment Corp. (NRZ), New York Mortgage Trust, Inc. (NYMT), Blackstone Mortgage Trust, Inc. (BXMT), and Granite Point Mortgage Trust, Inc. (GPMT) had a stock price that "reset" lower regarding each company's monthly/quarterly dividend accrual. In other words, each company's "ex-dividend date" for March 2021/the first quarter of 2021 had already occurred.
As of 4/2/2021, Invesco Mortgage Capital Inc. (IVR) and PennyMac Mortgage Investment Trust (PMT) had a stock price that has not reset lower in reference to the company's first quarter of 2021 dividend accrual. Arlington Asset Investment Corp. (AAIC) did not declare a common stock dividend for the first quarter of 2021.
Readers should take these points into consideration as the analysis is presented below. Let us now begin the comparative analysis between NLY and the nineteen mREIT peers.
Analysis of NLY:
Using Table 4 above as a reference, NLY declared a dividend of $0.22 per common share for the fourth quarter of 2020. This was an unchanged per common share dividend when compared to the prior quarter. It should also be noted previously, after 22 consecutive quarters of a stable quarterly per share rate, NLY decreased the company's common stock dividend by ($0.05) per share during the second quarter of 2019. Due to the fact NLY aggressively reduced the company's dividend from $0.65 per share during the fourth quarter of 2011 to $0.30 per share by the fourth quarter of 2013, the company was also able to maintain its quarterly dividend per share rate over a longer time period when compared to most sector peers (especially its fixed-rate agency mREIT peers). Mainly due to a flattening yield curve that began back in 2018, along with the continued less "specialness" when it came to dollar-roll (off-balance sheet) financing, there was mounting pressure for NLY to reduce the company's dividend per share rate as 2019 progressed as short-term interest rates rose to 2.50%-2.75%.
NLY's ($0.03) per common share dividend decrease for the second quarter of 2020 was mainly the result of the lower size of NLY's investment portfolio coming out of the initial COVID-19 "pandemic panic" during March 2020. During this timeframe, prior to the Federal ("Fed") Reserve's quick, decisive action to calm markets through both interest rate and monetary policy, repurchase ("repo") agreement and hedging counterparties quickly (and incorrectly in my opinion) initiated margins calls on most sector peers which created a "snowball" effect on this specific market. This included both agency and non-agency mortgage-related investments. In other words, there was a quick, sharp leverage/liquidity crisis across certain pockets of credit markets where certain assets/investments are used as collateral to underlying outstanding borrowings/debt. Most sector peers either chose voluntarily, or were forced, to deleverage and raise cash during this time period. Results varied greatly from peer to peer regarding the severity of each company's investment portfolio reduction. NLY was one of the sector peers who actually came out of the COVID-19 pandemic panic not too much "worse for wear". Some agency, most hybrid, most multipurpose, and some commercial whole loan mREIT peers could not make the same claim.
NLY's stock price traded at $8.29 per share on 1/8/2021. When calculated, this was a TTM dividend yield of 10.98%, an annual forward yield to NLY's stock price as of 1/8/2021 of 10.62%, and an annual forward yield to the company's BV as of 12/31/2020 of 9.87%. When comparing each yield percentage to NLY's agency mREIT peers within this analysis, the company's TTM dividend yield percentage was near (less than 0.50%) average, its annual forward yield percentage based on its stock price was slightly (at or greater than 0.50% but less than 1%) above average, and its annual forward yield percentage based on its BV as of 12/31/2020 was modestly (at or greater than 1% but less than 2%) above average (directly due to the recent more severe dividend percentage decreases from most peers versus NLY). I would also point out AAIC's 0% yield metrics "skew" the three agency mREIT yield averages down a bit.
As was discussed in PART 1 of this article, as of 12/31/2020 NLY had the fourth lowest at-risk leverage ratio (on- and off-balance sheet) when compared to the nine other agency mREIT peers within this analysis. AAIC went from actually having the highest leverage ratio as of 12/31/2019 to the lowest ratio as of 12/31/2020. This is one of the main reasons why this particular fixed-rate agency mREIT did not declare a common stock dividend during 2020 (or the first quarter of 2021). Getting back to NLY, this company typically runs lower leverage versus most of its fixed-rate agency mREIT peers. From charting past trends, typically lower leverage ratios within the fixed-rate agency mREIT sector generally equate to below average to average dividend yield percentages. Of course, there are various other factors at play regarding dividend sustainability (especially in light of the events surrounding COVID-19 pandemic panic back in March 2020). However, a company's leverage ratio is one "general" metric which I believe should be analyzed.
I continue to believe three important metrics to analyze when assessing NLY's near-term dividend sustainability are the company's quarterly estimated REIT taxable income ("ERTI"), estimated core earnings ("ECE"), and its normalized core earnings ("NCE"). Currently, NLY's NCE is the closest metric to the company's "true earnings power" regarding its investment portfolio's performance. To analyze/explain these three metrics, Table 5 is provided below.
Table 5 - NLY Quarterly ERTI, ECE, and NCE Analysis (Q1 2019 - Q4 2020)
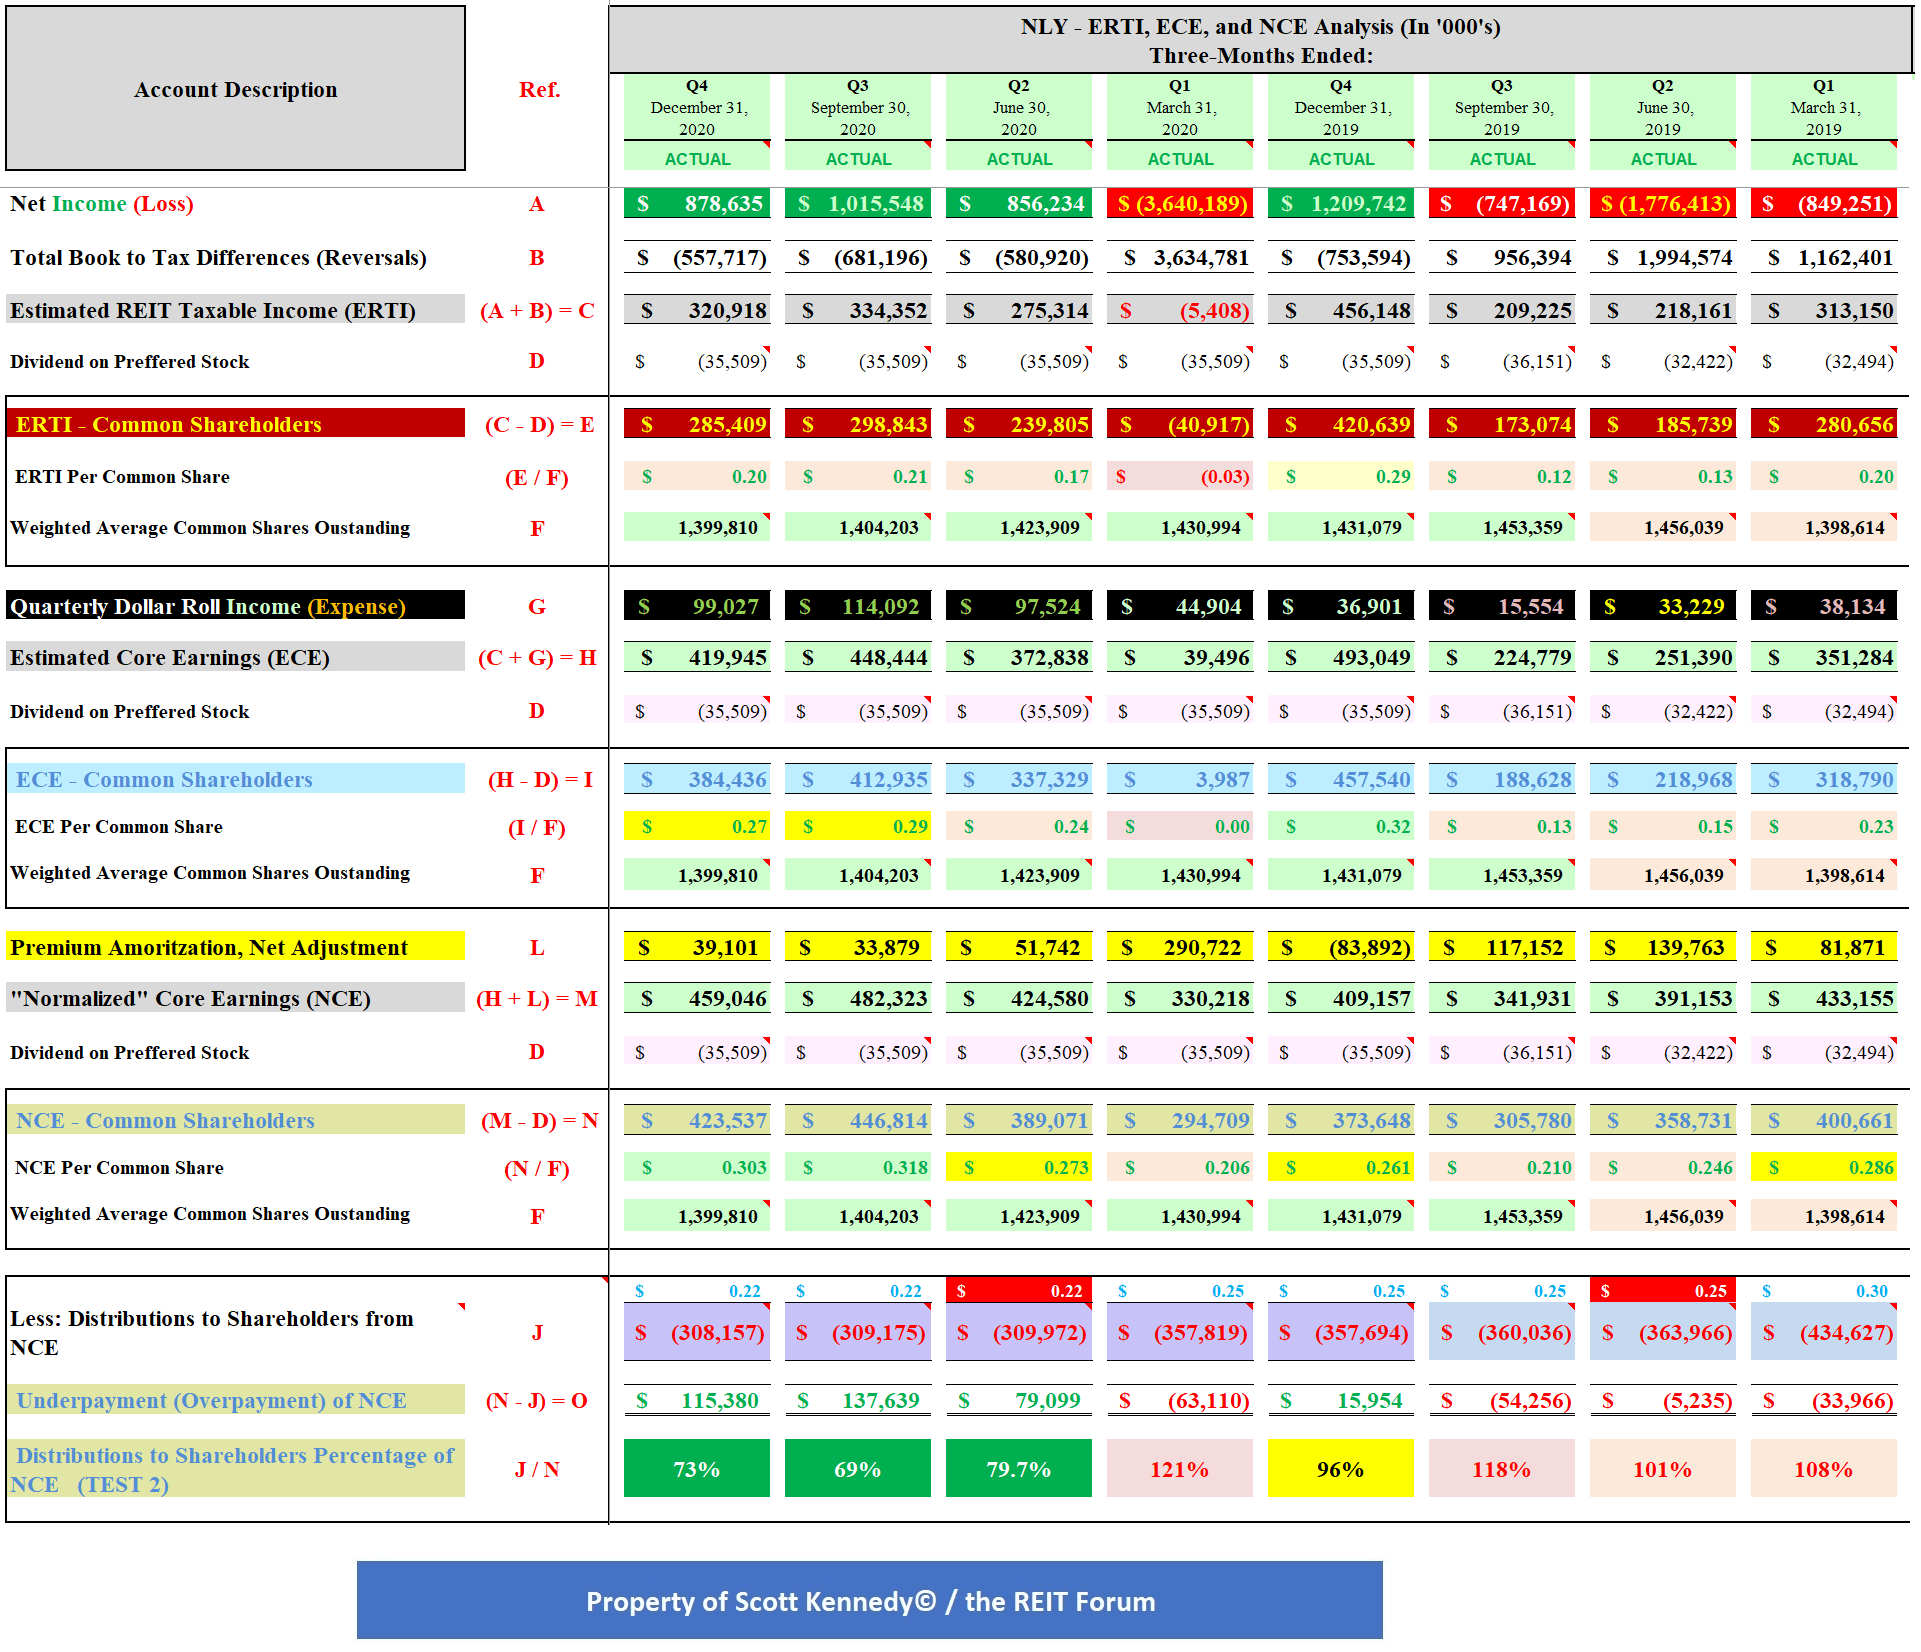 (Source: Table created by me, partially using data obtained from NLY's quarterly shareholder presentation for the first quarter of 2019-fourth quarter of 2020)
Using Table 5 above as a reference, NLY reported quarterly ERTI available to common shareholders of $280.7, $185.7, $173.1, and $420.6 million for the first, second, third, and fourth quarters of 2019, respectively (see red reference "E"). When calculated, NLY had ERTI available to common shareholders of $0.20, $0.13, $0.12, and $0.29 per share, respectively (see red reference "E / F"). This was notably below, notably below, notably below, and slightly above the company's dividend of $0.30, $0.25, $0.25, and $0.25 per common share, respectively.
However, this figure excluded the impact of NLY's net long "to-be-announced" ("TBA") mortgage-backed securities ("MBS") position during each quarter. When including "net dollar roll" ("NDR") income of $38.1, $33.2, $15.6, and $36.9 million (see red reference "G"), NLY reported quarterly ECE available to common shareholders of $318.8, $219.0, $188.6, and $457.5 million for the first, second, third, and fourth quarters of 2019, respectively (see red reference "I"). When calculated, NLY had quarterly ECE available to common shareholders of $0.23, $0.15, $0.13, and $0.32 per share, respectively (see red reference "I / F"). As readers can see, NLY's quarterly ECE was very volatile during 2019.
However, NCE considers an additional Generally Accepted Accounting Principles ("GAAP") to IRC adjustment when compared to quarterly ERTI and ECE (specifically when it comes to NLY). When it comes to most other mREIT peers, this specific adjustment is performed within each mREIT's quarterly ERTI figure. Very important to understand. Dependent upon management's projected lifetime conditional prepayment rate ("CPR") in regards to NLY's MBS portfolio, the "catch-up" premium amortization expense adjustment can materially alter the company's quarterly ERTI and ECE figures. NCE excludes/reverses this GAAP adjustment since an entity's cost basis per the IRC is not par.
As such, when also including NLY's catch-up premium amortization expense adjustment of $81.9, $139.8, $117.2, and ($83.9) million (see red reference "L"), the company reported NCE available to common shareholders of $400.7, $358.7, $305.8, and $373.6 million for the first, second, third, and fourth quarters of 2019, respectively (see red reference "N"). When calculated, NLY had NCE available to common shareholders of $0.29, $0.25, $0.21, and $0.26 per share, respectively (see red reference "N / F"). NLY's NCE calculates to a quarterly dividend distributions payout ratio of 108%, 101%, 118%, and 96% for the first, second, third, and fourth quarters of 2019, respectively (see red reference "J / N").
NLY's NCE payout ratio of 108% for the first quarter of 2019 was the largest overpayment of this metric since the first quarter of 2014. As such, the "pressure" to consider reducing NLY's quarterly common stock dividend of $0.30 per share began to grow earlier in 2019. I believe two of the main reasons why NLY reduced the company's quarterly common stock dividend during the second quarter of 2019 were the following: 1) notably less "specialness"/attractiveness of the forward TBA market (notable decrease in NDR income when keeping constant one's net long TBA MBS notional balance); and 2) 2017-2018 rapid rise of the Fed Funds Rate which led to a rapid increase in repurchase ("repo") loan rates (borrowing costs). I believe this provides strong, factual evidence as to why NLY, at the time, reduced the company's quarterly dividend rate to $0.25 per common share during the second quarter of 2019.
Furthermore, even with NLY's ($0.05) per common share decrease to the company's dividend during the second quarter of 2019, NLY still had a quarterly dividend distributions payout ratio of 101% for the second quarter of 2019. I believe this was a bit "alarming" since NLY just reduced the company's common stock dividend by (17%) while still having a very minor overpayment (greater than 100% but less than 105% payout). In addition, during the third quarter of 2019, NLY already had a quarterly dividend distributions payout ratio of 118%. Simply put, this should have been seen as "very alarming" since this payout was already based on NLY's reduced dividend of $0.25 per common share. This "hinted" there was already some pressure on NLY to reduce the dividend again.
I also believe this 118% payout for the third quarter of 2019 was the main reason NLY "pre-announced" their common stock dividend for the fourth quarter of 2019 (which was unchanged at $0.25 per common share). Simply put, management wanted to "calm down" markets with an unchanged dividend. At the time, this was due to the fact management believed the partially inverted yield curve would "correct itself" during 2020. While I previously correctly projected NLY's NCE for the fourth quarter of 2019 would increase when compared to the third quarter of 2019 (recent steepening of the yield curve; including the beginning of a decrease in repo loan rates/borrowing costs), when it comes to dividend sustainability, I previously stated this specific metric still needed to be monitored over the foreseeable future.
Moving to 2020, NLY reported quarterly ERTI available to common shareholders of ($40.9) million for the first quarter of 2020. When calculated, NLY had ERTI available to common shareholders of ($0.03) per share. This figure was notably below the company's dividend of $0.25 per common share for the first quarter of 2020. As discussed earlier, this figure excluded the impact of NLY's net long TBA MBS position and lifetime CPR adjustment. When including NDR income of $44.9 million, NLY reported quarterly ECE available to common shareholders of $4.0 million for the first quarter of 2020. When calculated, NLY had quarterly ECE available to common shareholders of less than $0.01 per share. When also including NLY's catch-up premium amortization expense adjustment of $290.7 million, the company reported NCE available to common shareholders of $294.7 million for the first quarter of 2020. When calculated, NLY had NCE available to common shareholders of $0.21 per share. This calculates to a quarterly dividend distributions payout ratio of 121%. This percentage surpassed the third quarter of 2019 as being NLY's highest quarterly dividend distributions payout ratio since the first quarter of 2014.
As such, the pressure to consider reducing NLY's quarterly common stock dividend of $0.25 per share, which began back in the second half of 2019, only mounted with the company's performance of this specific metric during the first quarter of 2020. I believe two of the main reasons why NLY reduced the company's quarterly common stock dividend during the second quarter of 2020 were the following: 1) reduction in investment portfolio size as a direct result of the "spike" in leverage, liquidity; and 2) spread/basis risk in March 2020 as a direct result of the COVID-19 pandemic panic (including the impact this event had on broader credit/equity markets).
With that said, NLY's quarterly dividend was reduced twice within five quarters. Simply from an annual taxation standpoint, this boded well for dividend sustainability in the future (less taxable income is being paid out during the year; leading to less "short-falls" at year-end). As important, NLY's "prospects" for taxable income over the foreseeable future "brightened" as a direct result of the recent rapid decline of the Fed Funds Rate; which in turn has caused a continual drop in agency repo loan rates. In addition, the specialness/attractiveness of the forward TBA MBS market once again increased (especially within lower coupons). Since the probability of short-term rates remaining "lower for longer" appears to greatly outweigh the 2018-2019 trend of rising short-term interest rates, mREIT peers who continue (or "rotate") capital into agency MBS should experience attractive net interest margins (even as lower coupons become a greater share of the secondary MBS market). This began to play out during the second quarter of 2020 which continued during the third and fourth quarters of 2020 (which was previously correctly projected). The magnitude of borrowing cost decreases should "outweigh" continued elevated prepayments and the gradual shift into lower coupons. As such, net portfolio yields will be an important metric to continually monitor (which is something I always project/track).
NLY reported quarterly ERTI available to common shareholders of $239.8, $298.8, and $285.4 million for the second, third, and fourth quarters of 2020, respectively. When calculated, NLY had ERTI available to common shareholders of $0.17, $0.21, and $0.20 per share, respectively. These figures were slightly to modestly below the company's dividend of $0.22 per common share for the second to fourth quarters of 2020. As discussed earlier, this figure excluded the impact of NLY's net long TBA MBS position and lifetime CPR adjustment. When including NDR income of $97.5, $114.1, and $99.0 million, NLY reported quarterly ECE available to common shareholders of $337.3, $412.9, and $384.4 million for the second, third, and fourth quarters of 2020, respectively. When calculated, NLY had quarterly ECE available to common shareholders of $0.24, $0.29, and $0.27 per share, respectively.
When also including NLY's catch-up premium amortization expense adjustment of $51.7, $33.9, and $39.1 million, the company reported NCE available to common shareholders of $389.1, $446.8, and $423.5 million for the second, third, and fourth quarters of 2020, respectively. When calculated, NLY had NCE available to common shareholders of $0.27, $0.32, and $0.30 per share, respectively. This calculates to a quarterly dividend distributions payout ratio of 80%, 69%, and 73%, respectively. With the nice "bounce back" in NLY's NCE, along with the recently reduced dividend, these were the lowest quarterly dividend distributions payout ratios since I began covering this mREIT back in the first quarter of 2013 (a very positive catalyst/trend).
In direct comparison, non-agency mREIT portfolios are at a modest to notable disadvantage in the current environment when it comes to funding costs. This especially holds true for the really "beaten up" hybrid mREIT peers who "inked" term financing deals last year at unattractive to very unattractive stated rates (some rates north of 8% which are greater than the yield on the underlying investments). As such, these companies will have to "once again" lever up capital in order to turn a profit on that portion of debt. In most cases, the rise in leverage will be on assets/investments that continue to experience heightened credit risk. Simply put, for most peers with non-agency MBS/mortgage-related exposure, not an "ideal" situation over the foreseeable future if a more "down-beat"/bearish outlook on the economy comes to fruition. That said, several non-agency mREIT peers have recently terminated/paid down some of this higher cost debt which is a step in the right direction regarding lowering operational costs.
Once again using Table 4 as a reference, NLY declared a dividend of $0.22 per share for the first quarter of 2021. This was an unchanged dividend when compared to the prior quarter. NLY's stock price traded at $8.72 per share on 4/2/2021. When calculated, this was a TTM dividend yield of 10.09%, an annual forward yield to NLY's stock price as of 4/2/2021 of 10.09%, and an annual forward yield to the company's estimated CURRENT BV of 9.94%. When comparing each yield percentage to NLY's agency mREIT peers within this analysis, the company's TTM dividend yield percentage, its annual forward yield percentage based on its stock price, and annual forward yield percentage based on its estimated CURRENT BV was modestly above average. Going forward, I continue to believe NLY should have an annual forward yield slightly to modestly above the agency mREIT average. I would also point out AAIC's 0% yield metrics skew the three agency mREIT yield averages down a bit.
A Couple Comparisons Between NLY and the Company's Nineteen Other mREIT Peers:
The REIT Forum Feature
I continue to believe most mREIT peers declared their "dividend lows" back in 2020 (which I originally correctly projected "as it was occurring" last year). Nearly all sector peers, outside ORC (discussed next), continue to have very low to low annual forward yields when compared to my projected CURRENT BVs regarding projecting/forecasting dividend sustainability (or increased dividend per share rates). This metric provides strong, quantitative evidence why no mREIT peers I currently cover reported a dividend decrease over the past several quarters.
I would point out ORC accounts for the company's premium amortization expense equivalent differently when compared to all agency mREIT peers. This leads to timing differences which can "prop up" weighted average yields during certain interest rate cycles. As such, ORC's yield percentages continue to be notably above the agency mREIT average. Further discussion of this ORC topic is beyond an NLY sector comparison article (also has been extensively covered in prior mREIT articles over the years).
Conclusions Drawn (PART 2):
PART 2 of this article compared NLY to nineteen mREIT peers in regards to recent dividend per share rates, yield percentages, and several other dividend sustainability metrics. This article also discussed NLY's fairly recent and recent dividend decrease of ($0.05) and ($0.03) per common share during the second quarter of 2019 and 2020, respectively. Using Table 4 as a reference, the following were the recent dividend per share rate and yield percentages for NLY:
NLY: $0.22 per common share dividend for the first quarter of 2021; 10.09% TTM dividend yield; 10.19% annual forward yield to the company's stock price as of 4/2/2021; and 9.94% annual forward yield to my projected CURRENT BV.
When combining this data along with metrics within Table 5 (most notably NCE) and other modeling sources, the following probability regarding NLY's near-term dividend sustainability is provided:
NLY: Very high (90%) probability of a stable to slightly increasing dividend for Q2 2021
Q2 2021 Projected NCE: $0.250-$0.300 per common share
"Best Case" Q2 2021 Scenario (25% Probability): $0.25 per common share dividend
"Worst Case" Q2 2021 Scenario (60% Probability): $0.22 per common share dividend
"Middle-of-the-Road" Q2 2021 Scenario (15% Probability): $0.23-$0.24 per common share dividend
I believe the movement of MBS prices will directly impact NLY's use of the TBA forward market (which directly impacts NDR income). As explained in PART 1 of this article, NLY's leverage, borrowing costs, hedging coverage ratio (risk management strategy), and prepayment speeds also need to be considered when discussing this topic. The main factor for NLY's projected NCE to remain above the company's dividend per share rate is the continued extremely low borrowing costs in direct relation to the company's agency MBS holdings partially mitigated by higher borrowing costs of NLY's other sub-portfolios (due to credit risk), continued elevated prepayment risk (though this risk has abated a bit this past quarter), and rising hedging costs regarding a couple specific derivative instruments.
19 mREIT Dividend Projections for Q2 2021:
The REIT Forum Feature
My BUY, SELL, or HOLD Recommendation:
Through an analysis that will be omitted from this particular article, my projected NLY CURRENT BV (BV as of 4/2/2021) is approximately $8.85 per share. This projection includes accounting for NLY's recent quarterly dividend of $0.22 per common share (ex-dividend date already occurred). The general relationship between MBS pricing and derivative instrument valuations during the first quarter of 2021 will be fully discussed in an upcoming AGNC projection series of articles.
From the analysis provided above, including additional catalysts/factors not discussed within this article (some metrics were covered in PART 1), I currently rate NLY as a SELL when I believe the company's stock price is trading at or greater than a 5% premium to my projected CURRENT BV, a HOLD when trading at less than a 5% premium through less than a (5%) discount to my projected CURRENT BV, and a BUY when trading at or greater than a (5%) discount to my projected CURRENT BV. These percentage ranges are unchanged when compared to my last public NLY article (PART 1 of this article).
Therefore, I currently rate NLY as a HOLD.
As such, I currently believe NLY is appropriately valued from a stock price perspective. My current price target for NLY is approximately $9.30 per share. This is currently the price where my recommendation would change to a SELL. The current price where my recommendation would change to a BUY is approximately $8.40 per share.
Along with the data presented within this article, this recommendation considers the following mREIT catalysts/factors: 1) projected future MBS/investment price movements; 2) projected future derivative valuations; and 3) projected near-term dividend per share rates. These recommendations also consider the eight Fed Funds Rate increases by the Federal Open Market Committee ("FOMC") during December 2016-2018 (a more hawkish tone/rhetoric when compared to 2014-2016), the three Fed Funds Rate decreases during 2019 due to the more dovish tone/rhetoric regarding overall monetary policy as a result of recent macroeconomic trends/events, and the very quick "plunge" in the Fed Funds Rate to near 0% in March 2020. This also considers the previous wind-down/decrease of the Fed Reserve's balance sheet through gradual runoff/partial non-reinvestment (which began in October 2017 which increased spread/basis risk) and the prior "easing" of this wind-down that started in May 2019 regarding U.S. Treasuries and August 2019 regarding agency MBS (which partially reduced spread/basis risk when volatility remained subdued). This also considers the early Spring 2020 announcement of the start of another round of "quantitative easing" that includes the Fed specifically purchasing agency MBS (and "rolling over" all principal and interest payments into new agency MBS) which should bolster prices while keeping long-term/mortgage interest rates near historical lows (which has lowered spread/basis risk for some time now when volatility remains subdued).
Each investor's BUY, SELL, or HOLD decision is based on one's risk tolerance, time horizon, and dividend income goals. My personal recommendation will not fit each reader's current investing strategy. The factual information provided within this article is intended to help assist readers when it comes to investing strategies/decisions.
Current/Recent mREIT Sector Stock Disclosures:
On 3/18/2020, I initiated a position in NLY at a weighted average purchase price of $5.05 per share (large purchase). This weighted average per share price excludes all dividends received/reinvested.
On 1/31/2017, I initiated a position in NRZ at a weighted average purchase price of $15.10 per share. On 6/29/2017, 7/7/2017, and 12/21/2018, I increased my position in NRZ at a weighted average purchase price of $15.775, $15.18, and $14.475 per share, respectively. When combined, my NRZ position had a weighted average purchase price of $14.912 per share. This weighted average per share price excluded all dividends received/reinvested. On 2/6/2020, I sold my entire NRZ position at a weighted average sales price of $17.555 per share as my price target, at the time, of $17.50 per share was surpassed. This calculates to a weighted average realized gain and total return of 17.7% and 41.2%, respectively. I held this position, on a weighted average basis, for approximately 20 months.
On 9/22/2020, I once again initiated a position in NRZ at a weighted average purchase price of $7.645 per share. On 1/28/2021, I increased my position in NRZ at a weighted average purchase price of $9.415 per share. When combined, my NRZ position has a weighted average purchase price of $8.53 per share This weighted average per share price excludes all dividends received/reinvested.
On 6/29/2017, I initiated a position in CHMI at a weighted average purchase price of $18.425 per share. On 10/6/2017, 10/26/2017, 11/6/2017, 1/29/2018, 10/12/2018, 6/6/2019, 7/23/2019, 9/5/2019, 3/16/2020, and 4/6/2020 I increased my position in CHMI at a weighted average purchase price of $18.015, $18.245, $17.71, $17.145, $17.235, $16.315, $15.325, $12.435, $8.55, and $3.645 per share, respectively. When combined, my CHMI position has a weighted average purchase price of $7.735 per share (yes, my last 3 purchases were proportionately large). This weighted average per share price excludes all dividends received/reinvested. On 3/10/2021, I sold my entire CHMI position at a weighted average sales price of $10.405 per share as my price target, at the time, of $10.40 per share was surpassed. This calculates to a weighted average non-annualized realized gain and total return of 34.5% and 52.2%, respectively. I held this position, on a weighted average basis, for approximately 14 months. This calculates to a weighted average annualized total return of 44.0%.
On 8/31/2017, I initiated a position in CHMI's Series A preferred stock, (CHMI.PA). On 9/12/2017 and 4/6/2020, I increased my position in CHMI-A at a weighted average purchase price of $25.145 and $10.945 per share, respectively. When combined, my CHMI-A position had a weighted average purchase price of $18.071 per share. This weighted average per share price excluded all dividends received/reinvested. On 6/8/2020, I sold my entire CHMI-A position at a weighted average sales price of $24.273 per share. This calculates to a weighted average realized gain and total return of 34.3% and 49.4%, respectively. I held this position, on a weighted average basis, for approximately 1.7 years. This calculates to a weighted average annualized total return of 29.7%.
On 1/29/2018, I initiated a position in TWO at a weighted average purchase price of $15.155 per share. On 4/17/2019, I increased my position in TWO at a weighted average purchase price of $13.165 per share. When combined, my TWO position had a weighted average purchase price of $13.825 per share. This weighted average per share price excluded all dividends received/reinvested. On 2/3/2020, I sold my entire TWO position at a weighted average sales price of $15.355 per share as my price target, at the time, of $15.25 per share was surpassed. This calculates to a weighted average realized gain and total return of 11.0% and 25.2%, respectively. I held this position, on a weighted average basis, for approximately 13 months.
On 3/8/2018, I initiated a position in NYMT's Series D preferred stock, (NYMTN). On 4/6/2018, 4/27/2018, 10/12/2018, 12/7/2018, 12/18/2018, and 3/22/2019 I increased my position in NYMTN. When combined, my NYMTN position had a weighted average purchase price of $22.379 per share. This weighted average per share price excluded all dividends received/reinvested. On 12/8/2020-12/9/2020, I sold my entire NYMTN position at a weighted average sales price of $23.287 per share. This calculates to a weighted average realized gain and total return of 4.1% and 24.0%, respectively. I held this position, on a weighted average basis, for approximately 27 months.
On 10/12/2018, I initiated a position in GPMT at a weighted average purchase price of $18.155 per share. On 5/12/2020, 5/27/2020, 5/28/2020, 8/26/2020, 9/10/2020, and 9/11/2020, I increased my position in GPMT at a weighted average purchase price of $4.745, $5.144, $5.086, $6.70, $6.19, and $6.045 per share, respectively. My last two purchases make up approximately 50% of my total position (to put things in better perspective). When combined, my GPMT position has a weighted average purchase price of $6.234 per share. This weighted average per share price excludes all dividends received/reinvested.
On 10/12/2018, I initiated a position in MITT at a weighted average purchase price of $17.105 per share. On 4/17/2019 and 6/3/2019, I increased my position in MITT at a weighted average purchase price of $16.22 and $15.52 per share, respectively. When combined, my MITT position had a weighted average purchase price of $15.946 per share. This weighted average per share price excludes all dividends received/reinvested. On 5/11/2020, I sold my entire MITT position at a weighted average sales price of $2.115 per share as my price target, at the time, was surpassed (as MITT's estimated BV as of 4/30/2020 was even lower versus my previously projected (75%) quarterly BV decrease [6/30/2020 versus 3/31/2020]). This was my first "realized total loss" within either the mREIT or business development company ("BDC") sector since I began writing here on Seeking Alpha in 2013. With that said, my proportional allocation in MITT (versus the rest of the mREIT sector) was small.
On 6/3/2019, I initiated a position in ARR at a weighted average purchase price of $17.545 per share. On 9/10/2019, I increased my position in ARR at a weighted average purchase price of $16.785 per share. When combined, my ARR position had a weighted average purchase price of $16.975 per share. This weighted average per share price excluded all dividends received/reinvested. On 2/20/2020, I sold my entire ARR position at a weighted average sales price of $21.045 per share as my price target, at the time, of $20.90 per share was surpassed. This calculates to a weighted average non-annualized realized gain and total return of 24.0% and 31.0%, respectively. I held this position, on a weighted average basis, for approximately 6 months.
On 6/3/2019, I initiated a position in IVR at a weighted average purchase price of $15.49 per share. This weighted average per share price excludes all dividends received/reinvested. On 2/14/2020, I sold my entire IVR position at a weighted average sales price of $17.965 per share as my price target, at the time, of $17.95 per share was surpassed. This calculates to a weighted average non-annualized realized gain and total return of 16.0% and 25.0%, respectively. I held this position for approximately 8 months.
On 11/22/2019, I initiated a position in Anworth Mortgage Asset Corp. (ANH) at a weighted average purchase price of $3.475 per share. This weighted average per share price excluded all dividends received/reinvested. On 12/23/2020, I sold my entire ANH position at a weighted average sales price of $2.75 per share as my price target, at the time, was surpassed. This was my second "realized total loss" within either the mREIT or BDC sector since I began writing here on Seeking Alpha in 2013. With that said, my proportional allocation in ANH (versus the rest of the mREIT sector) was very small (less than 0.5% at the time of sale).
On 11/22/2019, I initiated a position in AAIC's Senior Notes Due 2023 (AIW) at a weighted average purchase price of $24.13 per share ($25 being par). On 3/10/2020, 3/13/2020, and 3/19/2020, I increased my position in AIW at a weighted average purchase price of $23.50, $19.75, and $9.31 per share, respectively. When combined, my AIW has a weighted average purchase price of $14.804 per share. This weighted average per share price excludes all interest received/compounded.
On 12/31/2019, I initiated a position in AAIC's Senior Notes Due 2025 (AIC) at a weighted average purchase price of $24.00 per share ($25 being par). On 3/10/2020 and 3/19/2020, I increased my position in AIC at a weighted average purchase price of $23.72 and $8.71 per share, respectively. When combined, my AIC has a weighted average purchase price of $16.182 per share. This weighted average per share price excluded all interest received/compounded. On 9/2/2020-9/4/2020, I sold my entire AIC position at a weighted average sales price of $23.55 per share. This calculates to a weighted average non-annualized realized gain and total return of 45.5% and 51.1%, respectively. I held this position for approximately 6.5 months.
On 1/2/2020, I initiated a position in AAIC at a weighted average purchase price of $5.57 per share. On 1/9/2020, 3/16/2020, and 9/24/2020, I increased my position in AI at a weighted average purchase price of $5.59, $3.25, and $2.53 per share, respectively. When combined, my AAIC position has a weighted average purchase price of $3.276 per share. This weighted average per share price excludes all dividends received/reinvested.
On 3/18/2020, I once again initiated a position in AGNC at a weighted average purchase price of $7.115 per share (large purchase). This weighted average per share price excludes all dividends received/reinvested.
On 4/6/2020, I initiated a position in CHMI's Series B preferred stock, (CHMI.PB) at a weighted average purchase price of $10.65 per share. This weighted average per share price excluded all dividends received/reinvested. On 6/19/2020-6/24/2020, I sold my entire CHMI-B position at a weighted average sales price of $22.045 per share. This calculates to a weighted average realized gain and total return of 107.0%. I held this position for approximately 2.5 months.
On 10/19/2020, I initiated a position in PMT at a weighted average purchase price of $16.275 per share. On 10/29/2020, I increased my position in PMT at a weighted average purchase price of $14.90 per common. When combined, my PMT position has a weighted average purchase price of $15.358 per share. This weighted average per share price excludes all dividends received/reinvested.
Final Note: All trades/investments I have performed over the past several years have been disclosed to readers in "real time" (that day at the latest) via either the StockTalks feature of Seeking Alpha or, more recently, the "live chat" feature of the Marketplace Service, The REIT Forum (which cannot be changed/altered). Through these resources, readers can look up all my prior disclosures (buys/sells) regarding all companies I cover here at Seeking Alpha (see my profile page for a list of all stocks covered). Through StockTalks disclosures and/or the live chat feature of The REIT Forum, at the end of March 2021 I had an unrealized/realized gain "success rate" of 96.2% and a total return (includes dividends received) success rate of 96.2% out of 52 total past and present mREIT and BDC positions (updated monthly; multiple purchases/sales in one stock count as one overall position until fully closed out). Both percentages experienced a modest increase, when compared to April-May 2020, as a direct result of the recent partial market rally to counter previous fears/panic surrounding the COVID-19 pandemic. In addition, in early April 2020, I initiated several new positions and increased several existing positions at attractive to very attractive prices. Currently, I have only 2 realized "total losses" in any of my past/sold positions (the rest have generated a realized total return). I encourage other Seeking Alpha contributors to provide real time buy and sell updates for their readers which would ultimately lead to greater transparency/credibility. Starting in January 2020, I have transitioned all my real-time purchase and sale disclosures solely to members of The REIT Forum. All applicable public articles will still have my sector purchase and sale disclosures (just not in real time). Please disregard any minor "cosmetic" typos if/when applicable.
I am currently "teaming up" with Colorado Wealth Management to provide intra-quarter CURRENT BV and NAV per share projections on all 20 mREIT and 14 BDC stocks I currently cover. These very informative (and "premium") projections are provided through Colorado's S.A. Marketplace service. In addition, this includes additional data/analytics, weekly sector recommendations (including ranges), and exclusive "rapid fire" mREIT and BDC articles after earnings. For a full list of benefits I provide to the REIT Forum subscribers, please see my profile page.