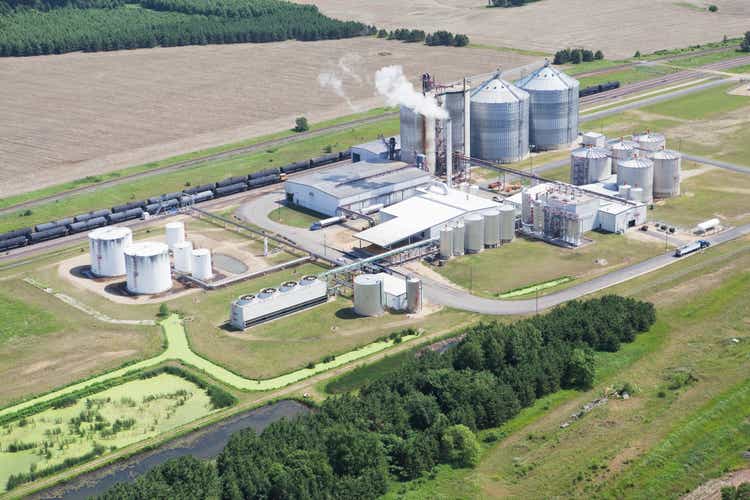
Green Plains Partners: Still Choked In 2021, But 2022 Could See A 10%+ Yield

Summary
- Green Plains Partners has seen a solid start to 2021 but they are still choked by their credit facility repayment terms for the remainder of the year.
- Both their net income and their underlying operating cash flow increased modestly during the first quarter of 2021, thereby supporting finances.
- They are producing ample free cash flow that in theory could easily send their current low distribution yield to a very high-double-digit level of 10% on current cost.
- The only issue prohibiting this is making their choking credit facility repayment installments and even after these, it will still require refinancing or further asset divestitures before year-end.
- Given this mixed situation, I believe that maintaining my neutral rating is appropriate for the time being but it could be upgraded in the future once liquidity risks ease.
Introduction
The small and largely unknown ethanol-focused Green Plains Partners (NASDAQ:GPP) as a Master Limited Partnership would appeal to income investors, if not for their currently low distribution yield of slightly under 4.00%. Whilst this seems rather lackluster, it could easily jump to a very high 10% yield or more on current cost if they successfully navigate their choking credit facility repayments during the remainder of 2021. This article provides a follow-up analysis to my previous article by assessing their progress during the first quarter of 2021, plus their prospects to reward income investors in the following years.
Executive Summary & Ratings
Since many readers are likely short on time, the table below provides a very brief executive summary and ratings for the primary criteria that were assessed. This Google Document provides a list of all my equivalent ratings as well as more information regarding my rating system. The following section provides a detailed analysis for those readers who are wishing to dig deeper into their situation.
Image Source: Author.
Detailed Analysis
Image Source: Author.
Instead of simply assessing distribution coverage through distributable cash flow, I prefer to utilize free cash flow since it provides the toughest criteria and best captures the true impact on their financial position. The main difference between the two is that the former ignores the capital expenditure that relates to growth projects, which given the very high capital intensity of their industry can create a material difference.
It seems they have started off 2021 on a stable footing with not only their net income increasing by 3.50% year on year, but more importantly for income investors, their underlying cash flow performance has also grown modestly. Whilst their operating cash flow of $10.8m during the first quarter of 2021 was down 18.65% year on year versus the first quarter of 2020, this was solely due to working capital movements. Once these are removed, their operating cash flow for the first quarter of 2021 jumps to $12.1m, which represents an increase of 5.28% year on year versus the equivalent underlying results from 2020 of $11.5m that also exclude the effects of working capital movements. Since they sport virtually no capital expenditure, almost all of their operating cash flow was translated into free cash flow.
Given their essentially non-existent capital expenditure since the end of 2018, it only naturally stands to reason that they should see very little free cash flow growth but thankfully they still stand to grow their distributions in the coming years. It seems as though they can consistently produce at least $40m of free cash flow per annum, based upon their historical and recent cash flow performance of $10.6m during the first quarter of 2021. At the moment, their market capitalization is only $291m, which means that if they were to pass along a still safe 75% of their free cash flow at $30m per annum, it would provide a very high-double-digit yield of over 10% on current cost.
This would be a very positive change for their unitholders who have endured a massive 75% reduction to their distributions at this point of time during 2020. Despite the prospects to see their distributions surge again in the future, it would be too optimistic to assume that their former distributions are ever reinstated since they amounted to $45m per annum and even at best consume virtually all of their free cash flow, thereby leaving no margin of safety.
When paying distributions to unitholders, there are two primary elements required with the first being sufficient free cash flow and the second being a healthy financial position. It easily becomes apparent that they have the first element, and thus reviewing their capital structure, leverage, and liquidity will provide insights into when unitholders can expect higher distributions since the latter of the three has previously been quite concerning.
Image Source: Author.
They saw their net debt plunge by a very impressive 35.93% during the first quarter of 2021 but this was not too surprising since it was primarily due to their previously-announced $27m divestiture boosting their free cash flow. This is obviously a significant help but their broader leverage, and more importantly, their liquidity remains critical in determining when unitholders can be rewarded for their patience.
Image Source: Author.
Since their earnings have edged slightly higher and their net debt has plunged, it was only natural to see their leverage continue shrinking lower with their net debt-to-EBITDA now at only 1.12 and standing at the cusp of falling into the very low territory at under 1.01. When looking elsewhere, their gearing ratio also saw a very large improvement but alas still remains above 100% due to their negative balance sheet equity. Thankfully, this is not too concerning since their leverage relative to their earnings is far more important than relative to the accounting value of their net assets. They have ultimately seen improvements across all of the other three financial metrics and this certainly helps them progress towards finally shedding their choking credit facility repayment terms.
Image Source: Author.
The hurdle from their previously-mentioned credit facility that houses all of their debt and unfortunately matures in December 2021 is easily visible in their liquidity with a very low current ratio of only 0.19. They are required to make monthly repayments up until maturity of $3.2m, which are effectively consuming essentially all of their free cash flow after distribution payments, thereby choking their finances and ability to reward their unitholders.
Admittedly, their $27m asset divestiture has brought them some time but they still have an outstanding debt balance of $61m. Even with free cash flow of approximately $10m to $12m per quarter, they cannot repay all of this before maturity without either refinancing further divestitures or possibly their parent company, Green Plains (GPRE), providing fresh equity that would dilute current unitholders.
At the end of the day, only time will tell exactly how they handle this situation, but somewhat disappointingly, they seemingly provided no guidance within their first quarter of 2021 results announcement. Whilst it would be surprising to see an organization with such low leverage face any issues remaining a going concern, it should be remembered that very short-term upcoming debt repayments are always important and should not be underestimated nor forgotten.
Conclusion
Their unitholders are facing a double-sided situation; on one hand, they are producing ample free cash flow to send their distributions, and thus, their unit price soaring, but on the other hand, their debt repayments are still choking them throughout 2021. If they can successfully navigate 2021, they should enter 2022 with little to no leverage, adequate liquidity, and thus no restrictions on rewarding their unitholders. Given this mixed picture, my neutral rating is being maintained, but at the same time, as the year progresses, they are going to become increasingly attractive as risks subside, and thus, this could easily change to a bullish rating in the future.
Notes: Unless specified otherwise, all figures in this article were taken from Green Plains Partners’ Q1 2021 8-K, 2020 10-K, and 2018 10-K SEC Filings, all calculated figures were performed by the author.
This article was written by
Analyst’s Disclosure: I/we have no positions in any stocks mentioned, and no plans to initiate any positions within the next 72 hours. I wrote this article myself, and it expresses my own opinions. I am not receiving compensation for it (other than from Seeking Alpha). I have no business relationship with any company whose stock is mentioned in this article.
Seeking Alpha's Disclosure: Past performance is no guarantee of future results. No recommendation or advice is being given as to whether any investment is suitable for a particular investor. Any views or opinions expressed above may not reflect those of Seeking Alpha as a whole. Seeking Alpha is not a licensed securities dealer, broker or US investment adviser or investment bank. Our analysts are third party authors that include both professional investors and individual investors who may not be licensed or certified by any institute or regulatory body.