
Investment Thesis
This article will take a look at Aberdeen Total Dynamic Dividend Fund (NYSE:AOD). I own Aberdeen Global Premier Properties Fund (AWP) and very much like the management team for that CEF. So I took a look at AOD since I think that management skill is very important to CEF performance. NAV has increased since the distribution was right-sized in 2013. The distribution is well covered and has seen a couple of small bumps in the last 7 years.
I want to own CEFs that pay me a stable flow of income. I have developed a method of determining whether a specific CEF could provide a reliable stream of income. I developed my method after reading this article. My thinking is that rather than the share price, how the portfolio of the fund behaves and the income it generates is the determining factor in the reliability of the distribution. I look at a specific CEF and apply that method to determine if the fund has been supporting the distribution. Then based on current holdings and past performance, I try to determine whether or not the fund will be able to support the distribution in the future. You can read an explanation of my method and get links to the other articles in the series here.
Aberdeen Total Dynamic Dividend Fund
As usual, I will begin my analysis by looking at how the returns on AOD's portfolio were over the last year. So how did AOD do?
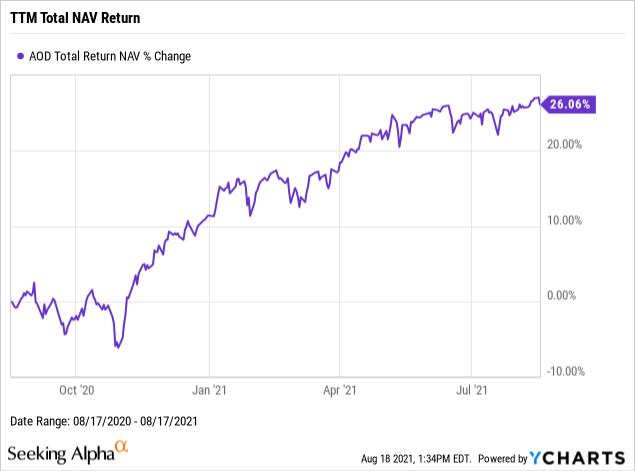
26% returns are quite impressive, even more so had the last year been a normal year. But the COVID crash at the beginning of 2020 set up a very low price as a base, so it's possible that a too-generous distribution might not be fully covered. Next, let's look at NAV and how it did over the last 12 months.
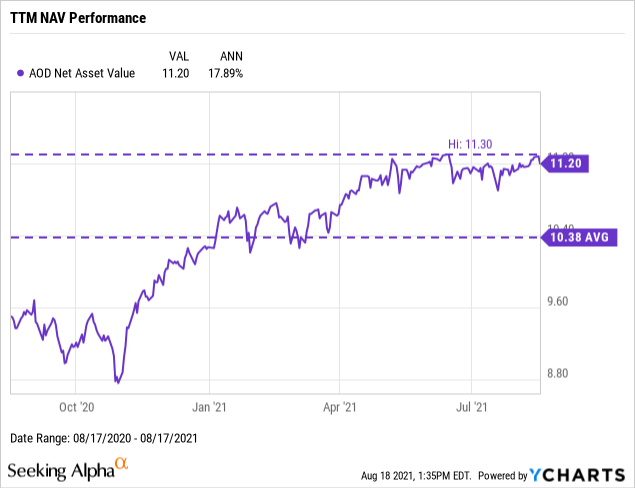
Growing NAV by almost 18% is pretty good. It is also evidence that the distribution was covered over the last 12 months. Next, let's look and see what the distributions were and what they might tell us.
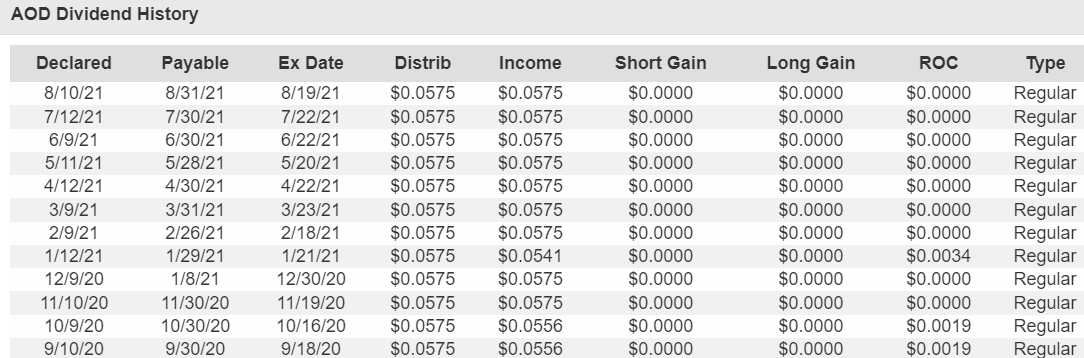
Source: CEFData
Two good signs here. First, no distribution cut during the worst of the COVID crash. Second, very little of the distribution was designated as ROC. A small amount of ROC means at worst only a small amount of destructive ROC.
Over the last 12 months, the distributions have totaled $0.69. Using the average NAV over the last year, $10.38, I calculate the yield on NAV to be 6.65%. Using the peak NAV of $11.30, the yield on NAV works out to be 6.11%. Since both yield on NAV figures are significantly lower than the 26.06% total NAV return, and NAV increased during the last 12 months, I judge that the distribution was well covered over the last year.
Long-Term Trends
I next like to look at longer-term trends before projecting out whether the fund will continue covering the distribution because a single year's performance can be too strongly influenced by luck or timing. And the COVID crash and recovery certainly offer plenty of both. So first, I want to check whether or not the fund, on average, covered its distribution over the last 3 years. The first step in that process is to look at the returns its portfolio generated.
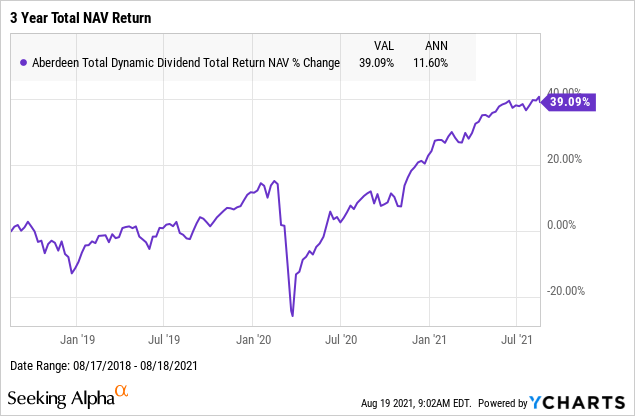
Returns of just over 39% for the 3 year period or a 3-year CAGR of 11.6% is pretty good. Looking at the trend from 2019, the latest results look to be in line as well. But let's next look at how the NAV did.
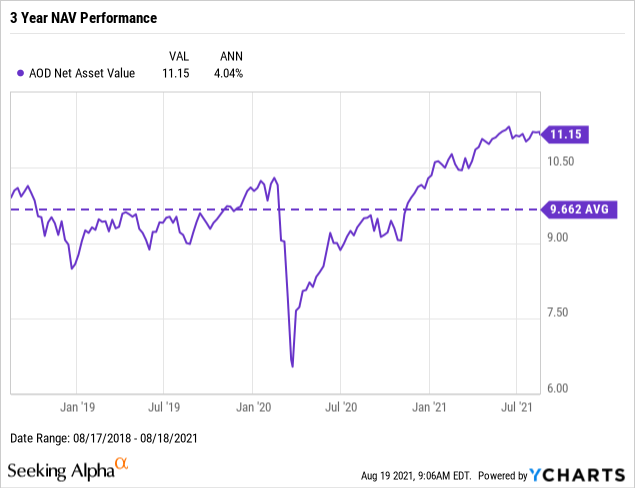
For the distribution to be covered, I want to see that NAV was flat or trending upwards. Prior to COVID, NAV looks fairly flattish, but that is okay. 4% per year on average is pretty good and gives us some evidence that the distribution was well covered. Let's see how the yield on NAV compares to the total NAV return over the last 3 years.
Over the last 3 years, the distribution was unchanged at 5.75 cents a month. And only a small portion of that was designated as ROC. That is both good and bad. With very little ROC, there is little tax benefit from the ROC being tax-deferred. But on the other hand, with very little ROC, the maximum amount of destructive ROC is also very small.
Total distributions over the last 3 years were $2.07. Using the average NAV during the last 3 years of $9.662, I calculate that the yield on NAV was 21.42% (not an annual number) or about 7.14% per year on average. Both numbers are well below the corresponding total NAV returns. Based on that and the NAV history, I judge that over the last 3 years that the distribution was well covered.
With a well-covered distribution and no distribution cuts over the last 3 years, AOD is doing what I want in a CEF. So the yield of more than 7% is looking even more attractive. But let's next look at how NAV has performed over the last 10 years, to get a final check on past performance.
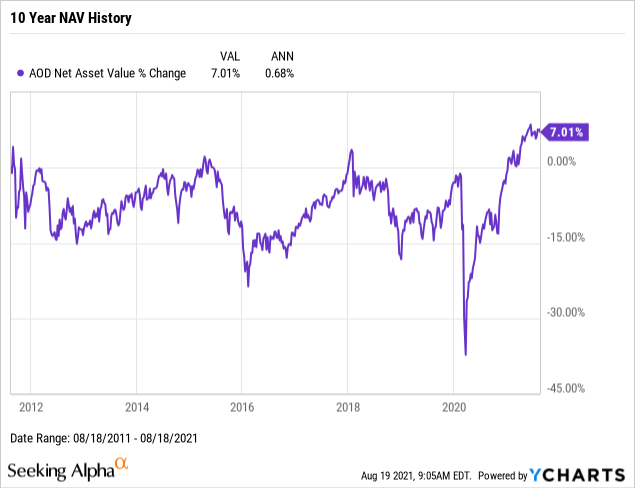
Well, NAV is pretty flat here. And that is okay, but the small gains give a smaller cushion. ****
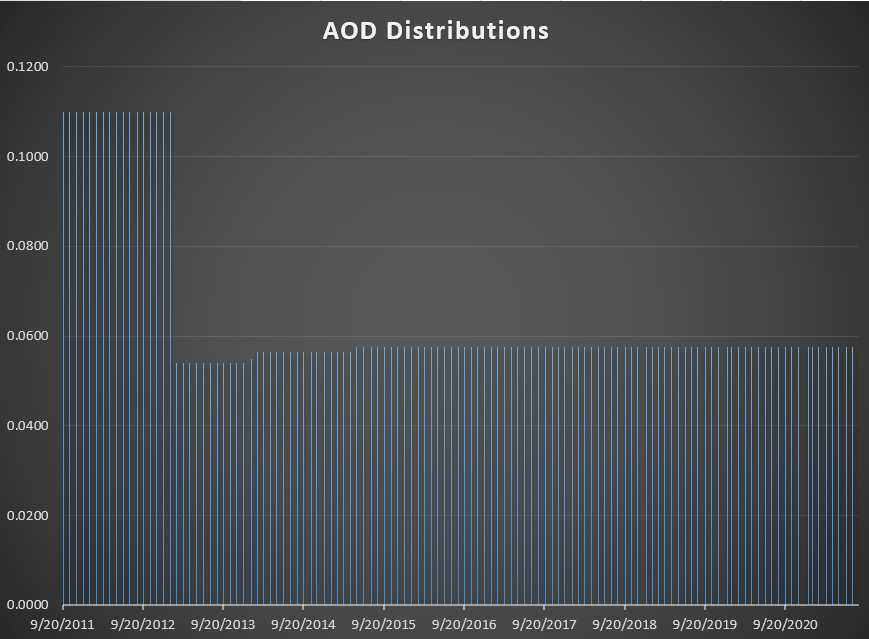
Source: CEFData
No way to sugarcoat it, but at the start of 2013, AOD has a pretty large distribution cut from 11 cents a month to just 5.4 cents. But prior to that cut, the fund was seeing declining NAV. This was likely due to overpaying the distribution. And while I don't like distribution cuts, I like overpaying the distribution even less. And after that cut, NAV began increasing and the distribution saw two small bumps as well. It looks to me like the cut at the start of 2013 right-sized the distribution. Which is exactly what I want management to be doing.
Future Distribution Coverage
While it is a good thing that AOD has covered their distribution for many years now, what matters most is whether or not they will continue to be able to do so. I want a reliable income from each of my holdings, so future distribution coverage is important. Since AOD has been covering the distribution, it should be easier to keep doing so. So what I want to look for is anything that might have provided an important source of income for the fund in the past that can't be counted on delivering in the future.
Looking at the fund's holdings, as published in the latest monthly factsheet, I find a number of items of interest. One metric I found quite interesting is called Active Share. In the debate over which is better, active management or passive index following, the performance of actively managed funds is skewed by the inclusion of funds that claim to be actively managed but differ very little from the index they use as a benchmark. Active share measures how much of a fund's holdings differ from the index it uses as a benchmark. An Active Share score of 0 indicates a fund that has holdings that perfectly match the index, while a score of 100 indicates a fund with no holdings in common with its benchmark. As of the end of June 2021, AOD had an Active Share score of 81.01.
Source: AOD June 30 Factsheet
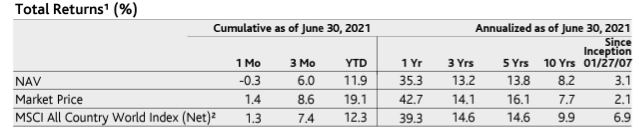
Above we can see some performance numbers that the fund presents. One thing to remember when comparing an index to a fund is that the fund's results are net of fees. Also remember, that the fund's job here is to turn total return into regular income and that this is not a perfectly efficient process. So what are the fund's fees?
Source: AOD June 30 Factsheet
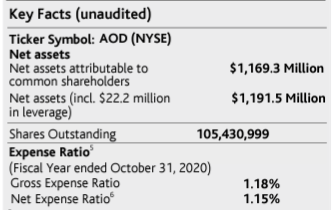
The net expense ratio is fairly modest, for a CEF anyway, at 1.15%. This is currently reduced by some fee waivers. Subtracting the fee from the index performance, I see no significant underperformance from AOD in the last 10 years. Given the good and steady distribution since the cut in 2013, I am happy with the fund's performance versus the index. It doesn't look to me like the fund's fees and its need to produce regular distribution payments have been or likely will be a drag on its performance in generating income.
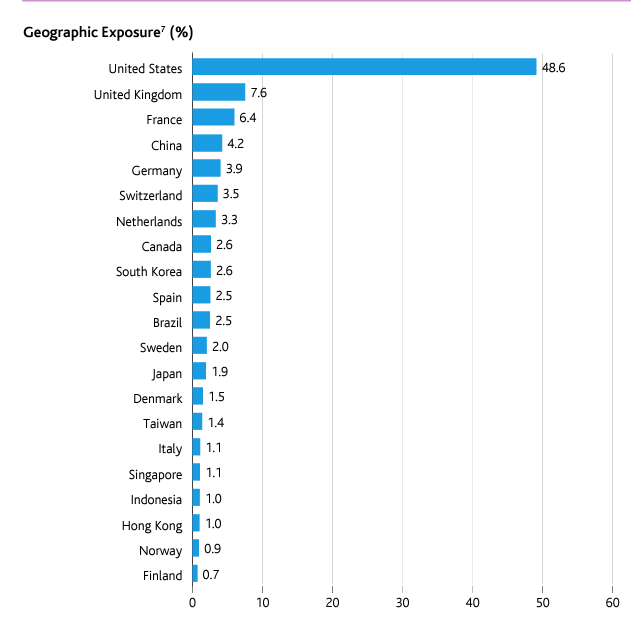
AOD has international holdings, but it is very much concentrated in the U.S.
Source: AOD June 30 Factsheet
While China, Hong Kong, and Taiwan represent 6.6% of the portfolio, I am not overly concerned with that at this time. Unrest in Hong Kong might cause some problems, but that is only 1% of the portfolio. Given recent events in Afghanistan, some are worried that China may escalate its issues with Taiwan. Right now I think China will just increase the confrontational tone of its rhetoric, but that area should be monitored for further developments.
Source: AOD June 30 Factsheet
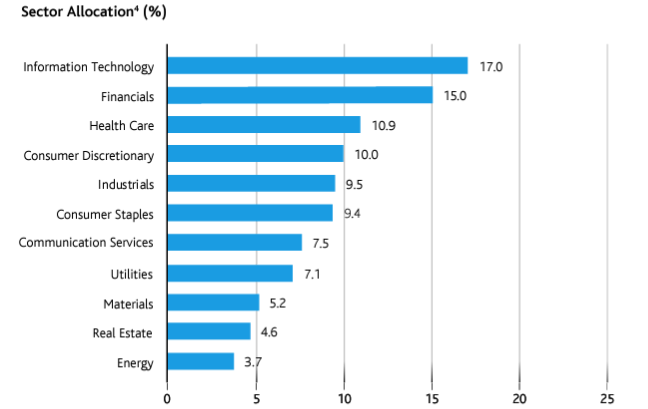
The sector allocations all look good to me. I expect plenty of growth in the top 3: IT, Financials, and Health Care. While at a lower concentration, Utilities, Materials, and Real Estate should also provide some protection from inflation. Energy has been a regular disappointment, but going forward I don't think it will do any worse than it has over the last 5 years.
Source: AOD June 30 Factsheet
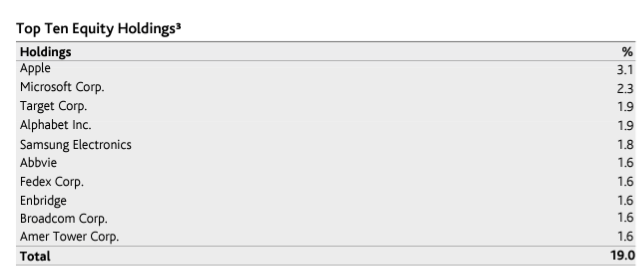
In the Top 10 holdings, I don't see any red flags either. Several of the FAANG stocks are there. Even Target (TGT), while it is in retail, should do okay. Enbridge (ENB) is also one of the better MLPs in the energy/pipeline sector.
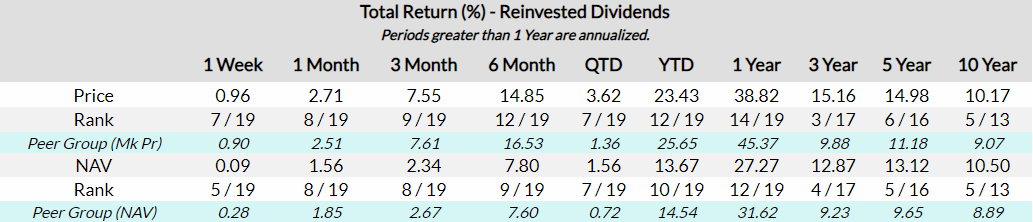
Source: CEFData
Comparing AOD to its peers, the fund has done well over the 10, 5, and 3 year periods. On both price and NAV return, while not at the front, it is near the front and better than the average. It has lagged behind its peers over the last year, but that is more due to the big gains its peers have seen rather than poor performance on the part of AOD.
I don't see any reason why AOD should be unable to continue to cover the dividend. It has a pretty good cushion, particularly this last year.
Conclusion
I took a look at AOD because I own another fund, AWP, managed by Aberdeen. For AOD, I think the 6.7% yield is attractive given that the distribution is well covered. Once the fund got the distribution to the right level, it has had several modest increases. That is what I am looking for in a CEF. Given the current upward trend in NAV, I think the price today is a good value.
High Dividend Opportunities Asks, Are You Feeling Lucky?

You don't need luck to see success, but being part of the largest and most exciting community of income investors and retirees vastly improves your chances. Our Income Method generates strong returns, regardless of market volatility, making retirement investing simple, straightforward, and less stressful!
Invest with the Best! Join us for instant access to our model portfolio targeting +9% yield, our bond and preferred stock portfolio, and income tracking tools. Don't miss out on the Power of Dividends! Start your free two-week trial today!