
Thesis
The Global X NASDAQ 100 Covered Call ETF (NASDAQ:QYLD) follows a covered call strategy on the Nasdaq 100 Index to collect premiums and provide high current income distributions. The fund provides a very appealing combination of two desired traits for income investors – high yield and monthly distributions. The current income distribution yield is near 10% and made monthly.
My last article performed a comparative analysis of this fund to other similar funds, including the Nuveen Nasdaq 100 Dynamic Overwrite Fund (QQQX) and the Gabelli Equity Trust (GAB). These funds follow a similar underlying strategy but offer different combinations of current income vs capital appreciation potential. So potential investors could be more informed when choosing the right fund.
Given the income generation nature of this fund, this article furthers the analysis by benchmarking its yield against a high yield bond rate. The results show that its spread yield relative to high yield bond is currently at the widest level by historical standard. Such a wide spread, combined with its relatively stable dividend distribution, makes this fund a very attractive alternative to high yield bonds for income-seeking investors.
Basic information and recap
Most of the detailed information has been covered in my earlier article and won't be the focus today. Here we will just briefly recap the most relevant information for readers new to the fund to facilitate the new analysis. The fund holds ~100 companies with a total asset of over $3.4B. And it charges a 0. 6% expense ratio. As highlighted in the red box below, the current income distribution yield is about 10% and made monthly. Its asset consists of holdings that are identical to the NASDAQ 100 index, and “covered called” based these holdings, as elaborated below.
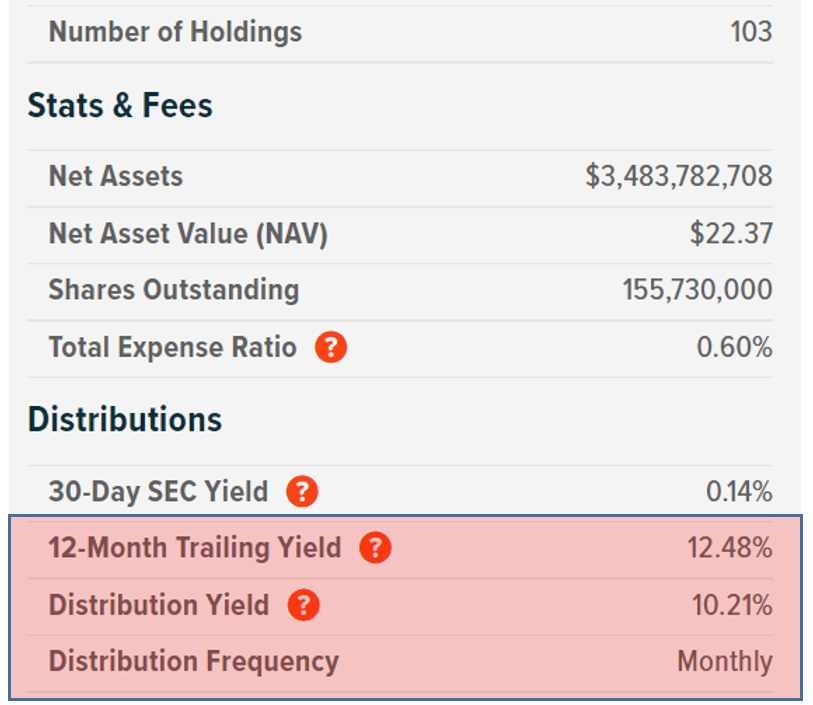
Source: Global-X Fund description
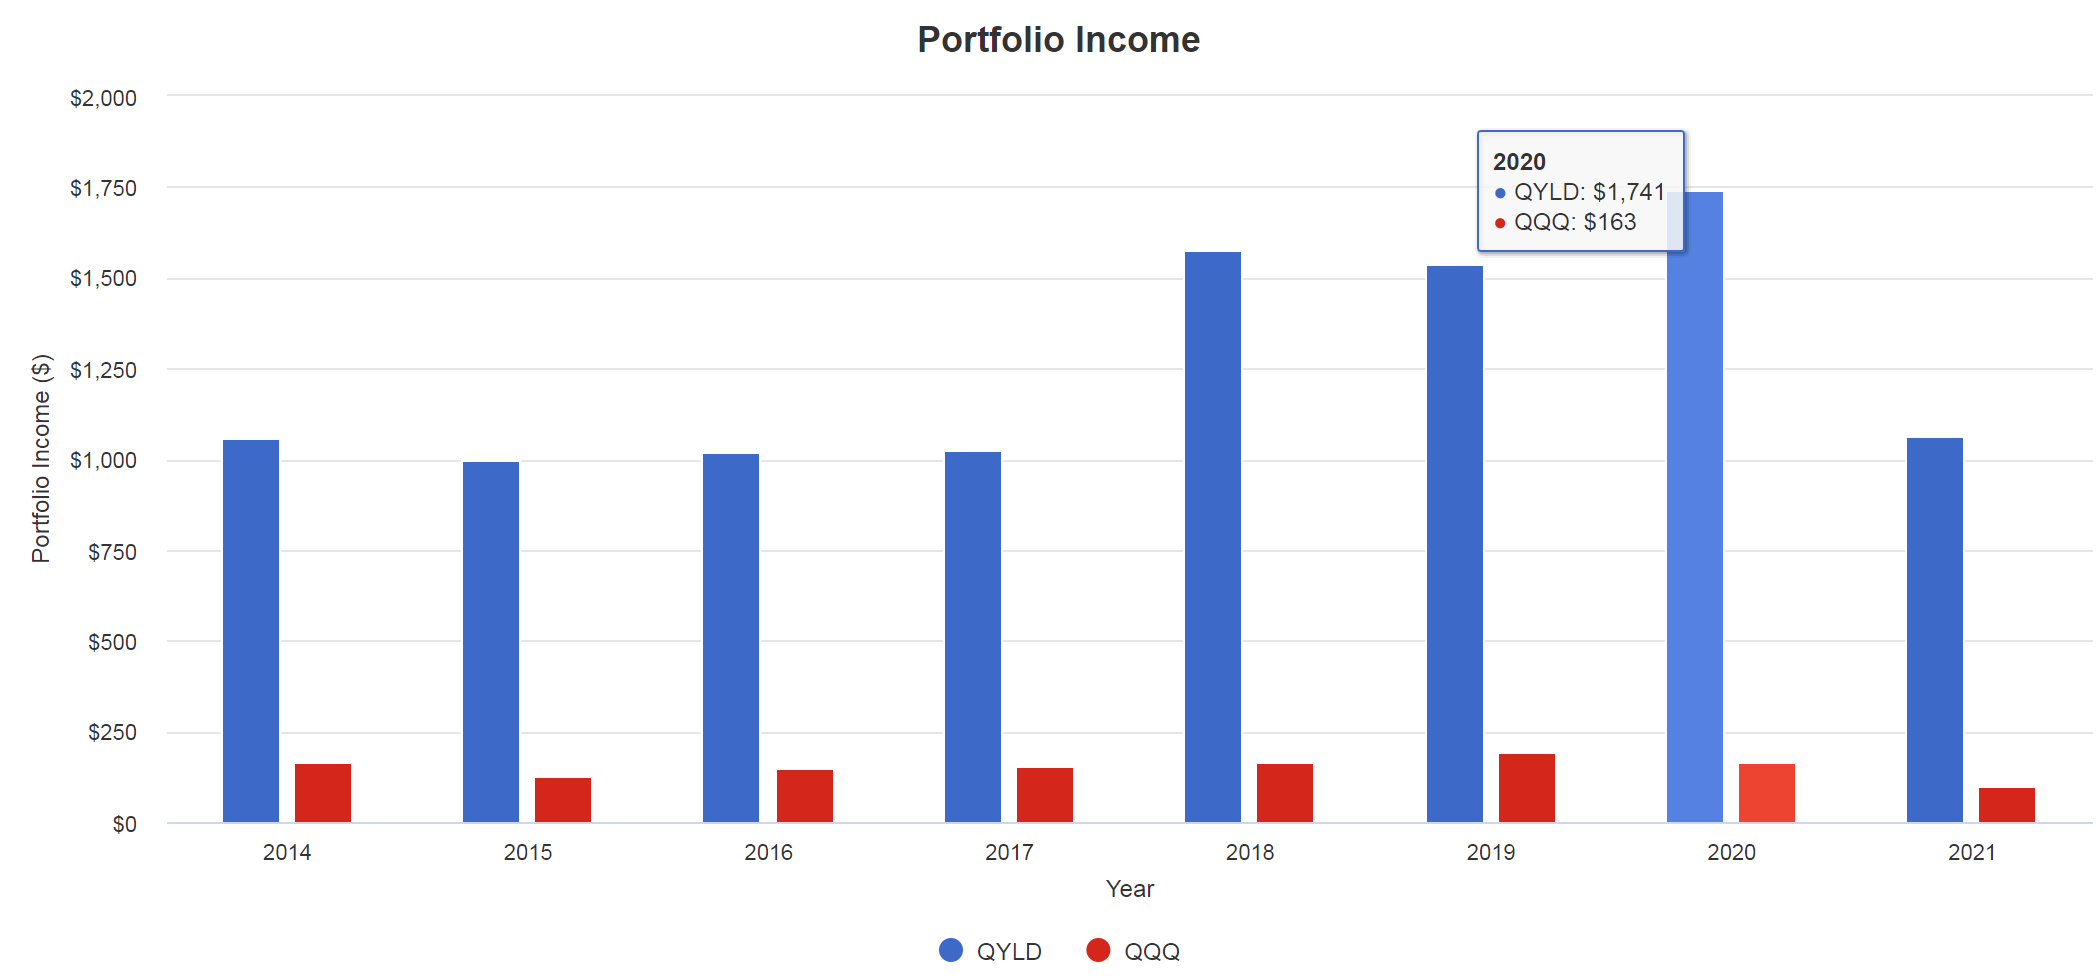
As can be seen from the following chart, the QYLD fund indeed provided consistently high dividend income relative to the underlying index (represented by QQQ) since its inception. Its dividend started around 10%, and has been maintained consistently above that level since then. In 2020, the distribution was more than 10x of that from the underlying QQQ – and readers who are not familiar with writing calls may be wondering how this is possible.
Writing a call is similar to selling an insurance policy in a certain way. The similarity is that the seller (the QYLD fund in this case) receives a given amount of premium payment upfront - which is the total potential gain that can be achieved should the calls expire worthless. And in a nutshell, the premium received upfront is how/why the fund can keep paying high distributions consistently.
Before leaving this part, it is important that I explicitly clarify that selling a call is NOT the same as selling an insurance policy. The only similarity intended in this analogy in this article is the aspect that they both receive a premium paid upfront.
Source: Author, with simulator from Portfolio Visualizer, Silicon Cloud Technologies LLC
QYLD yield Vs. high yield bond rate
In my last article, I described a method to compare the yield of QYLD against the 10-year Treasury rate. One good comment received from my previous article is to extend the method to a high yield index given the high yield nature of QYLD. The suggestion obviously makes excellent sense. The yield spread relative to the 10-year treasury represents the risks premium of QYLD relative to a risk-free investment. And the yield spread relative to a high yield index tells us the risks premium relative to corporate bonds. So these two analyses would provide complementary information.
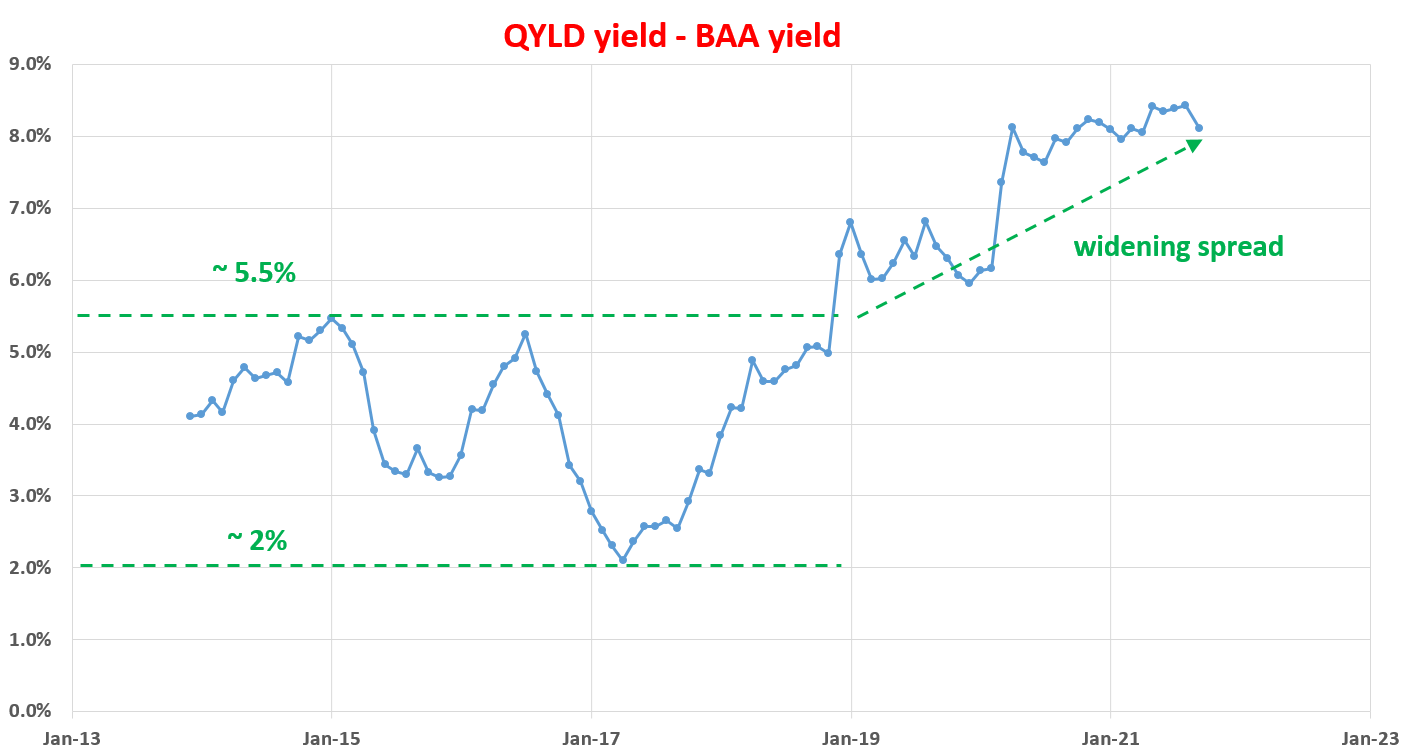
With the above background, this article uses Moody's Seasoned BAA Corporate Bond Yield (referred to as the BAA bond yield hereafter) to benchmark the yield of QYLD. The next chart shows the yield spread of QYLD relative to Moody's Seasoned Baa Corporate Bond Yield. The yield spread is defined as the TTM dividend yield of QYLD minus the BAA bond rate. As seen, the yield spread is bounded and tractable until 2019.
Before 2019, the spread has been in the range between about 2% and 5.5% the majority of the time. Suggesting that when the spread is near or above 5.5%, QYLD is significantly undervalued relative to corporate bonds in general (i.e., I would sell BAA corporate bond and buy QYLD). And when the yield spread is near or below 2%, it means the opposite. The fundamental reason is that the yield spread measures the risk premium investors are willing to pay for QYLD relative to other assets such as BAA bonds.
Such bounded and tractable behavior certainly makes sense for a fund like QYLD as in many cases I’ve analyzed before. After all, a fund like QYLD ultimately depends on the credit and solvency risks of the corporations in the fund. And as such, the return of the fund should not stray too far away from the underlying credit risks of these corporations – which are reflected in their bond rates.
However, since 2019, the yields spread has broken out of the above range and has been steadily increasing since then as seen. My theory for such widening spread is the interferences of the Fed (or the increased level of interference) started at that time. Such interferences have steadily driven down the yield of corporate bonds. As a result, the market is willing to accept a very low yield from corporate bonds and the yield spread between QYLD and the BAA rate has widened to a historically high level as shown, above 8%.
Source: author based on Seeking Alpha and FRED data
Based on the above understanding, the yield spread relative to the BAA corporate bond yield could be used to gauge the risks of investing in the fund in the near to mid-term, as shown in the next chart.
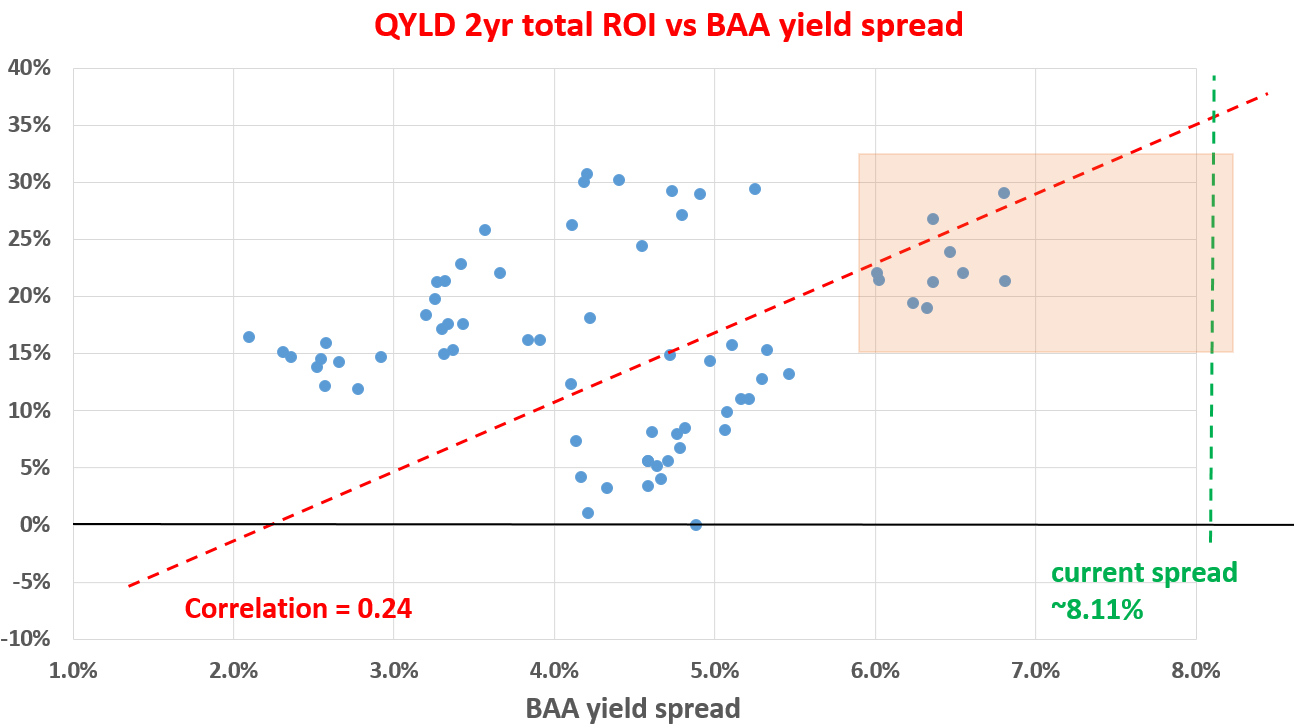
The next chart shows the next 2-year total return on QYLD (including price appreciation and dividend) when the purchase was made under various yield spreads relative to the BAA bond. As can be clearly seen, first again there is a positive trend, indicating that the odds and amount of the total return increases as the yield spread increases. The correlation coefficient is 0.24, suggesting a positive but moderately strong correlation. Particularly as shown in the orange box, when the spread is about 5.5% or higher as mentioned above, the total returns in the next 2 years are all positive and have been all quite large (all above about ~20% to almost 30%).
As of this writing, the yield spread relative to BAA is 8.1% as shown, close to the widest level of the historical spectrum, suggesting very manageable near-term risks (at least relative to BAA corporate bond). Such a wide spread, combined with its relatively stable dividend distribution, makes this fund a very attractive alternative to high yield bonds for income-seeking investors.
Source: author based on Seeking Alpha and FRED data
Conclusions and final thoughts
The Global X NASDAQ 100 Covered Call ETF follows a covered call strategy on the Nasdaq 100 Index to collect premiums and provide high current income distributions. My last article focused on a comparative analysis of this fund to other similar funds, so potential investors could be more informed when choosing the right fund.
This article focuses on benchmarking its yield against a high yield bond rate. Given the income generation nature of this fund, this article analyzes its yield against Moody's Seasoned BAA Corporate Bond Yield. As of this writing, the yield spread relative to the BAA yield is 8.1%, close to the widest level of the historical spectrum, suggesting very manageable near-term risks (at least relative to BAA corporate bond). Such a wide spread, combined with its relatively stable dividend distribution, makes this fund a very attractive alternative to high yield bonds for income-seeking investors.