
The buy thesis
Alexandria Real Estate Equities (NYSE:ARE) is a pure-play on life science properties in the biggest research markets. The low vacancy and scarcity of institutional grade research properties affords ARE the ability to raise rents substantially in the coming years. In addition to organic growth, ARE has a large pipeline of well-located developments that will be delivered in the coming years and likely lead to substantial FFO/share growth. Relative to its growth, the multiple looks quite reasonable making ARE a solid opportunistic investment.
Historical success - fundamental and market price
As a value focused investor, Alexandria’s chart makes it difficult for me to get excited.
 Source: SA
However, after digging further into ARE’s growth, I believe the price gains were fully supported by fundamentals.

In fact, FFO/share growth has actually outpaced the impressive share price gains such that ARE actually is trading toward the cheaper end of its normal multiple range. Shown below is ARE’s trailing FFO multiple over the past five years.
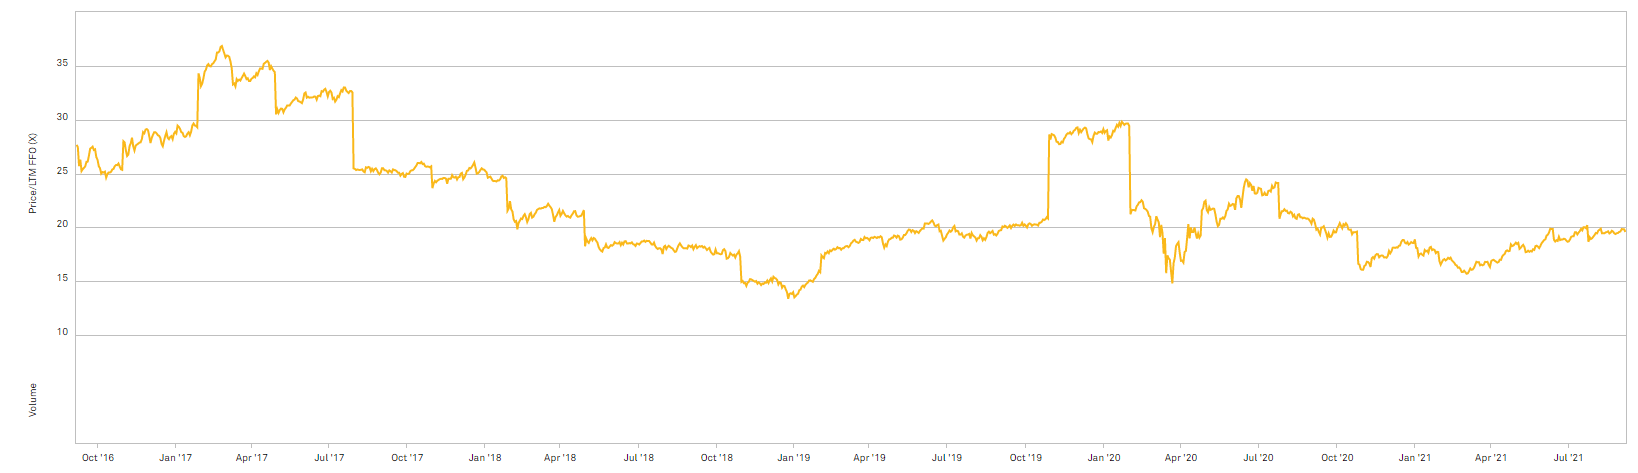 Source: SNL Financial
Over this same five-year period the multiple of the broader market has expanded significantly, such that on a relative basis ARE is cheaper than normal.
So while the chart may look expensive, this may be an OK time to get into a perennial winner. I believe ARE has a number of fundamental factors that will drive its continued success and in particular this article will examine:
- Organic growth at existing properties
- Capital recycling opportunities
- Development pipeline
Organic growth
R&D budgets have broadly been increasing and particularly in the pharmaceuticals and clinical research areas. Lab space is crucial to these R&D programs which makes them generally sticky tenants. The same store NOI growth at Alexandria demonstrates the high demand for these properties.
 Source: SNL Financial
5% or so same store NOI growth doesn’t really tell the whole picture though. Since lease terms are so long, only a small portion of leases are coming due in any given year as seen below.
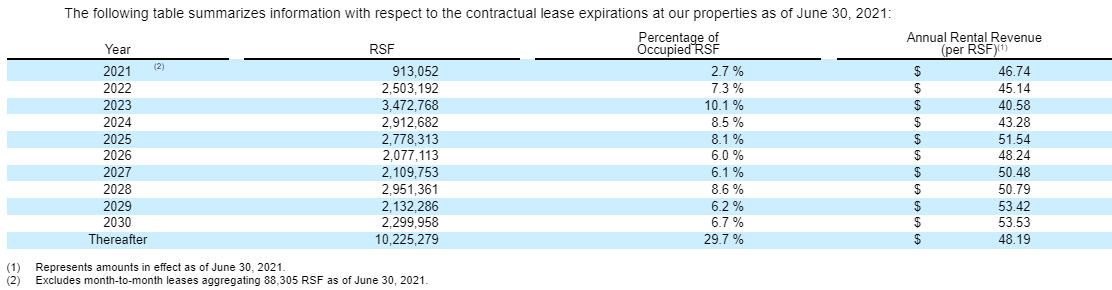 Source: 10-Q
Thus, getting 5% same store NOI growth is not a rental rate increase of merely 5%. The bulk of the same store NOI growth comes from the small percentage of properties that roll over in a given year, and these rolls have been huge.
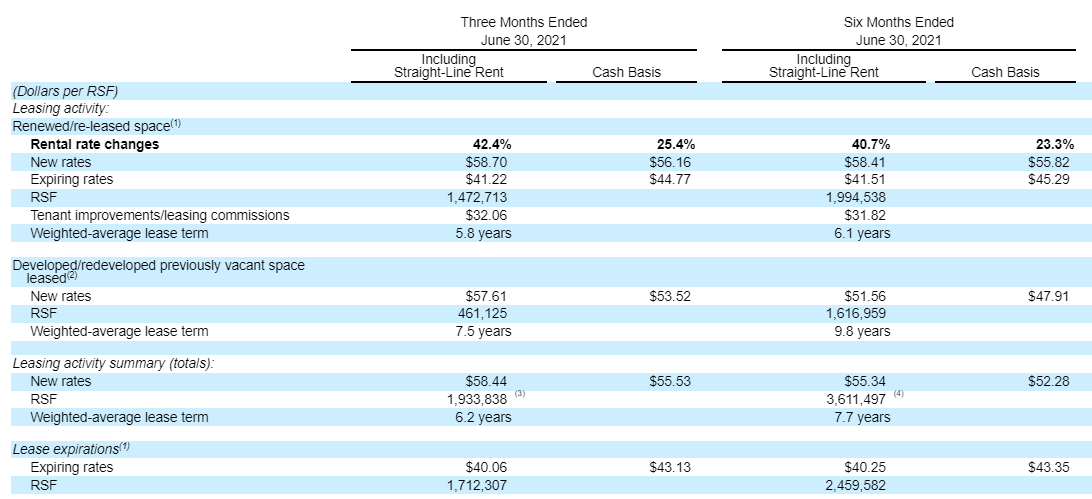 Source: 10-Q
Expiring rents this year have average $41.51 and the space got re-leased or renewed at an average of $58.41 for a GAAP rent increase of 40.7%.
Well, during the next 15 years, these rental rate increases are likely to roll across the entire portfolio. Because of the long lease terms, ARE’s current rents are substantially below market with most of their leases in the $40s. This builds in a baseline same store NOI growth as leases roll.
Developments
One of the challenges for many REITs is that as cap rates have fallen across just about every property sector it's harder to source accretive acquisitions. ARE can largely circumvent this problem as its land bank provides a massive development pipeline.
Specifically, ARE has 21.45 million square feet in current or future development.
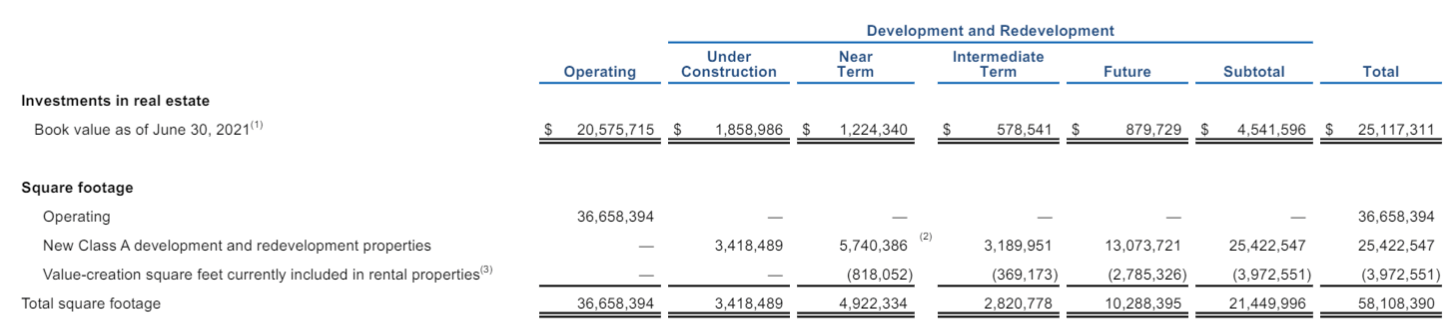 Source: Supplemental
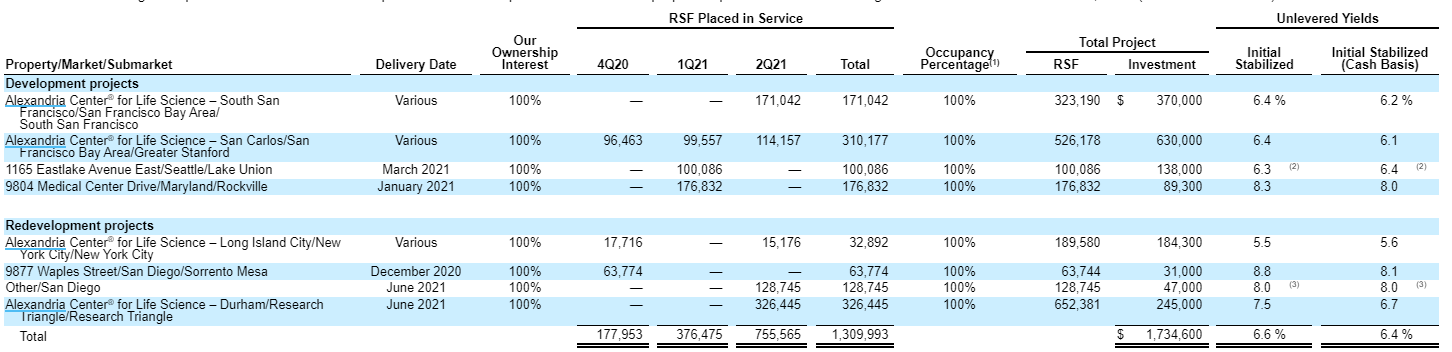
In the 10-Q, ARE tabulates its recent and near term development deliveries.
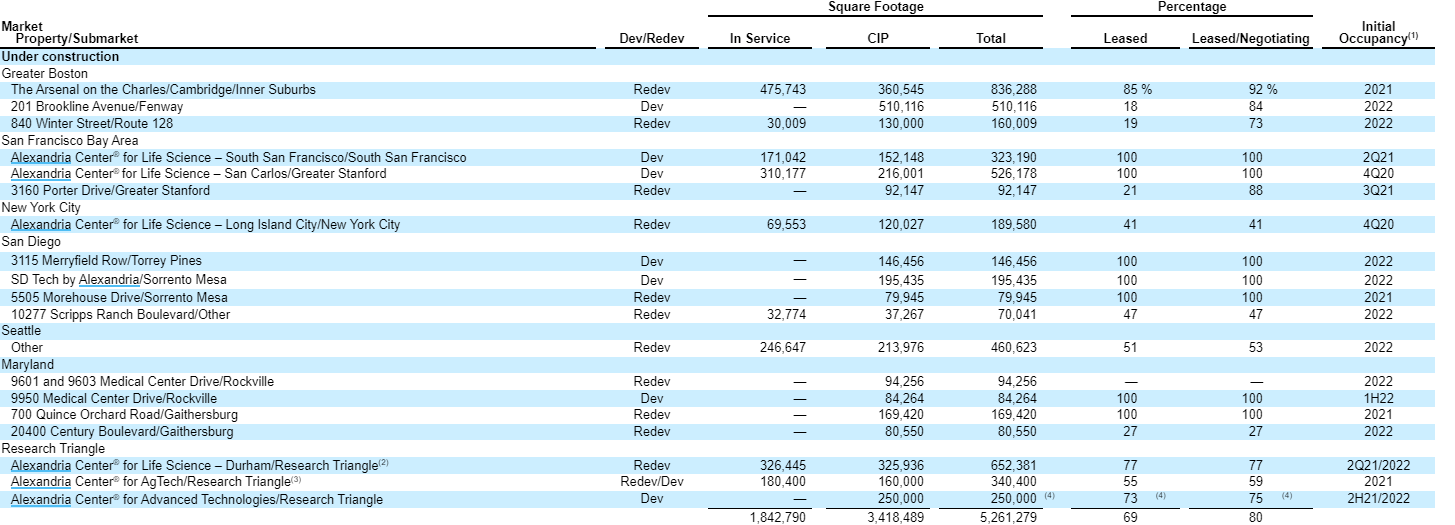 Source: 10-Q
Among those that have completed, the cap rate is sitting at an average of 6.6% (GAAP).
 Source: 10-Q
I would anticipate a similar cap rate for the remaining developments.
21.45 million square feet of development is quite a large volume considering ARE’s operating portfolio is 36.6 million square feet.
Not many REITs have a development pipeline that approaches 60% the size of their operating portfolio. So how is ARE going to fund all of this?
Recycling opportunity and low cost of capital
In the short term, ARE has access to liquidity on demand due to its investment grade rating.
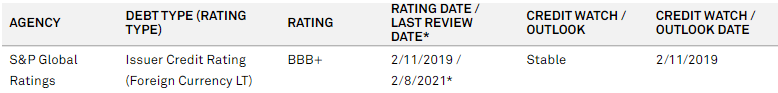 Source: SNL Financial
However, if they were to fund the entire pipeline with debt that would ruin their ratios and the investment grade rating would go away, so ideally there would be an equity component to the financing.
For equity ARE has two options and I suspect they will use both:
- Equity issuance - At a multiple of 24.3X forward FFO, its equity cost of capital is just over 4% so issuing stock to develop at a 6.6% cap rate is substantially accretive to FFO/share.
- Capital recycling
The beauty of development is that there's usually a spread between development cap rates and going market cap rates on finished properties. This spread is exaggerated for ARE because it already owns the land bank and already has much of the zoning/entitlement out of the way.
The going cap rate for high quality life science properties seems to be in the 4% to 5% range. Ventas (VTR) recently acquired a roughly $1B portfolio in San Francisco at a 4.9% cap rate with the details listed below.
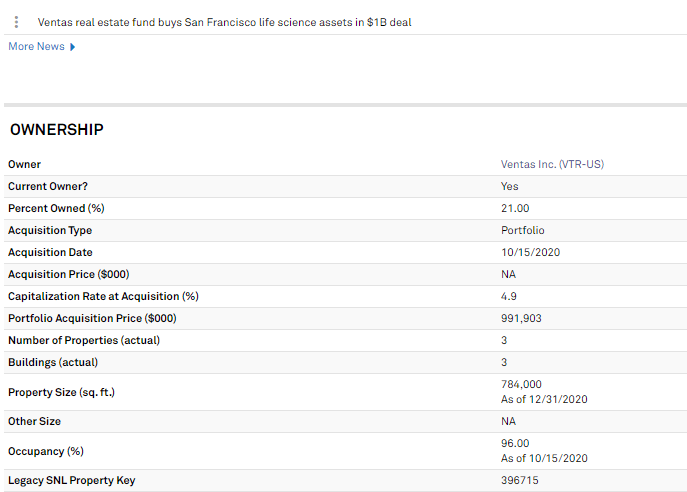 Source: SNL Financial
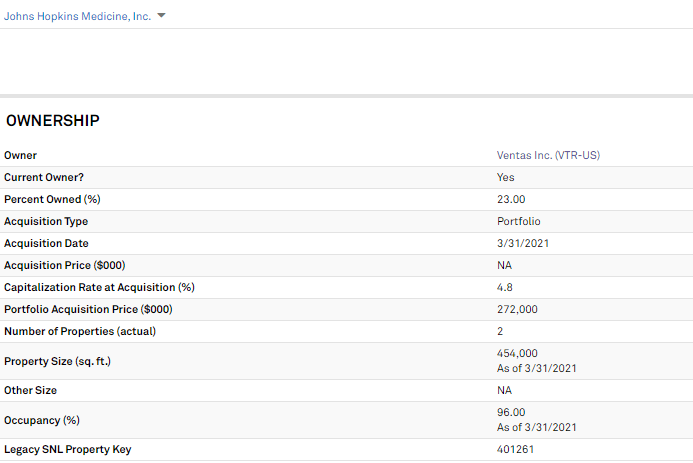
In March, Ventas bought some research facilities at Johns Hopkins at a 4.8% cap rate.
 Source: SNL Financial
The caliber of properties Ventas was buying is quite high which is part of the reason for the low cap rates, but ARE also is developing trophy level assets in the premier research locations of the U.S.
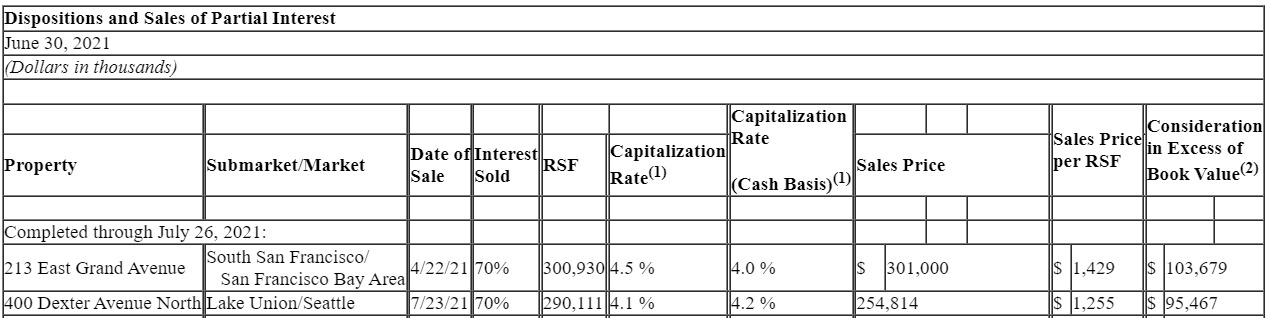
So far in 2021, ARE has sold about $555 million worth of properties at a weighted average cap rate of about 4.3% GAAP and 4.1% cash.
 Source: Earnings release
Price per foot for these two properties was $1,429 and $1,255, marking this as some of the highest price per foot real estate I have come across. The low cap rate and high price per foot are reflected in ARE’s gain on sale of close to $200 million across the two properties.
Overall, these avenues of financing in combination with the massive development pipeline create a long runway of growth.
Equity financing in the low 4’s or property sales in the low 4s in combination with cheap debt in the 2% to 3.5% range makes development in the mid 6s very accretive.
This roughly 200 basis point positive spread on billions of dollars of future developments from its landbank is substantial growth.
This development growth should sum nicely with the aforementioned same store NOI growth for overall FFO/share growth.
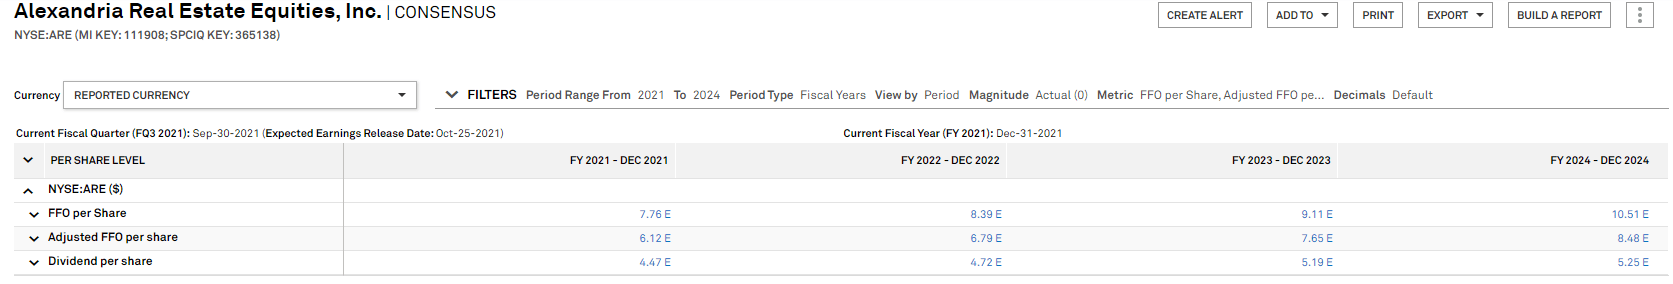
Presently, consensus estimates have ARE growing from $7.76 of FFO in 2021 to $10.51 of FFO in 2024.
 Source: SNL Financial
Given these underlying drivers that number seems entirely plausible to me.
Given this growth rate is ARE undervalued?
From a FFO multiple standpoint, the valuation seems quite reasonable to me. ARE’s 24.3X forward FFO multiple is just a hair above that of the REIT index, but ARE is growing substantially faster than the index.
The large delta in growth easily outweighs the small delta in multiple.
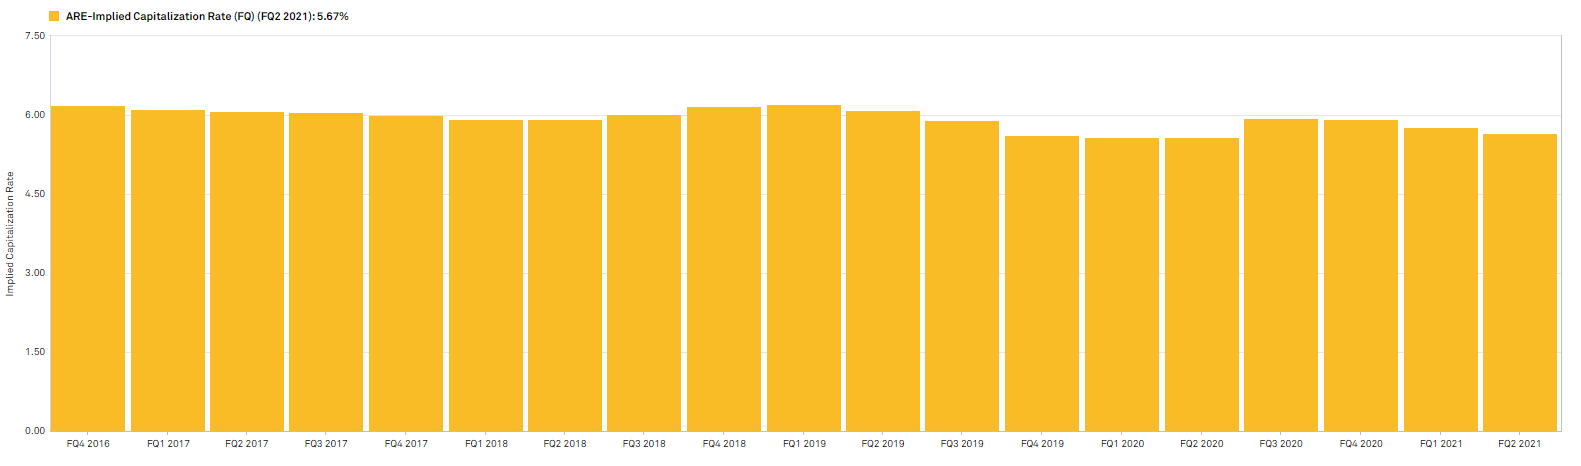
A valuation angle that I think is being overlooked by the market is the asset value discount. ARE is trading at an implied cap rate of 5.67% and this cap rate has been largely consistent over the past five years.
 Source: SNL Financial
Over this time period, however, cap rates on the types of research properties ARE owns have fallen quite substantially and now seem to be in the 4%-5% range as discussed above.
Thus, at a 5.67% implied cap rate, ARE is trading quite cheap relative to the value of its assets. Further, implied cap rates such as this one are based on historical NOI, so it's not giving any credit to the value of ARE’s land bank which is not presently generating NOI.
Between the cap rate spread and the extra land value, I believe ARE is trading well below the value of its assets.
Risks to ARE
R&D spend is perhaps higher than normal right now as a result of a few factors:
- Pandemic related medicine research (Moderna (MRNA) is a big tenant of ARE)
- Easy money from both fiscal and monetary policy
- Generally generous research grants from the government
With this heavy R&D spend, demand for lab space is very high, so the risk to ARE is that some of these factors abate and R&D spend drops. In theory, a drop in R&D spending would reduce demand for ARE’s properties.
Wrapping it up
Overall ARE strikes me as a great company trading at a reasonable price. It has a long track record of value creation and the fundamentals are in place for it to continue generating per share growth.
Dividends are scarce, we provide the solution
For everything you need to build a growing stream of dividend income, please consider joining Portfolio Income Solutions. As a member you will get:
- Access to a curated Real Money REIT Portfolio
- Continuous market and single stock analysis
- Data sets on every REIT
You will benefit from our team’s decades of collective experience in REIT investing. On Portfolio Income Solutions, we don’t only share our ideas, we also discuss best trading practices and help you become a better investor.