dszc/E+ via Getty Images
The Buy Thesis
Farmland Partners (NYSE:FPI) has dropped 15% for non-fundamental reasons representing an extra 15% of rebound potential off of what was already a good value stock. Former preferred investors are simply not interested in the common and have sold it off. Once this constituency issue bleeds off I anticipate the price bouncing back to pre-conversion levels.
The Preferred Conversion
REITs convert or redeem preferreds frequently, and usually, it is not much of an event with perhaps a bit of savings using a cheaper cost of capital. The reason the FPI preferred conversion is a big deal and has moved the market so much is that the preferred was huge relative to the common.
Preferred B had a liquidation preference of $154.5 million ($12.75 share price * 12,119,829 shares issued) and this is converting into a common with a pre-conversion market cap of $380 million.
With these relative ratios in mind, the numbers are big and the two most important impacts of conversion for the continuing value of the common are:
- Big increase in share count
- Substantial savings on preferred dividends
The immediate reaction to share count increasing by roughly 35% is to assume dilution. This notion is further bolstered by the market price dropping off a cliff.
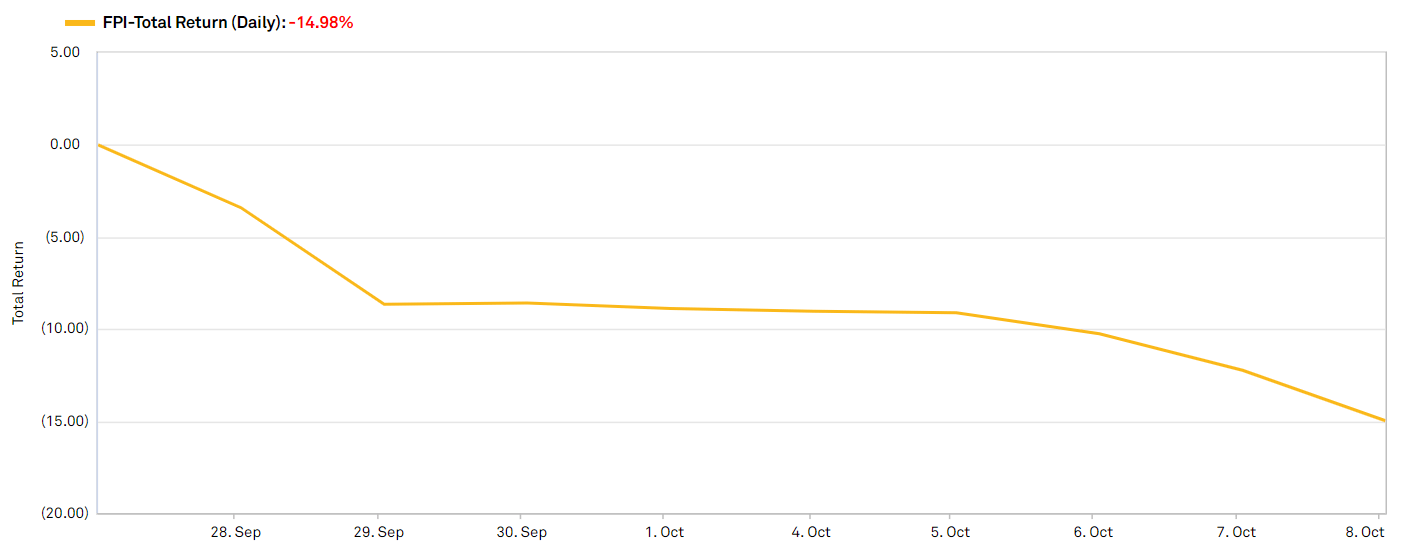
Source: SNL Financial
However, I see the fundamental impacts as mildly accretive.
The preferred had a coupon of 6% in addition to a farmland value appreciation factor that was likely to increase by about $0.50 a year which brings its total carrying cost to just over 8%. Thus, in converting it to common, all that expense is wiped out resulting in significant accretion to AFFO/share.
As of the latest 10-K there were 5,831,870 preferred B shares outstanding.
![]()
Source: 10-K
This equates to annual Preferred B dividends of $8.74 million. Assuming annual farmland appreciation for the FVA of $0.50 the total annual cost of the preferred was $11.66 million.
The tradeoff for those costs being gone is an additional 12.1198 million shares of common stock which will bring the total share count to approximately 44.655 million shares.
Using this share count the preferred dividend savings per share will be $0.196 per share and the FVA savings will be $0.0653 per share.
Assuming the common dividend remains at $0.20 annually the incremental shares will incur dividends of $2.43 million which when deducted from the preferred dividend savings leaves an incremental $6.324 million of free cash flow to the company.
This data is summarized in the table below.
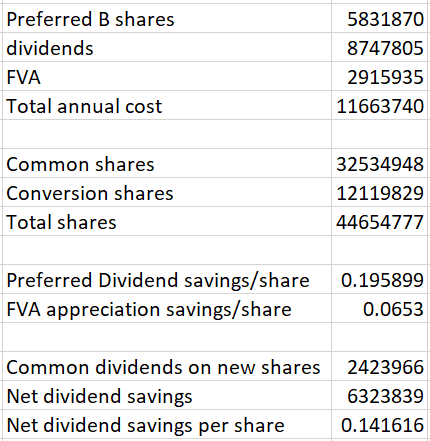
Excel math with data from company filings
Impact to AFFO/share
The cents of accretion actually depends on what the AFFO would have been without the conversion since the dilutive aspect of the shares issued is based on the former AFFO.
Since a significant portion of AFFO each year is based on participation in revenues of their tenant’s specialty crops, it varies significantly each year. Thus, to calculate the accretion to AFFO/share, we can use a sensitivity table using various figures for what AFFO would have been without the conversion.
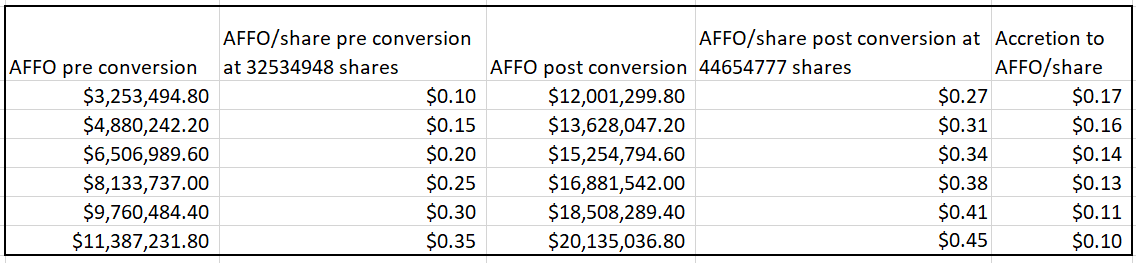
Excel math with data from company filings
Depending on how yields turn out and what market prices are for the specialty crops, AFFO/share was likely to be somewhere between $0.10 and $0.35 prior to conversion. Factoring in both the dilutive effects of the new shares and the savings from not having to pay the preferred dividend, AFFO/share post-conversion is likely to be in the range of $0.27 to $0.45.
Therefore, the conversion was accretive to AFFO by somewhere between $0.10 and $0.17 per share.
Impact to NAV
Just before conversion, the consensus NAV estimate was $14.00
Thus, issuing shares at $12.75 for the conversion was dilutive to NAV, just not by much. If NAV was $14/share, it is now $13.66 per share.
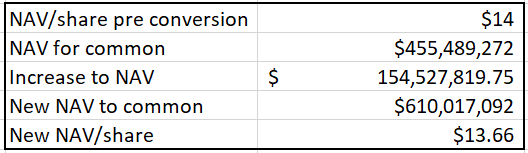
Excel math with data from company filings
With accretion to AFFO/share of $0.10 to $0.17, the extra retained cash flows will make up the difference to NAV in a matter of a couple years, but the extra AFFO will continue even after the NAV gap is made up.
As a result, I think it is quite clear that the conversion is overall beneficial to the value of FPI common shares. When the preferred was issued originally, it was with the intent to convert it to common. The reason they did not just do common in the first place is because FPI was trading so cheaply that it would have been dilutive to issue common shares at that time.
The $12.75 conversion price represents a significantly higher price than FPI was trading at when the preferred B was issued. This allowed FPI to still buy the land at that time when the land was cheap, but pay for it with equity later when the equity is trading at a more reasonable price.
Over the holding period, the land purchased appreciated quite significantly, easily overcoming the expense of the preferred dividends.
Perhaps it was a slightly risky play as it relied on the common eventually trading at a reasonable price, but the risk paid off. Full cycle the preferred issuance, land purchase, and eventual preferred conversion to common significantly increased shareholder value.
With all this in mind, why did FPI sell off 15% upon the conversion?
Why the Stock Dropped
Different investors own stocks for different reasons. If a tech investor suddenly owned a REIT they would not know what to do with it and would probably sell. Similarly, if a social media stock somehow ended up in my portfolio I would sell it.
These sales would be in no way a verdict on the stock itself, the stocks just categorically don’t fit with the investor.
I believe that is what has happened here.
Investors generally buy preferreds for their stability and big dividends. That is exactly what FPI preferred B provided. The 6% coupon kept dividend checks coming in and the farmland asset foundation gave a high degree of security to the principal.
Chances are that most of the preferred investors are not interested in the common because it has a very different profile. The common is a somewhat low dividend stock with the opportunity instead being long-term NAV accretion. Further, the volatile market price of the common is probably not desired by the preferred holders who enjoyed the anchored liquidation preference of a preferred.
It's not that the preferred holders necessarily think the common is a bad stock, it just categorically doesn’t fit with what they are trying to do. As a result, many of them have sold.
The evidence for this is in the extremely elevated trading volume since announcement of the conversion.
Normal trading volume for FPI has been 237,000 shares per day. Since conversion, it has averaged about twice that as market price precipitously fell.
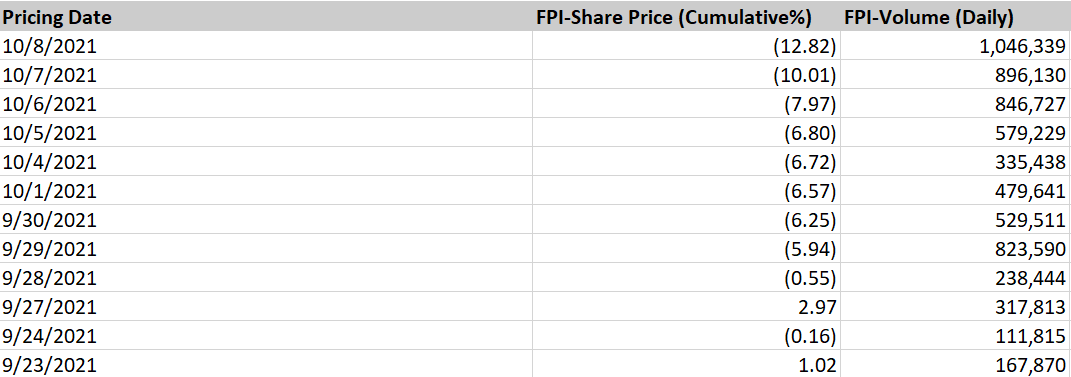
Source: SNL Financial
At this point, the volume has been large enough that anyone from the conversion who wanted out has had the chance to get out.
The conversion was overall good for shareholders and this pricing dip that resulted from the flood of former preferred holders heading for the exit is a gift.
Once the floodgates close, I see no reason FPI will not float back up to the circa $13 at which it traded pre-announcement.
One Other Major Benefit of the Conversion
With its new higher share count FPI is now large enough to be included in the index that the Vanguard Real Estate ETF (VNQ) tracks.
The minimum market cap for inclusion is right around $550 million. Franklin Street Properties (FSP) has a market cap of $562 million and it is included in the VNQ. The reason this is a big deal is that when a stock is in the VNQ the ETF will own a massive chunk of shares.
Shown below is FSP’s top holders with Vanguard owning 14.67% of outstanding shares.
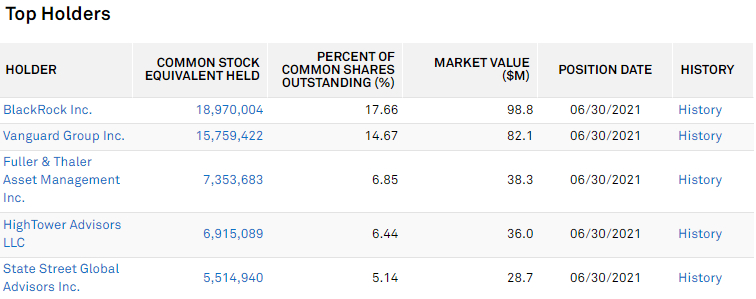
Source: SNL Financial
FPI now has a share count of 44.654 million so if they can get back up to $13 per share that would be a market cap of $580 million making them large enough to be put in the index.
If/when that happens Vanguard will buy up somewhere between 5% and 14% of outstanding shares and hold for a long time.
This sort of wave of buying tends to have very positive impacts on market price.
Those who know the company best seem to believe in its long-run prospects with continual free market purchases.
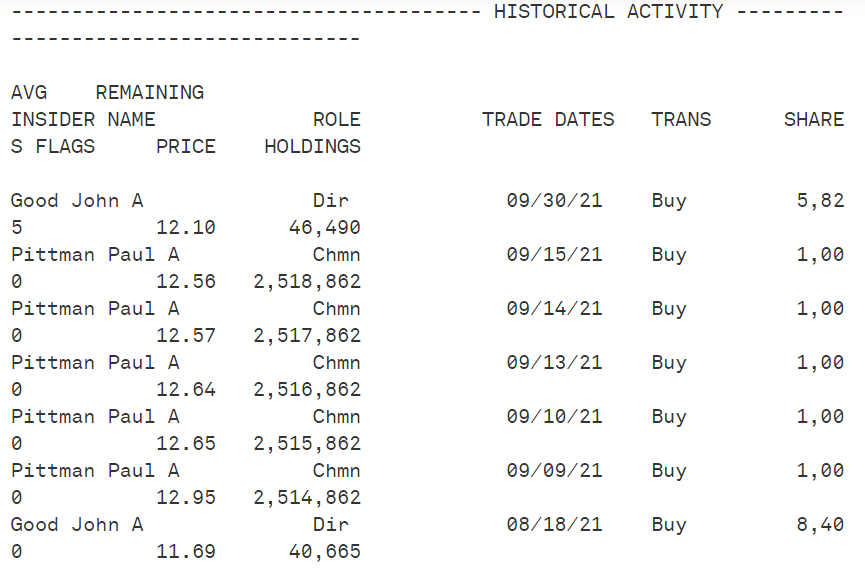
Source: SNL Financial
Note that the share column on the right is in 10s so that is 5820 shares bought by John Good.
Putting it Together
The same fundamental story that FPI has had for a long time remains fully intact. Farmland is appreciating in value and rental rates are rising as farmer incomes grow. There is always going to be bumpiness in the year to year numbers because commodity prices and crop yields are volatile, but the perpetual trend in farmland is upward.
That is the kind of industry to which I want exposure and that exposure is presently on sale with the completely unwarranted 15% pricing dip.
Dividends are scarce, we provide the solution
For everything you need to build a growing stream of dividend income, please consider joining Portfolio Income Solutions. As a member you will get:
- Access to a curated Real Money REIT Portfolio
- Continuous market and single stock analysis
- Data sets on every REIT
You will benefit from our team’s decades of collective experience in REIT investing. On Portfolio Income Solutions, we don’t only share our ideas, we also discuss best trading practices and help you become a better investor.