JamesBrey/iStock via Getty Images
Investment Thesis
As you approach retirement, income generation and risk management begin to take over as primary investment objectives, and you're faced with a delicate balancing act. You're aware that the highest-yielding securities are often the worst-performing ones, but you need the income stream plus some reasonable assurance that your portfolio won't fall the hardest in what seems like an inevitable market correction.
Enter the iShares Core High Dividend ETF (NYSEARCA:HDV), which I believe should be temporarily added to your high-income portfolio. It undoubtedly has some flaws, which I've noted before and will describe again in this article. But the fund's 75 holdings appear in good overall health. Beta is low, debt levels and payout ratios aren't excessive, dividend yields are high, and it's even appealing at the technical level, too. I favor HDV as a defensive position today, and I'll explain why in detail in this article.
HDV Overview
Fund Basics
- Current Price: $99.03
- Net Assets: $7.47 billion
- Shares Outstanding: 75.35 million
- Expense Ratio: 0.08%
- Launch Date: March 29, 2011
- Trailing Dividend Yield: 3.41%
- Five-Year Dividend CAGR: 4.14%
- Five-Year Beta: 0.87
- Number of Securities: 75
- Portfolio Turnover: 75%
- Median Bid-Ask Spread: 0.01%
- Tracked Index: Morningstar Dividend Yield Focus Index
As shown, the expense ratio is excellent, as only the Schwab U.S. Dividend Equity ETF (SCHD) has lower fees (0.06%) in the category. However, HDV has delivered a yield of about 60 basis points higher in the last twelve months, and I'll show later why this yield gap should widen even further this quarter.
HDV is also one of the few in its category to offer a five-year beta below 0.90. Others include the Global X Super Dividend U.S. ETF (DIV) and the WisdomTree U.S. High Dividend Fund (DHS), and since the beta of its current constituents nets out to be 0.86, a key attraction is that it should reduce risk in a correction. On the flip side, investors should expect continued underperformance if the bull market continues; if that's your market outlook, HDV is not for you.
Methodology
The Index is a subset of the Morningstar US Market Index, which represents about 97% of the U.S. equity market capitalization. Securities are selected by the screening requirements outlined below:
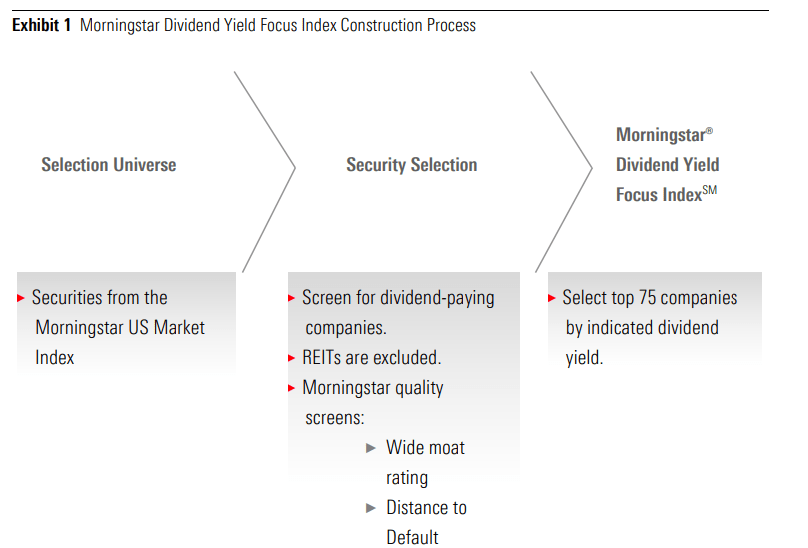
Source: Morningstar Dividend Yield Focus Index Construction Rules
All dividend income is qualified, which is why REITs are excluded. The proprietary Wide Moat Rating and Distance to Default measures are used to keep quality relatively high and to avoid yield traps, and companies are ranked by their indicated dividend yield with the top 75 qualifying. Weights are assigned by aggregate indicated dividends, and the Index reconstitutes and rebalances quarterly. These frequent reconstitutions lead to high portfolio turnover but work to ensure a high yield is consistently delivered.
Finally, Morningstar caps a constituent's weighting at 10%, and stocks weighing more than 5% cannot total more than 50% of the Index at each rebalancing date. You may see this referred to as the 5-10-50 capping rule discussed in this document.
Top Holdings and Sector Exposures
Exxon Mobil (XOM) and Chevron (CVX) are the two Energy stocks in the top ten list. At present, the top ten comprise 54.42% of the fund.
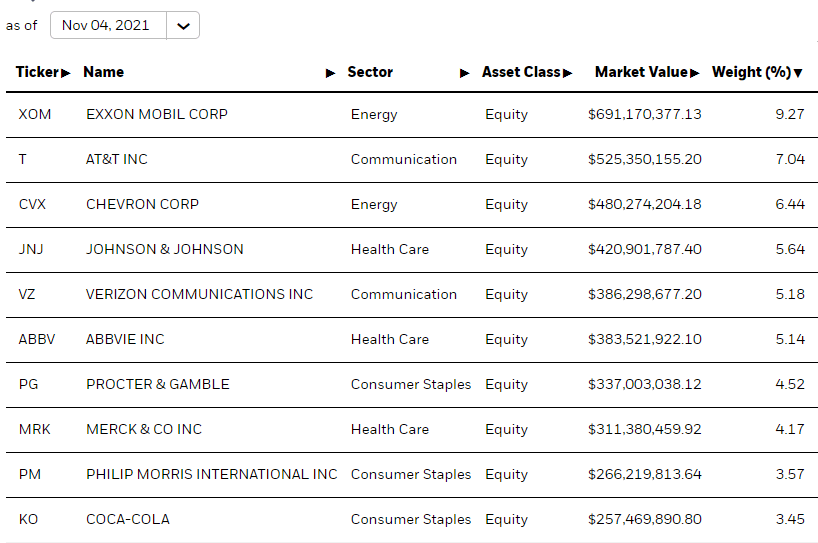
Source: iShares Core High Dividend ETF Overview
Along with Energy, most of the fund is concentrated in defensive industries like Health Care (20.85%), Consumer Staples (16.41%), and Communication Services (12.48%). Since yield and price move inversely with each other, it is no surprise that these sectors have been laggards. But the degree to which this is true is strange. Still, along with ensuring a high yield, HDV investors stand to benefit if cyclical and growth stocks cool off.
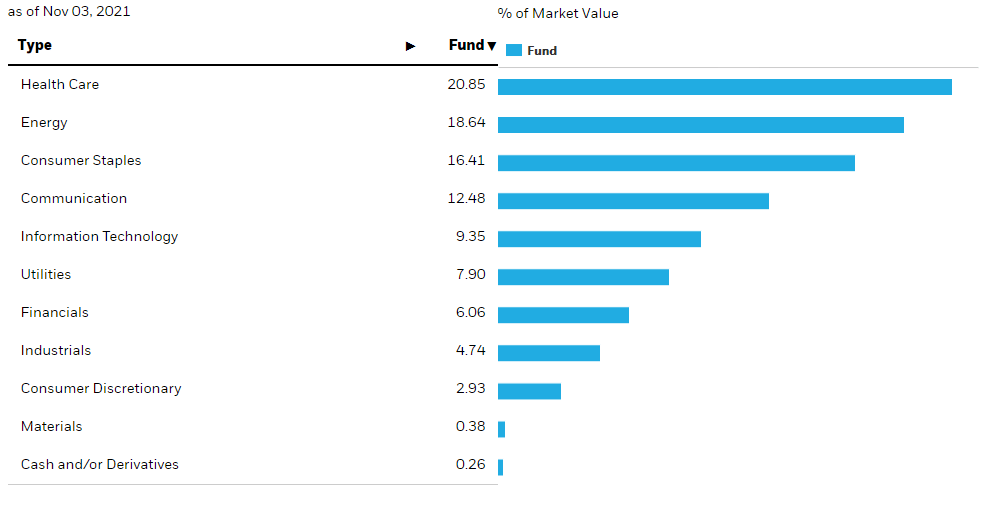
Source: iShares Core High Dividend ETF Overview
Dividends
Below is a table summarizing HDV's annual dividends dating back ten years. There's modest dividend growth, but it's certainly not the objective. There are better funds out there, but the trade-off is that they are more market-like and have lower yields.
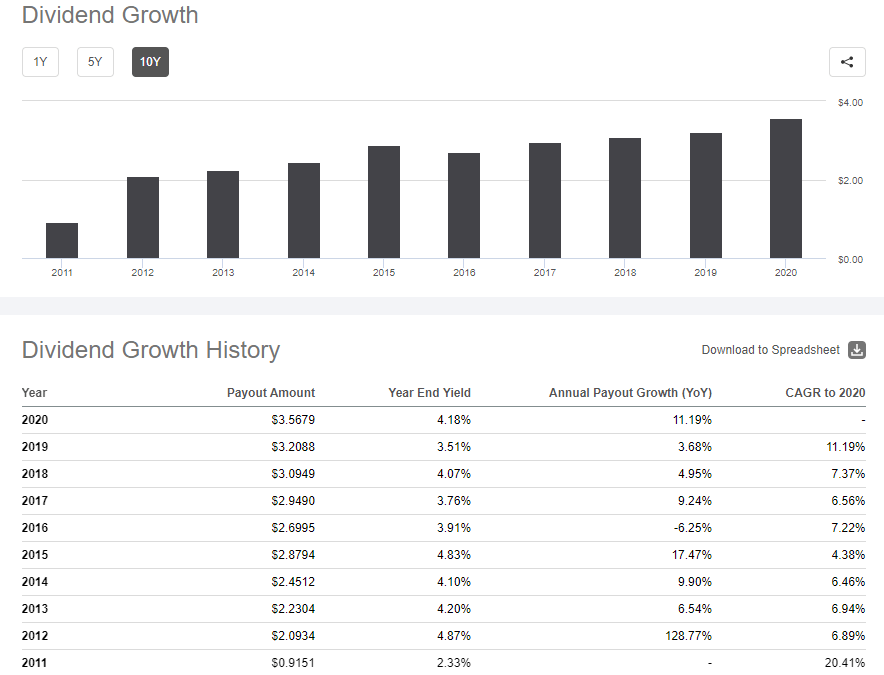
Source: Seeking Alpha
Performance
Since its inception, HDV has significantly underperformed other high-dividend ETFs. This category includes the iShares Select Dividend ETF (DVY), which was compared with HDV by the Retired Investor, and the First Trust Morningstar Dividend Leaders Index ETF (FDL), which currently has less Energy exposure but several similar top holdings.
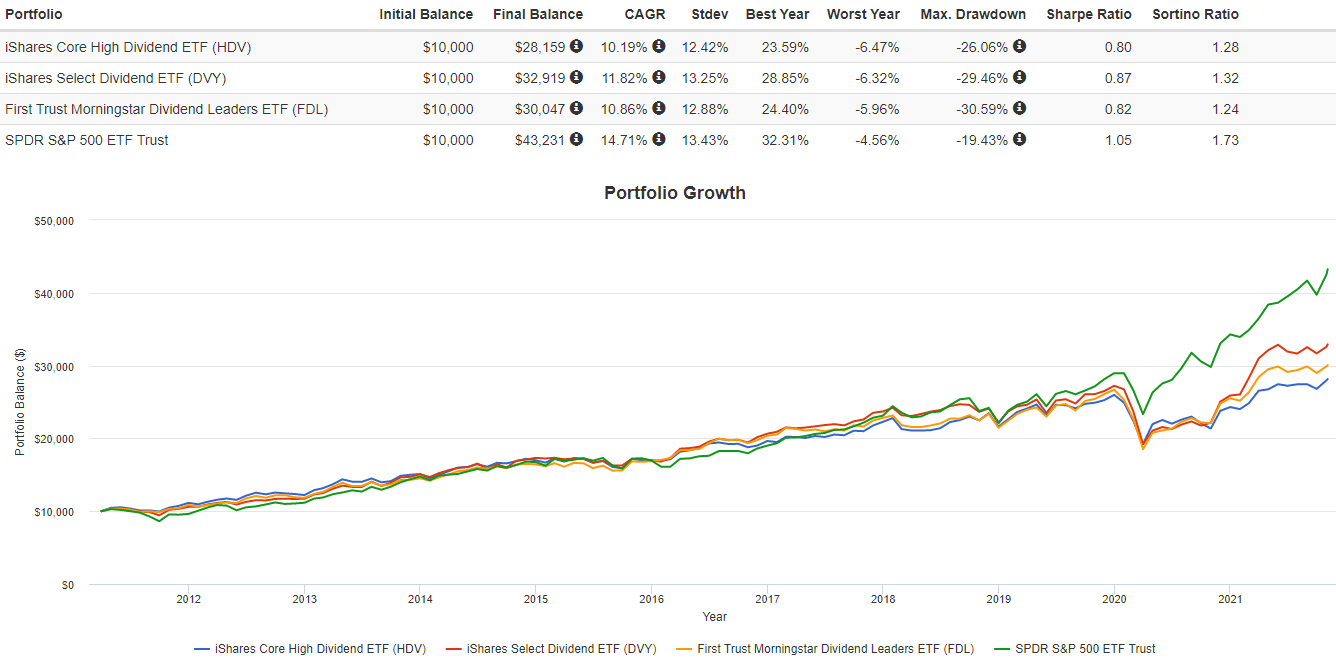
Source: Portfolio Visualizer
The table below shows the performance through October of 16 ETFs I've categorized in the High-Dividend-Yield category. I've sorted them based on one-year performance, and HDV is right at the bottom.
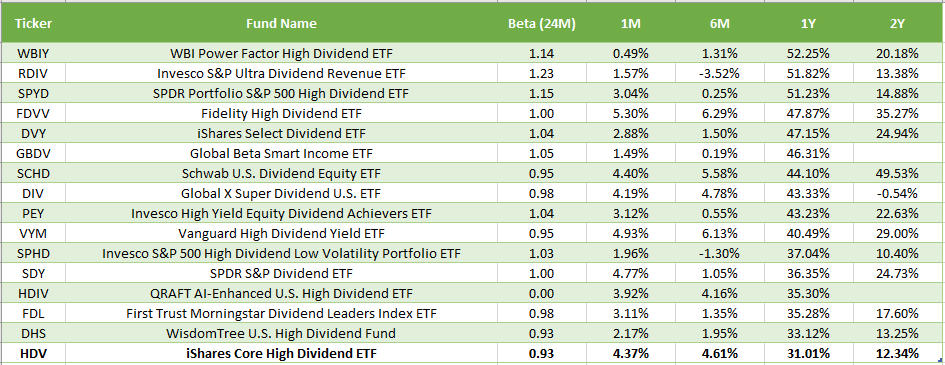
Source: Created By Author Using Data From Portfolio Visualizer
However, you can see the link between beta and returns. It's no surprise that an ETF like the SPDR Portfolio S&P 500 High Dividend ETF (SPYD) did much better since its holdings are generally more volatile than the market. Again, if your outlook on the market is bullish and you don't need downside protection, HDV doesn't make much sense. But let's say the S&P 500 experiences a 13.52% drop like it did in Q4 2018.
Now, HDV doesn't look so bad. Here's a performance table for high-dividend ETFs as of the end of December 2018. HDV fell just 6.03% during that period and was the only one in the category to post a gain in the preceding six months.
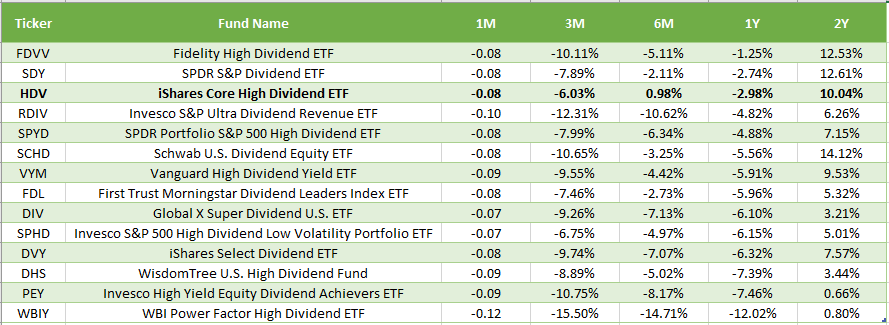
Source: Created By Author Using Data From Portfolio Visualizer
With that said, the turnover rate indicates many changes in the Index since then, so let's take a closer look at HDV's fundamentals.
Fundamental and Technical Analysis
Dividend Safety, Quality, and Growth
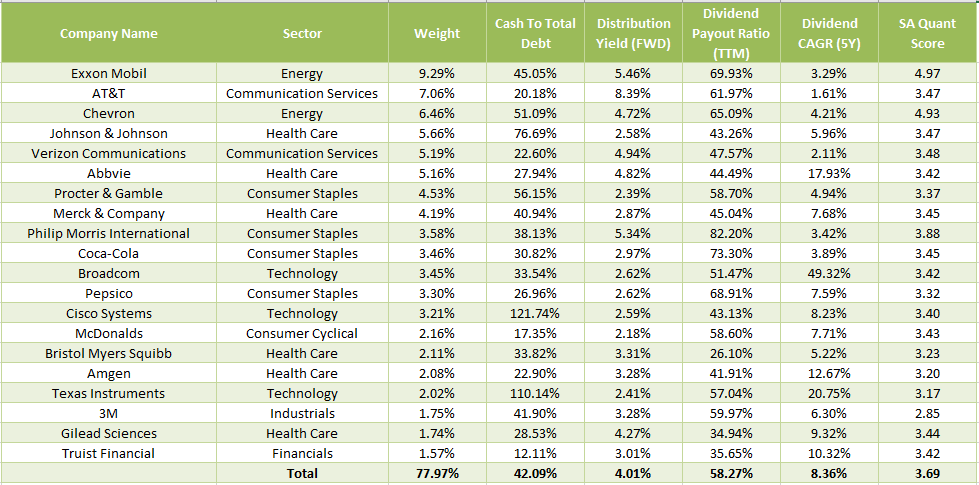
Let's start with dividends, as it's one of HDV's two primary attractions. The table below provides a snapshot of various relevant metrics, including dividend yield, payout ratios, and growth rates.
Source: Created By Author Using Data From Seeking Alpha
A few observations:
1. The cash to total debt ratio, which is the ratio of operating cash flow to total debt, is sufficient for a high-dividend fund. I would want this ratio to be above 50% for a broad-based or growth fund, but this metric suggests that enough cash is coming in to support current distributions.
2. The weighted-average forward yield is 4.01%, 60 basis points higher than the fund's trailing yield, which is net of the fund's 0.08% fees. Many factors drive this difference (not the least of which is turnover), but I want to note that Exxon Mobil and Chevron have yet to go ex-dividend this quarter. Their abnormally high current weights indicate that the ETF will collect higher-than-usual income until the Index reconstitutes in mid-December. Therefore, investors should be able to sneak in a high yield before the quarter closes.
3. With a few exceptions, dividend payout ratios aren't excessive. Only four stocks have payout ratios above 100%, and their weightings are immaterial. In particular, Exxon Mobil is benefitting from higher oil prices and recently announced a $10 billion share repurchase program beginning in 2022, so I don't think distributions are at much risk today.
4. The five-year dividend growth rate of 8.36% is lower than the double-digit rates S&P 500 companies post. The 49.32% CAGR for Broadcom (AVGO) also skews the number, as it was just 10.77% in the last year. Therefore, I wouldn't say dividend growth is HDV's strong suit.
5. Seeking Alpha's Quant Score of 3.69 indicates that HDV ranks somewhere in between neutral and bullish based on fundamental metrics. However, the average score is 3.43, and the median score is 3.30. You can see the skewness in the data above since Exxon Mobil and Chevron have near-perfect scores. In my view, concerns about these stocks getting too hot right now are warranted given how it's a very volatile sector. I think the overall exposure will come down at the next reconstitution, though, if you can hang on another six weeks.
Sales Growth
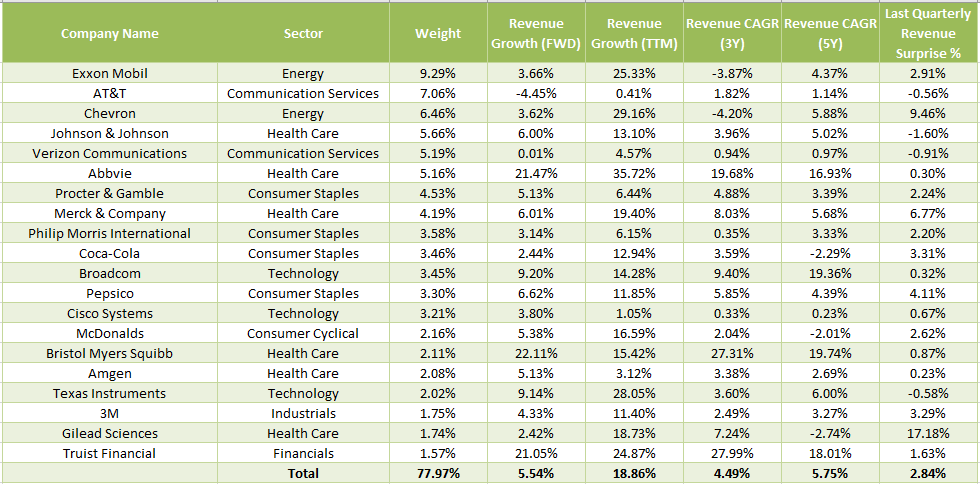
It's key to remember that dividends aren't sustainable in the long run without sales growth. Note below how the five-year revenue growth rate of 5.75% is less than the 8.36% five-year dividend growth rate shown in the earlier table. This is a warning sign, solidifying my position that HDV should only be used as opportunities present themselves.
Source: Created By Author Using Data From Seeking Alpha
There's a difference between dividend consistency and dividend safety. While dividend consistency may better reflect the odds of a dividend cut, dividend safety may better reflect whether a company should cut its dividend. If a poor-scoring company should cut or pause their dividends and they don't, it's just going to show up in the form of lower total returns. This has been a persistent problem for high-dividend-yield ETFs, as the category has been the fourth-worst performer in the last five years out of 37 that I track.
Source: Created By Author Using Data From Portfolio Visualizer
Technicals
In my view, technical analysis isn't sufficient on its own, as there are just too many ways an analyst can be biased. I showed earlier how HDV performed relatively well to end 2018, but long-term investors could rightfully point out how it's been a poor performer since its inception. While there's no right or wrong time frame to choose from, my research indicates that significant variations in median six-month returns among sectors indicate mean-reversion is on the horizon. Using the SPDR Sector Heatmap as a general guide, you can see that most of HDV's overweighted sectors have been relatively poor performers.
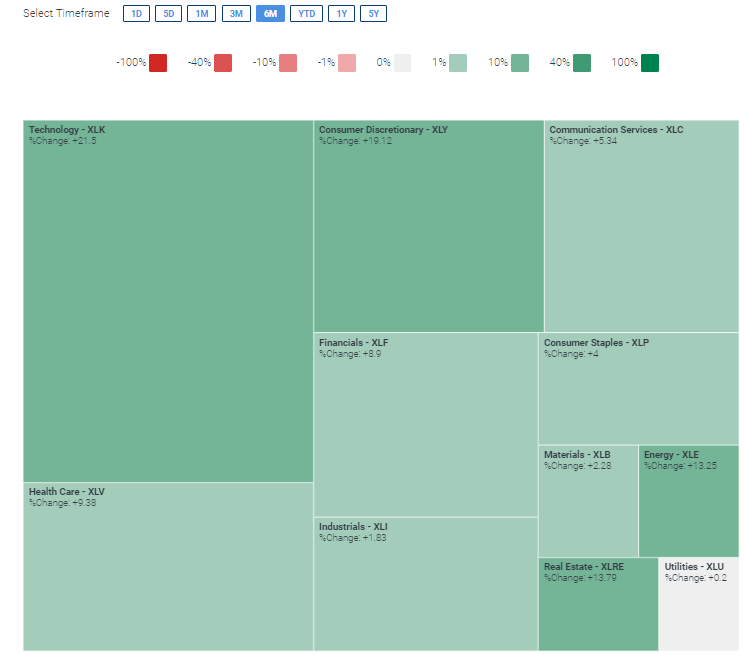
Source: SPDR Sector Tracker
We can also look at the last price versus various moving average prices for HDV's top 20 constituents:
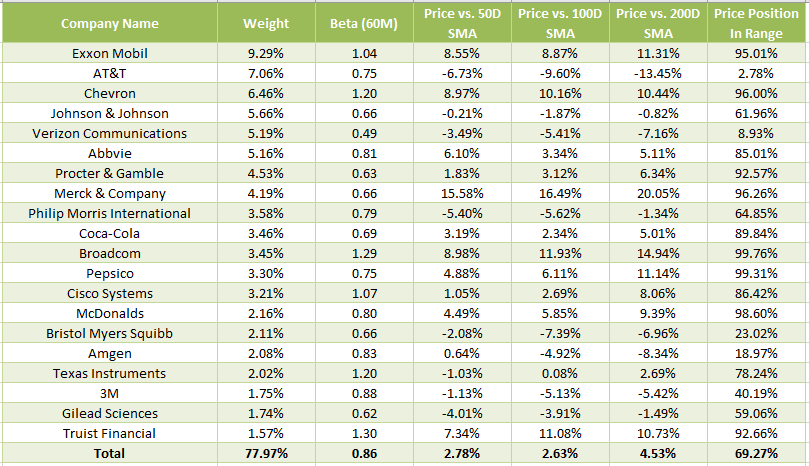
Source: Created By Author Using Data From Seeking Alpha
Here, the two Energy names are trading near their highs as measured by the price position in the 52-week high and low range. Prices are also well ahead of all moving averages. Still, the net figures are below the S&P 500's, as shown below. As a reminder, this type of technical analysis at the ETF level isn't beneficial with high turnover funds like HDV. Instead, it's necessary to look at current holdings, as last year's holdings aren't relevant anymore.
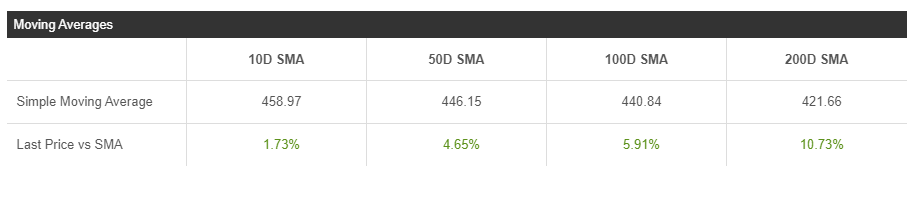
Source: Seeking Alpha
Investment Recommendation
I recommend defensive income investors take out a short-term position in HDV. I anticipate an above-average yield this quarter, the constituents are in reasonably good financial health, and there are indications that the ETF will outperform in a correction. While past performance should not be relied upon, especially for these high turnover ETFs, it is comforting to know that the strategy performed well in Q4 2018.
The sector mix is defensive, and the odds of there being any dividend cuts are low. Plus, there's a reasonable chance that inflationary pressures will drive a correction; HDV's high allocation to the two oil majors provides a nice hedge that other high-yielding ETFs don't have.
I want to be clear that HDV is not appropriate for those bullish on the market. For those investors, I suggest looking at high-yielding ETFs with market betas closer to or above 1. You can refer to my Dividend and Income ETF Guide to find the ones best suited to your style, but SCHD, VYM, SDY, DVY, and PEY could be good choices. HDV, though, seems to have carved out a unique niche. If you want some downside protection along with a high income, I think it could be the one you've been searching for.