
Nuthawut Somsuk/iStock via Getty Images
Get ready for charts, images, and tables because they are better than words. The ratings and outlooks we highlight here come after Scott Kennedy’s weekly updates in the REIT Forum. Your continued feedback is greatly appreciated, so please leave a comment with suggestions.
We recently highlighted five fat dividend yields you will regret. Now we want to focus on some positive examples. Here are three better high-yielding choices. I’ve purchased shares in each of these over the last few months and still own the shares today. Further, these are shares that are still trading at much better valuations than peers today.
We will start with PennyMac Mortgage Trust (PMT).
PMT is a solid mortgage REIT and one of the top performers through the pandemic. The company originates and services mortgages in addition to owning a portfolio of agency RMBS. Shares carry a high yield at 10.3% and offer upside as the shares trade at a material discount to book value. It isn’t a huge discount, but it's big enough to be material and that should be drawing some eyes. A price-to-book ratio around .91 is a good deal for PMT. I wasn’t alone in buying shares of PMT either. Scott Kennedy, another analyst for The REIT Forum, also added to his position and posted a trade alert before I purchased shares:
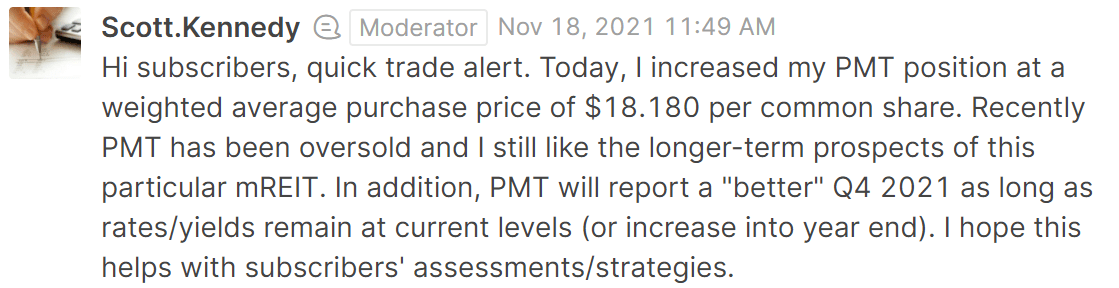
Source: The REIT Forum
I paid a bit more to secure our shares, coming in at $18.33 per share:
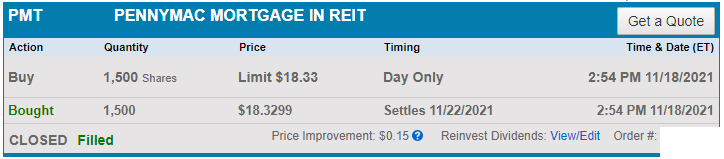
Source: Schwab
Is a .91 price-to-book ratio a bit too low? I think so. Looking simply at trailing values, we can see that since the middle of 2018 large discounts haven’t been sustained:
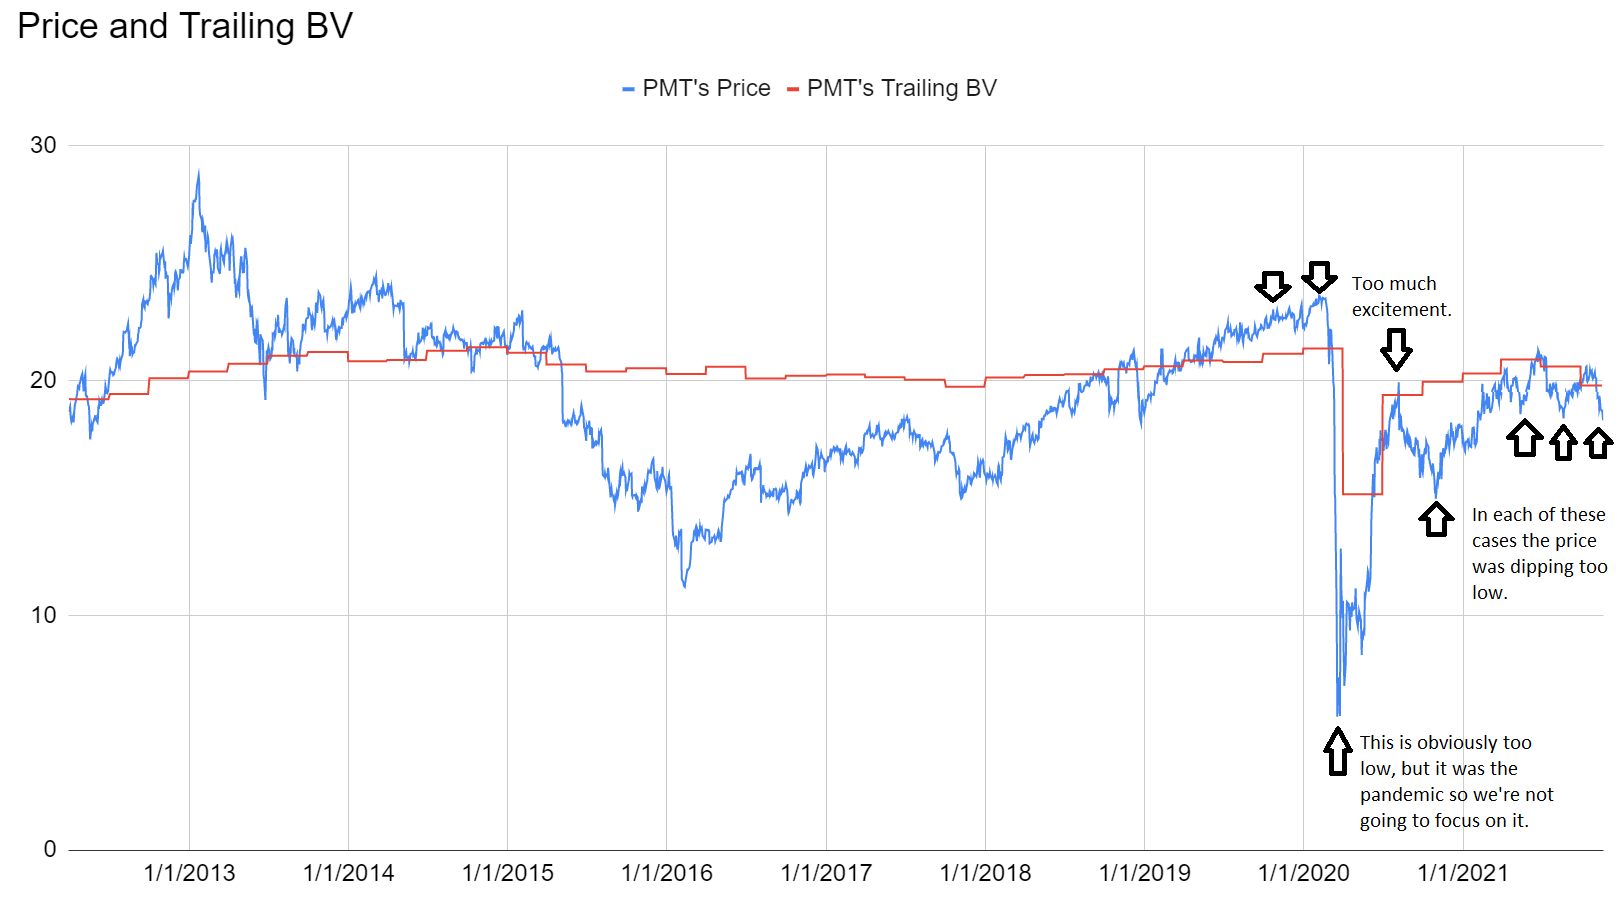
Source: Author’s chart
It's worth noting that a material discount existed between the late summer of 2020 and the spring of 2021. However, many peers also traded at substantial discounts so there were more abundant opportunities. When opportunities are abundant, a given discount is less impressive. Today, discounts are starting to become more common again but PMT’s discount is still relatively large for PMT.
Income investors will love the following part of their latest presentation:
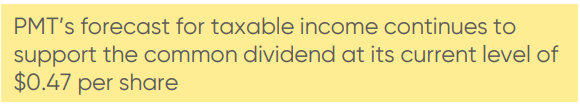
Source: PMT’s Q3 2021 Earnings Presentation
However, I should highlight that I treat my mortgage REIT positions as trading positions. When the price is low, I buy shares. When it is high, I sell shares. This strategy has worked extremely well and I don’t intend to change it.
Our next REIT for evaluation is Dynex Capital (DX).
DX is one of the lower-risk choices among mortgage REITs and carries an 8.9% dividend yield. Management pays more attention to defense (protecting book value) than offense (squeezing out every cent for core earnings). Because they have avoided large losses dramatically better than most peers, DX has a much stronger record. Investors often become complacent and don’t realize the value of that defense until we hit a major disturbance in the market. During the pandemic, DX declined dramatically less than many of their peers. They reported a much smaller decrease in book value. They even recovered book value and reached a higher level than they had just prior to the pandemic.
Source: Author’s chart
It looks like the gap shrank lately, but we know BV on 9/30/2021 happened to be a bit lower than it was in early Q4 2021. It increased in October 2021. We know because management explicitly said so:
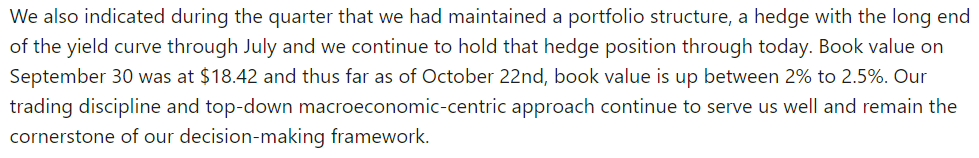
DX Q3 2021 earnings transcript
DX’s BV for late October 2021 was in line with REIT Forum estimates and that represents a bigger discount than we would see just using trailing book value. We were modeling book value throughout the period and continue to do so throughout the sector, but it doesn't hurt to have management confirm values as of the earnings call.
Of course, mortgage REITs can be impacted by changes in the interest rate environment. Let’s look at how some major rates have changed during the quarter:
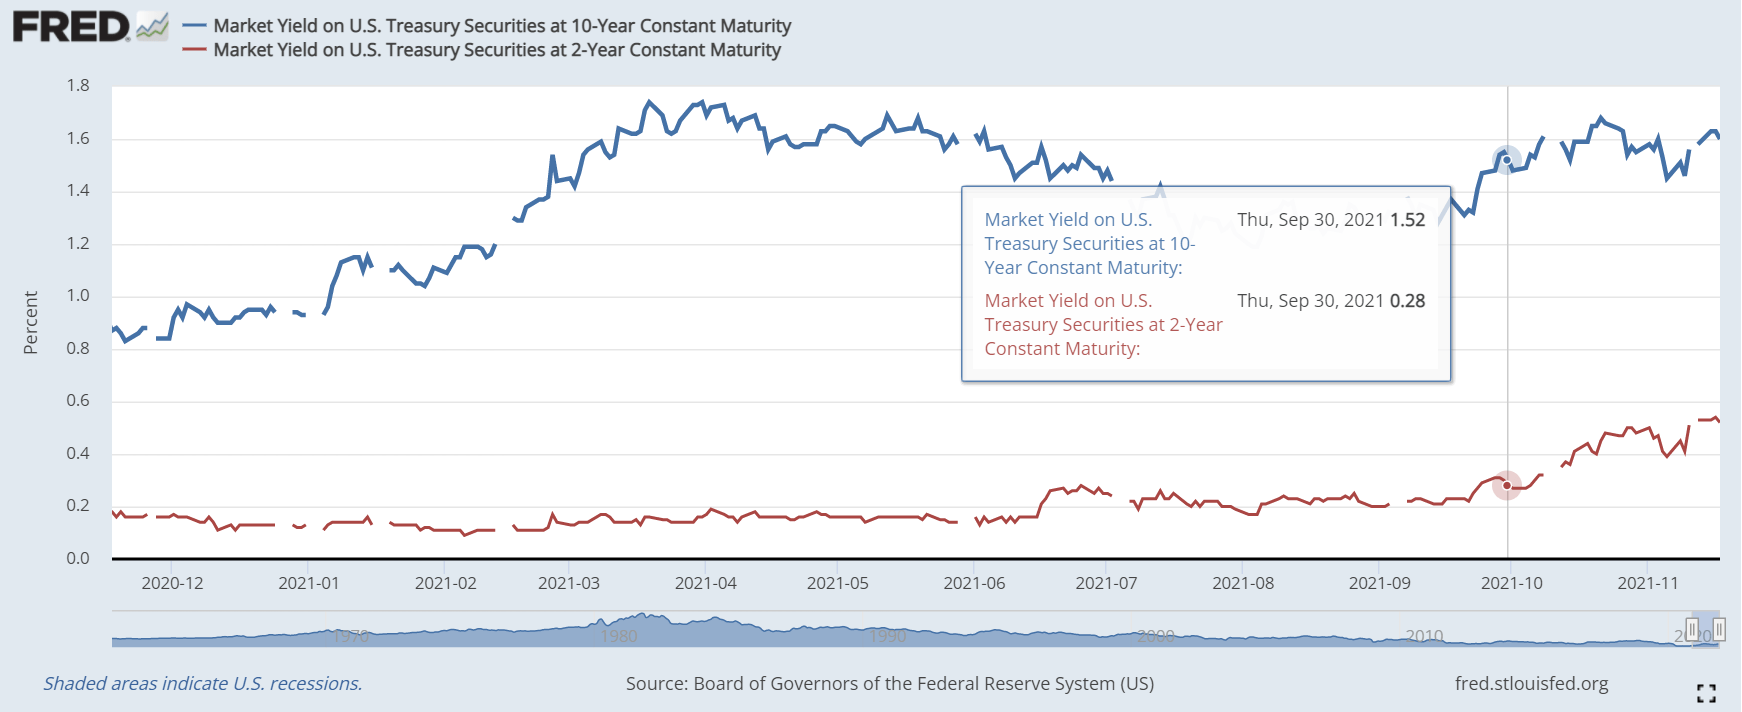
Source: Federal Reserve
Short-term rates increased slightly more than long-term rates, but overall, the change has still been pretty modest. So how did DX position their portfolio? Let’s look at their exposure to different potential interest rate environments:
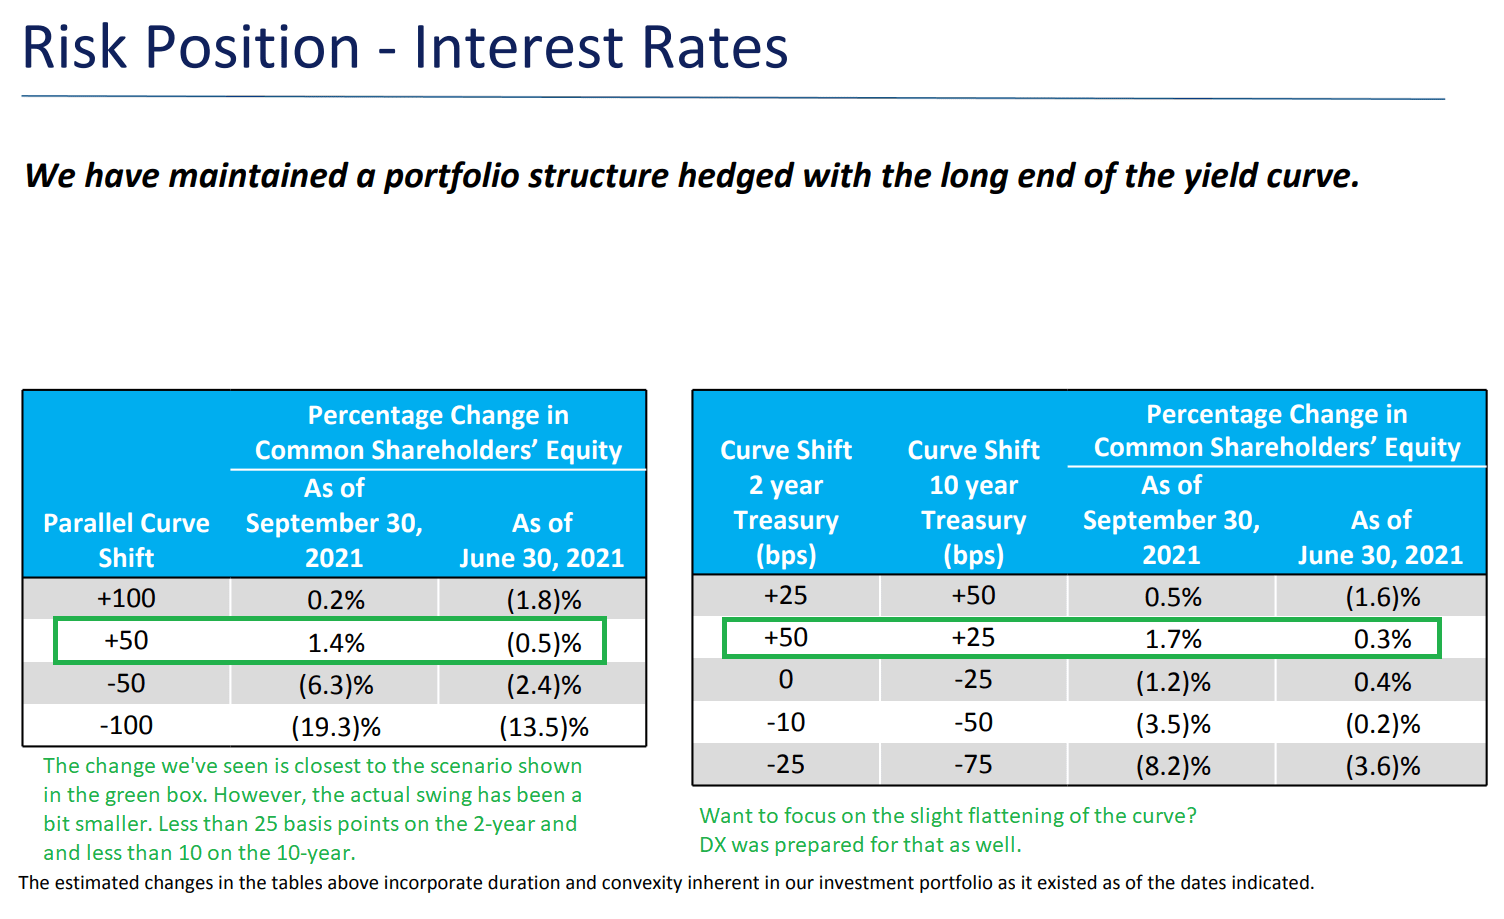
Source: DX Q3 2021 Earnings Presentation
DX hedged its portfolio to benefit from a moderate increase in rates. We’ve seen a moderate increase in rates. That’s great. We have the benefit of hindsight in seeing what actually happened in the interest rate environment and comparing it with the way management of any REIT was positioning their portfolio.
We added to our position in late October 2021:
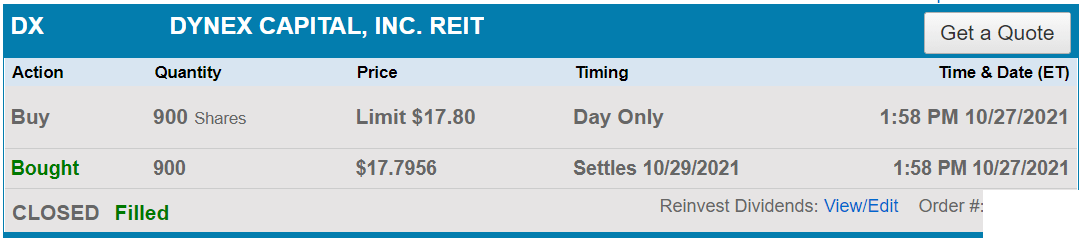
Source: Schwab
Now we’re moving onto a preferred share. New Residential (NRZ) has four series of preferred shares. It’s NRZ-D (NRZ.PD) that we want to highlight. We can sum it up with an image:
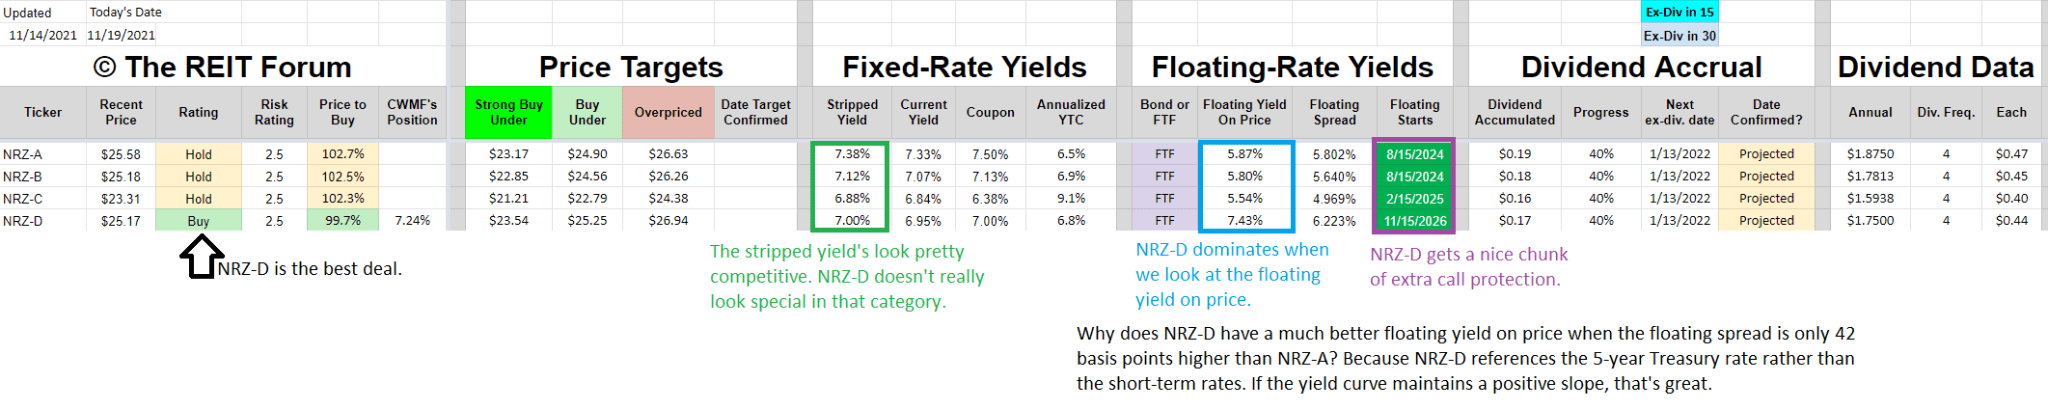
Source: The REIT Forum
NRZ-D offers investors extra call protection, a higher floating spread, and references the 5-year Treasury rate which is usually higher than short-term rates. The stripped yield at 7.00% today looks pretty good also. The result is a share that we find more attractive, especially when NRZ-D is cheaper. If NRZ-D isn’t called, it should be the most attractive of the shares. If it's called, investors earned a very reasonable 6.8% yield to call. Further, the floating spread is so large that when the floating rate kicks in it will most likely be a dividend increase. For most shares that transition to a floating rate, it will be a decrease.
Note: NRZ-D is technically classifying the shares as “fixed-rate reset” with the adjustment in rate based on the 5-year Treasury. This does not alter our view of the shares.
We bought shares in two accounts when they were initially released under the temporary ticker of NRZDP:
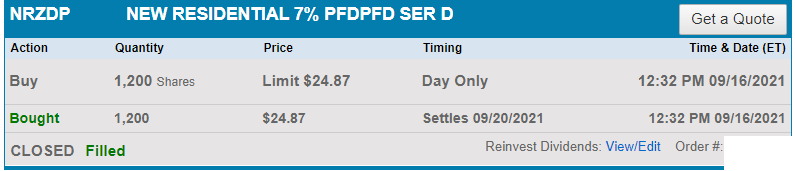
Source: Schwab
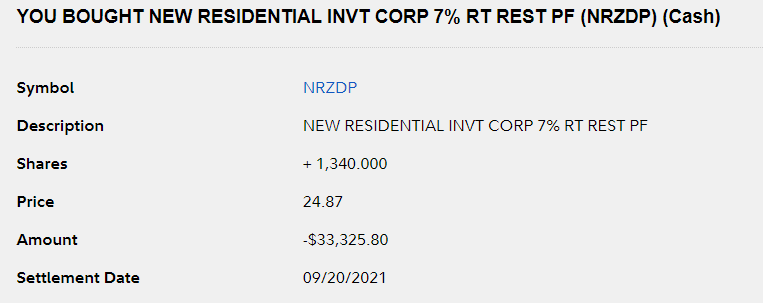
Source: Fidelity
Dividends
Why didn’t we spend most of our words talking about the dividend rate? Because we’ve already stated the dividend yield. You don’t need me to say it twice. Instead, we’re focusing on the overall risk/reward profile for each choice to determine which ones make sense to buy.
Conclusion
We’ve highlighted three shares with dividend yields ranging from 7% to 10.3% where investors are still getting a bargain on their investment. When you’re looking for investments in the sector, these are the kinds of opportunities you want to find. We’re happy to utilize a mix of common shares and preferred shares as each can assist our portfolio in different ways.
None of these stocks gets many articles on Seeking Alpha. Much of their coverage comes from us including these articles which span the sector.
The rest of the charts in this article may be self-explanatory to some investors. However, if you’d like to know more about them you’re encouraged to see our notes for the series.
Stock Table
We will close out the rest of the article with the tables and charts we provide for readers to help them track the sector for both common shares and preferred shares.
We’re including a quick table for the common shares that will be shown in our tables:
| Type of REIT or BDC | ||||
| Residential Agency | Residential Hybrid | Residential Originator and Servicer | Commercial | BDC |
| AGNC | CIM | PMT | BXMT | MAIN |
| NLY | EFC | NRZ | GPMT | TSLX |
| DX | NYMT | WMC | NEWT | |
| CMO | MFA | RC | ARCC | |
| ORC | MITT | GAIN | ||
| ARR | GBDC | |||
| CHMI | SLRC | |||
| TWO | ORCC | |||
| IVR | TCPC | |||
| AAIC | PFLT | |||
| EARN | OCSL | |||
| AINV | ||||
| FSK | ||||
| PSEC | ||||
Let the images begin!
Residential Mortgage REIT Charts
|
|
|

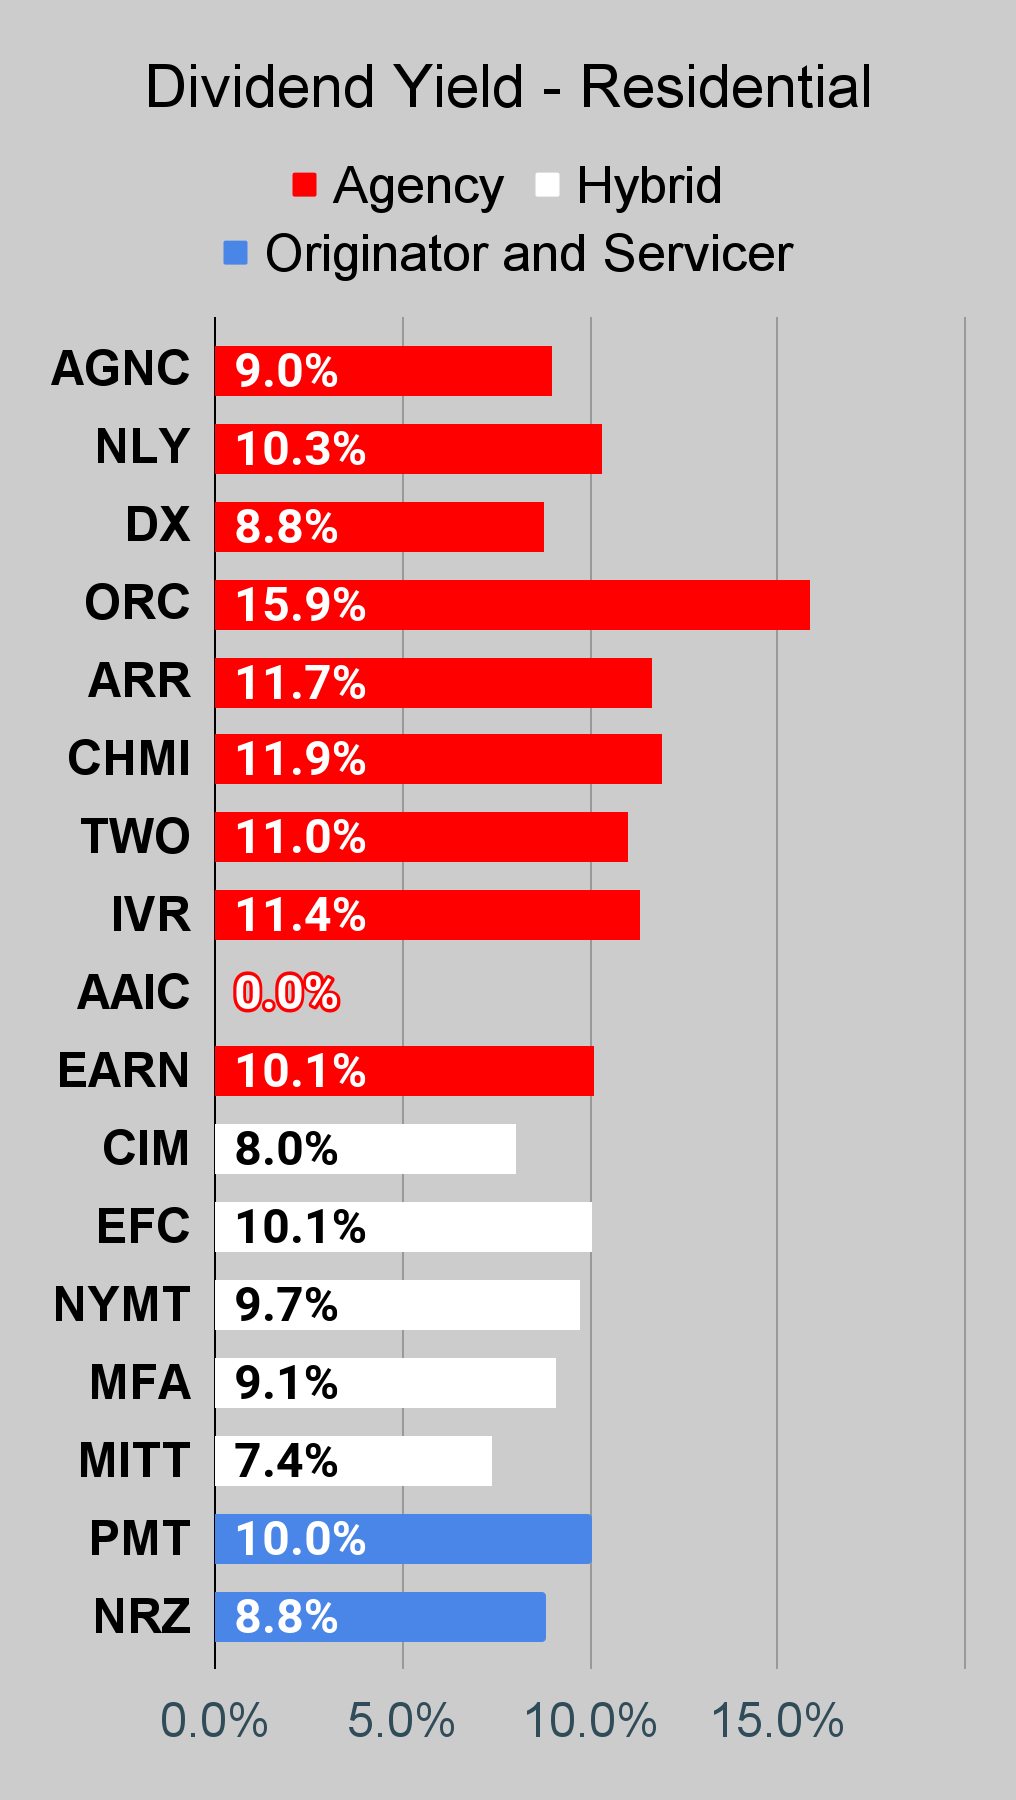
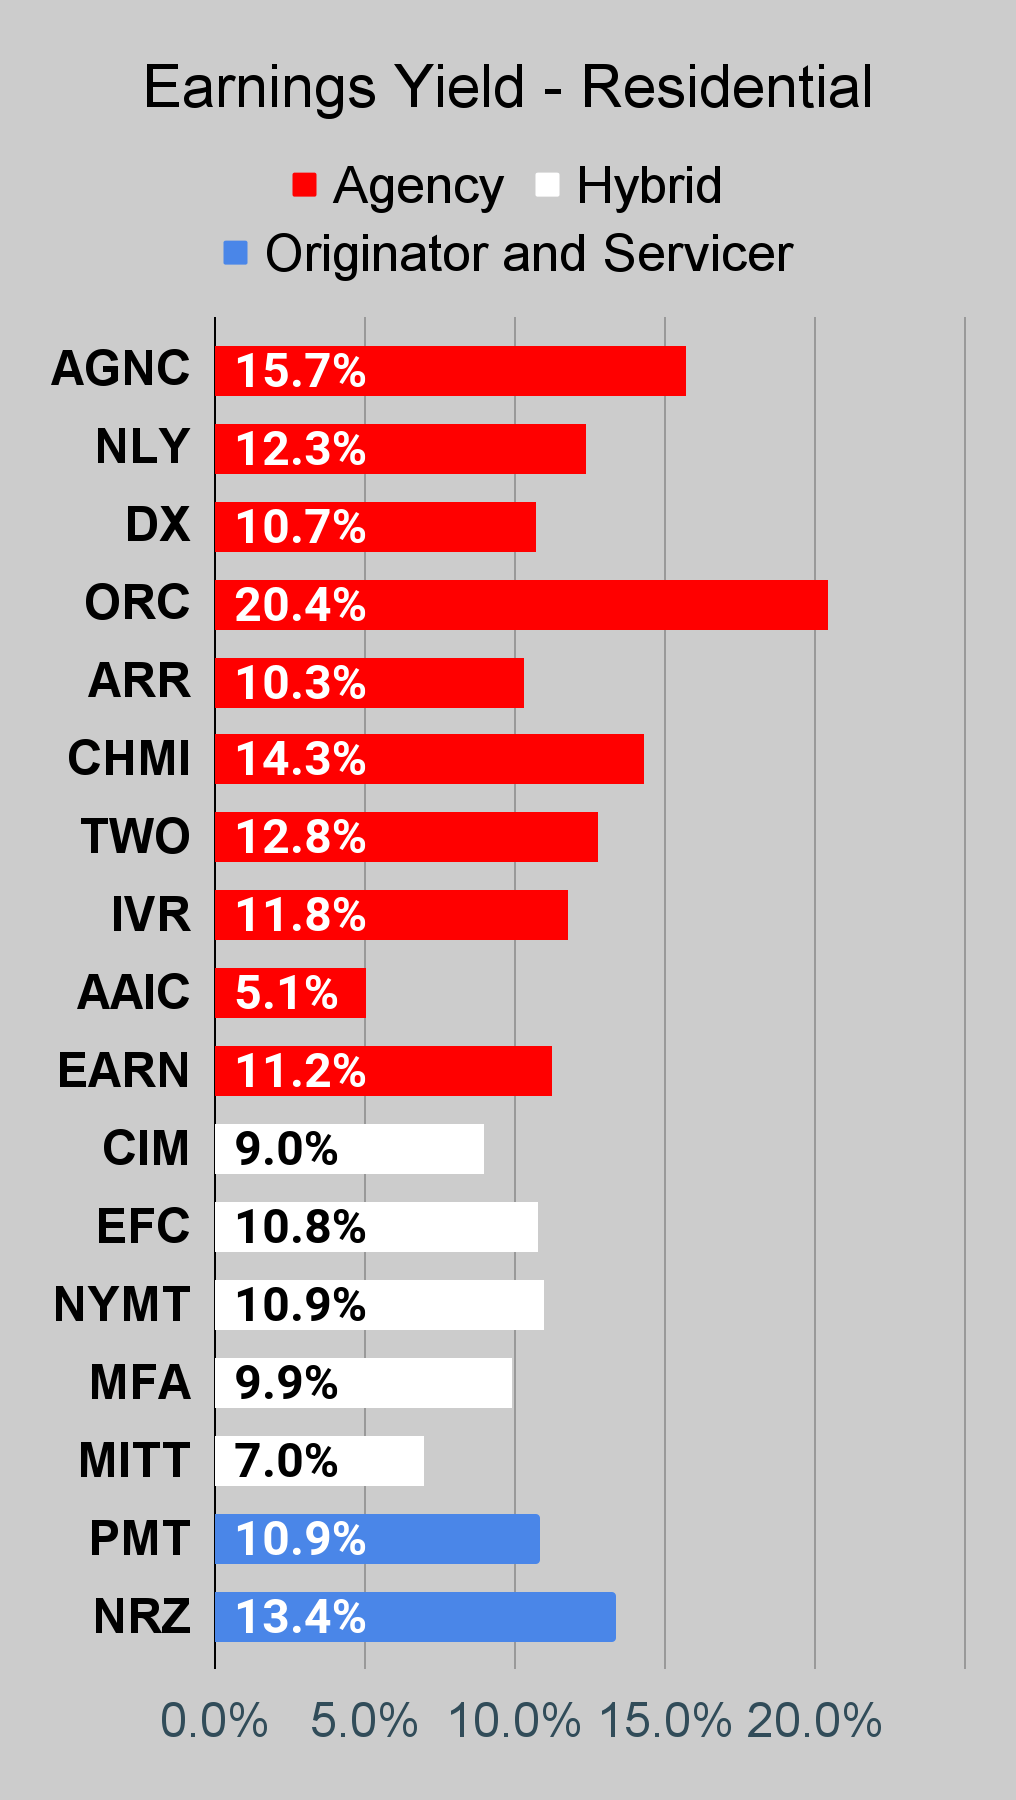
Source: The REIT Forum
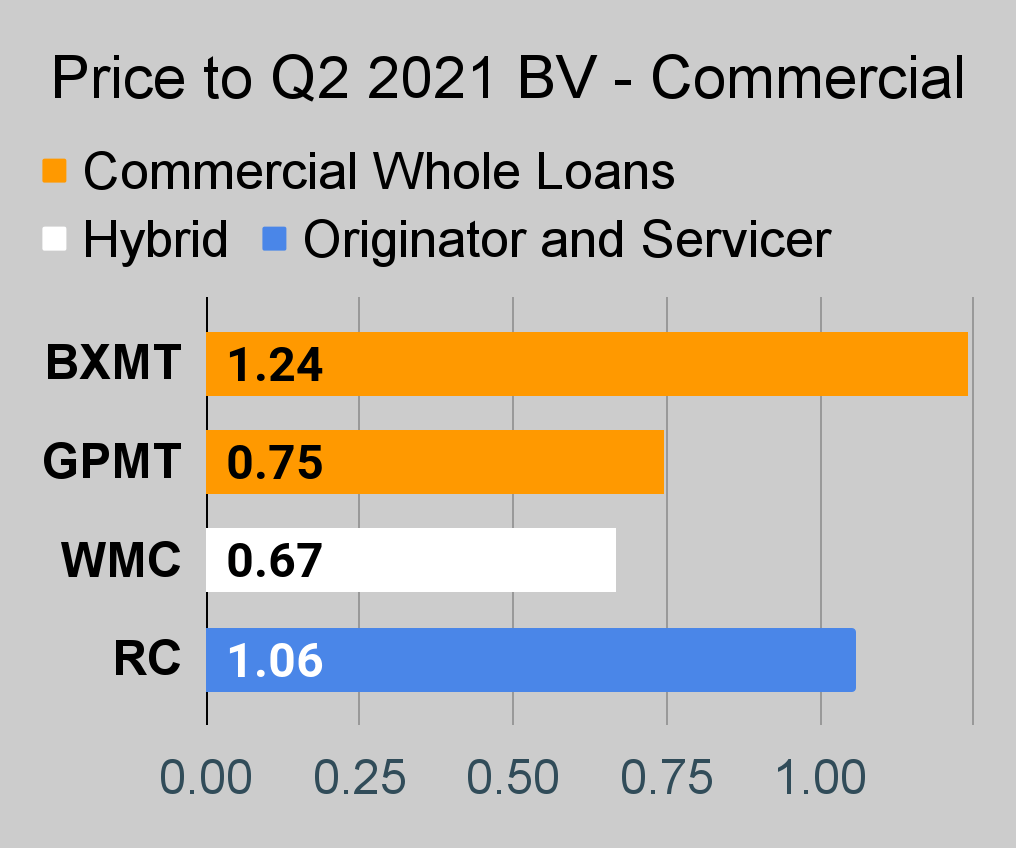
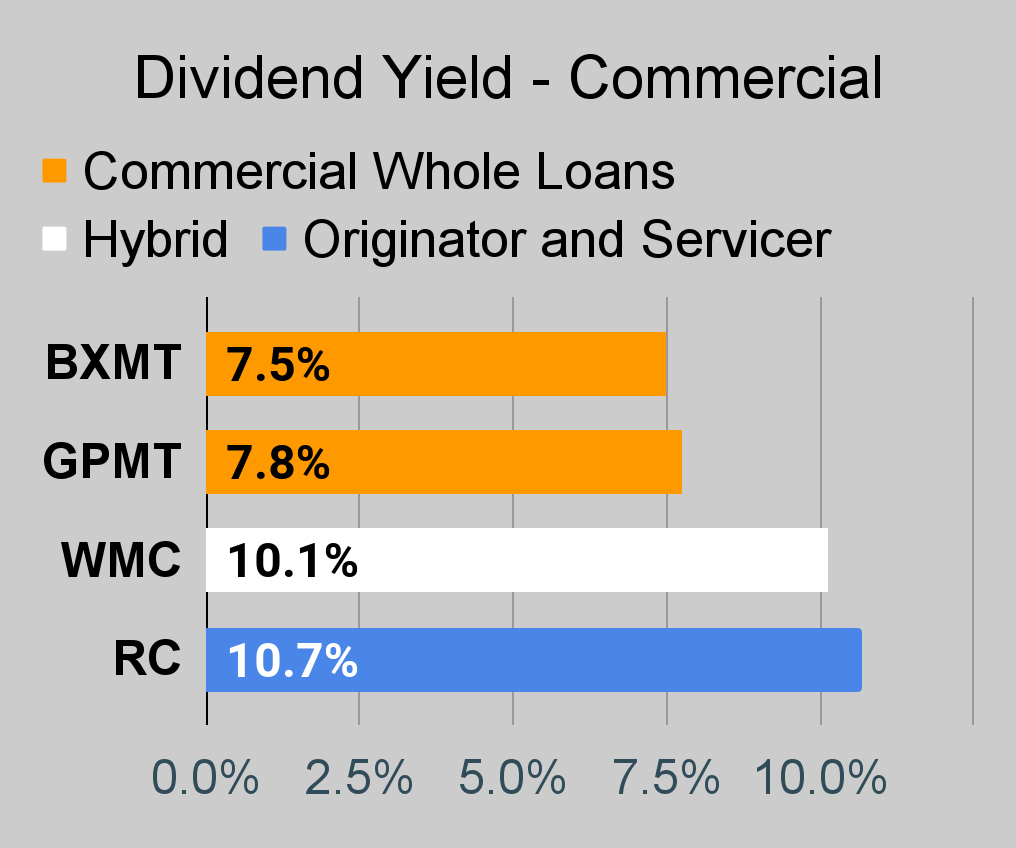
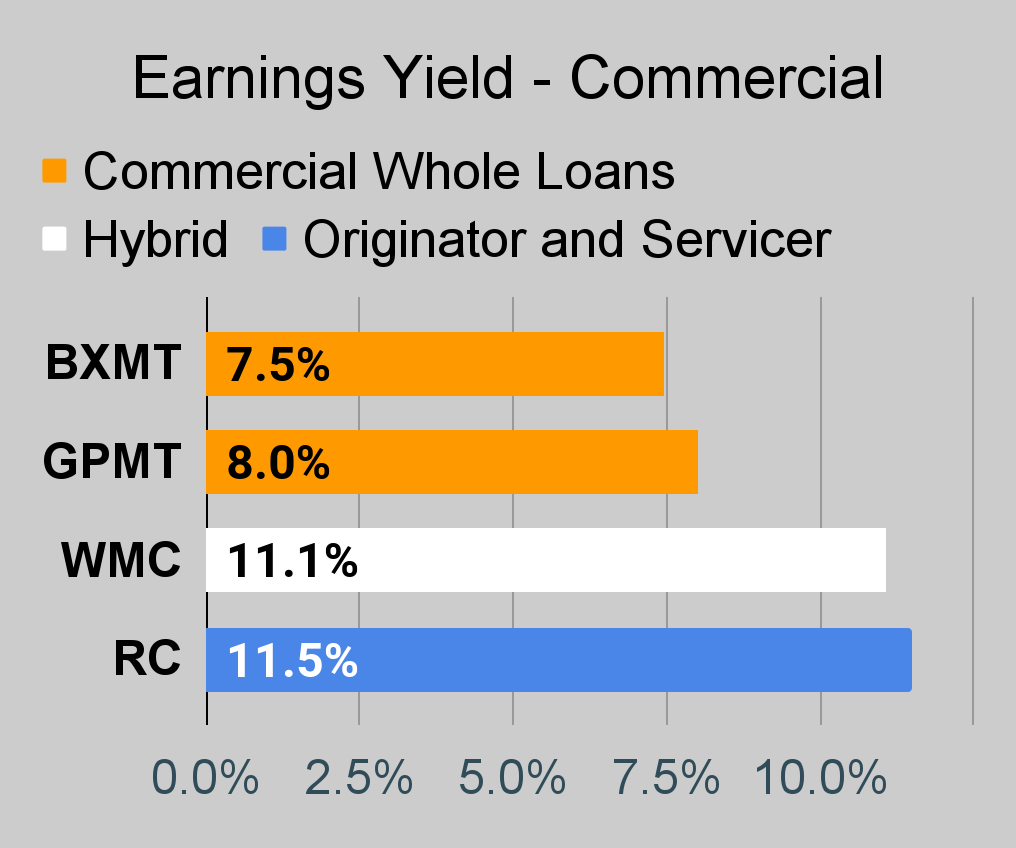
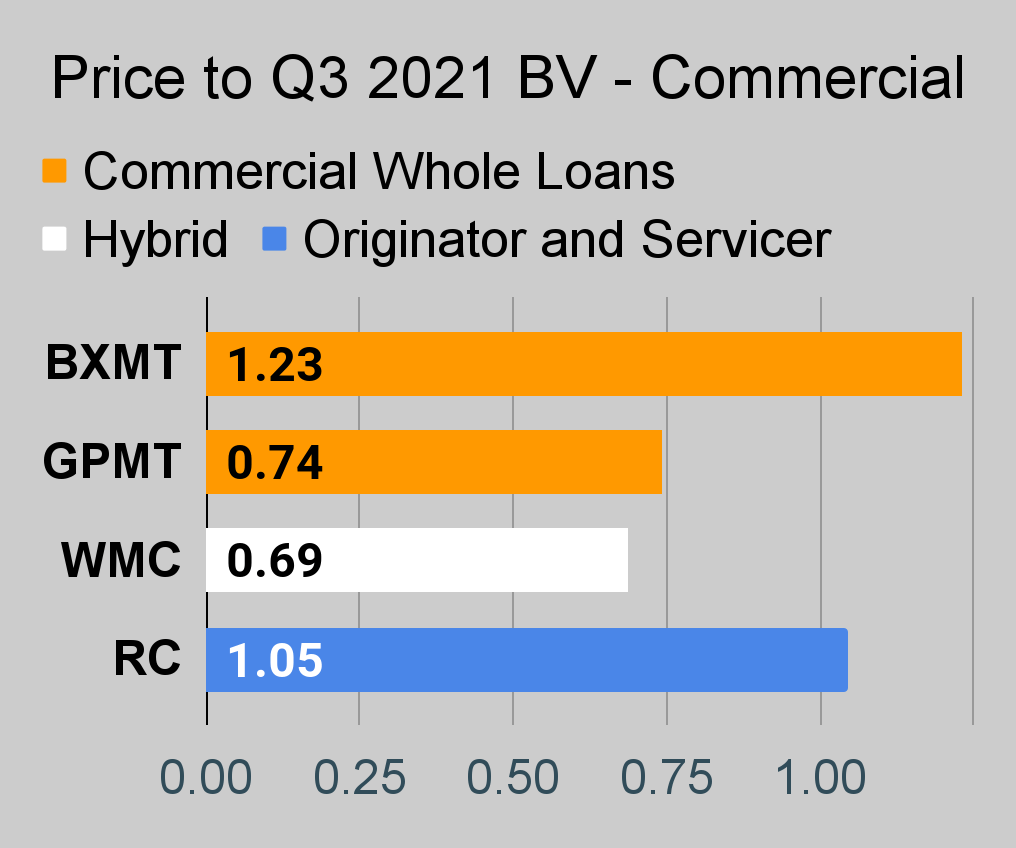
Commercial Mortgage REIT Charts
|
|
|
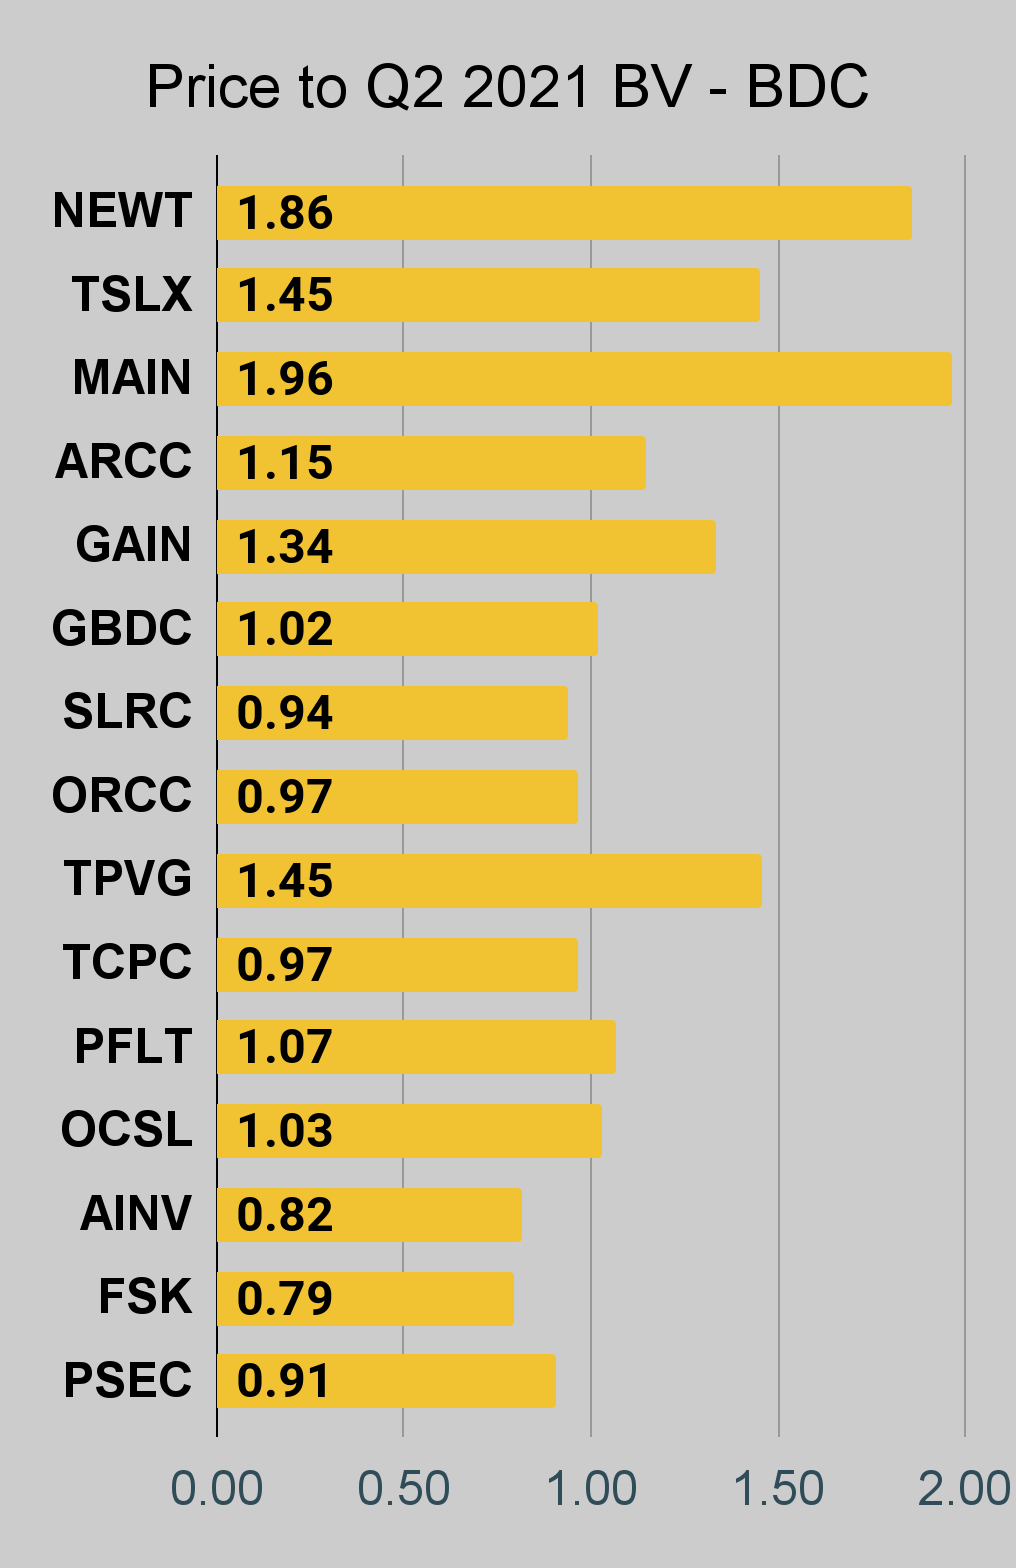
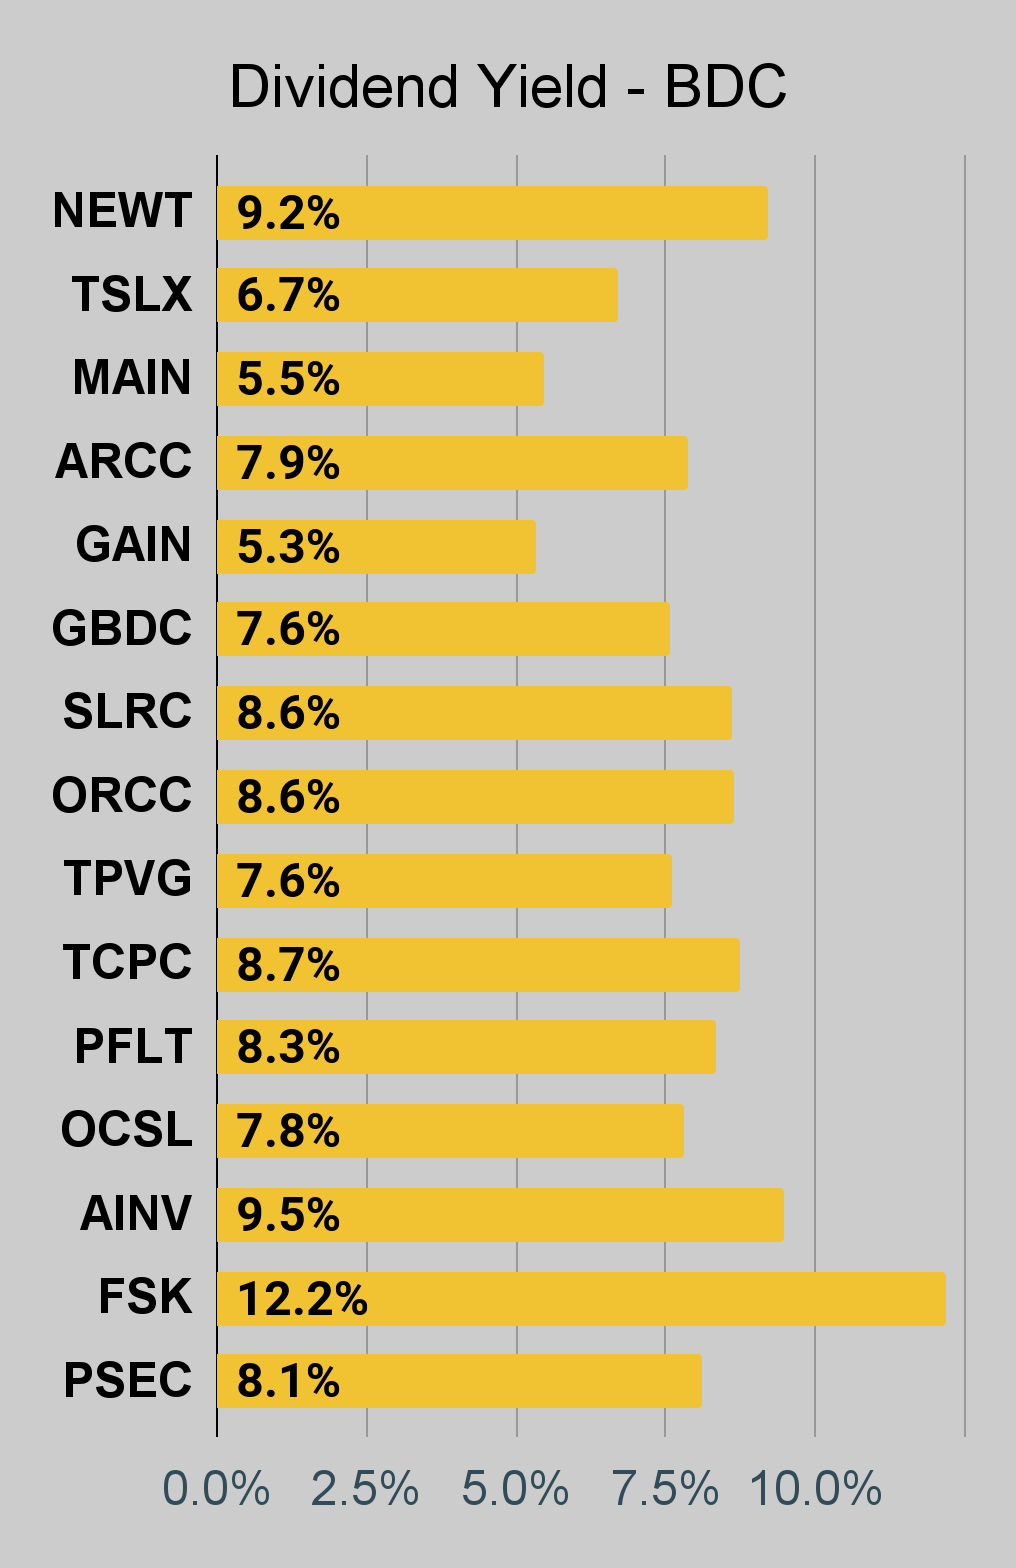
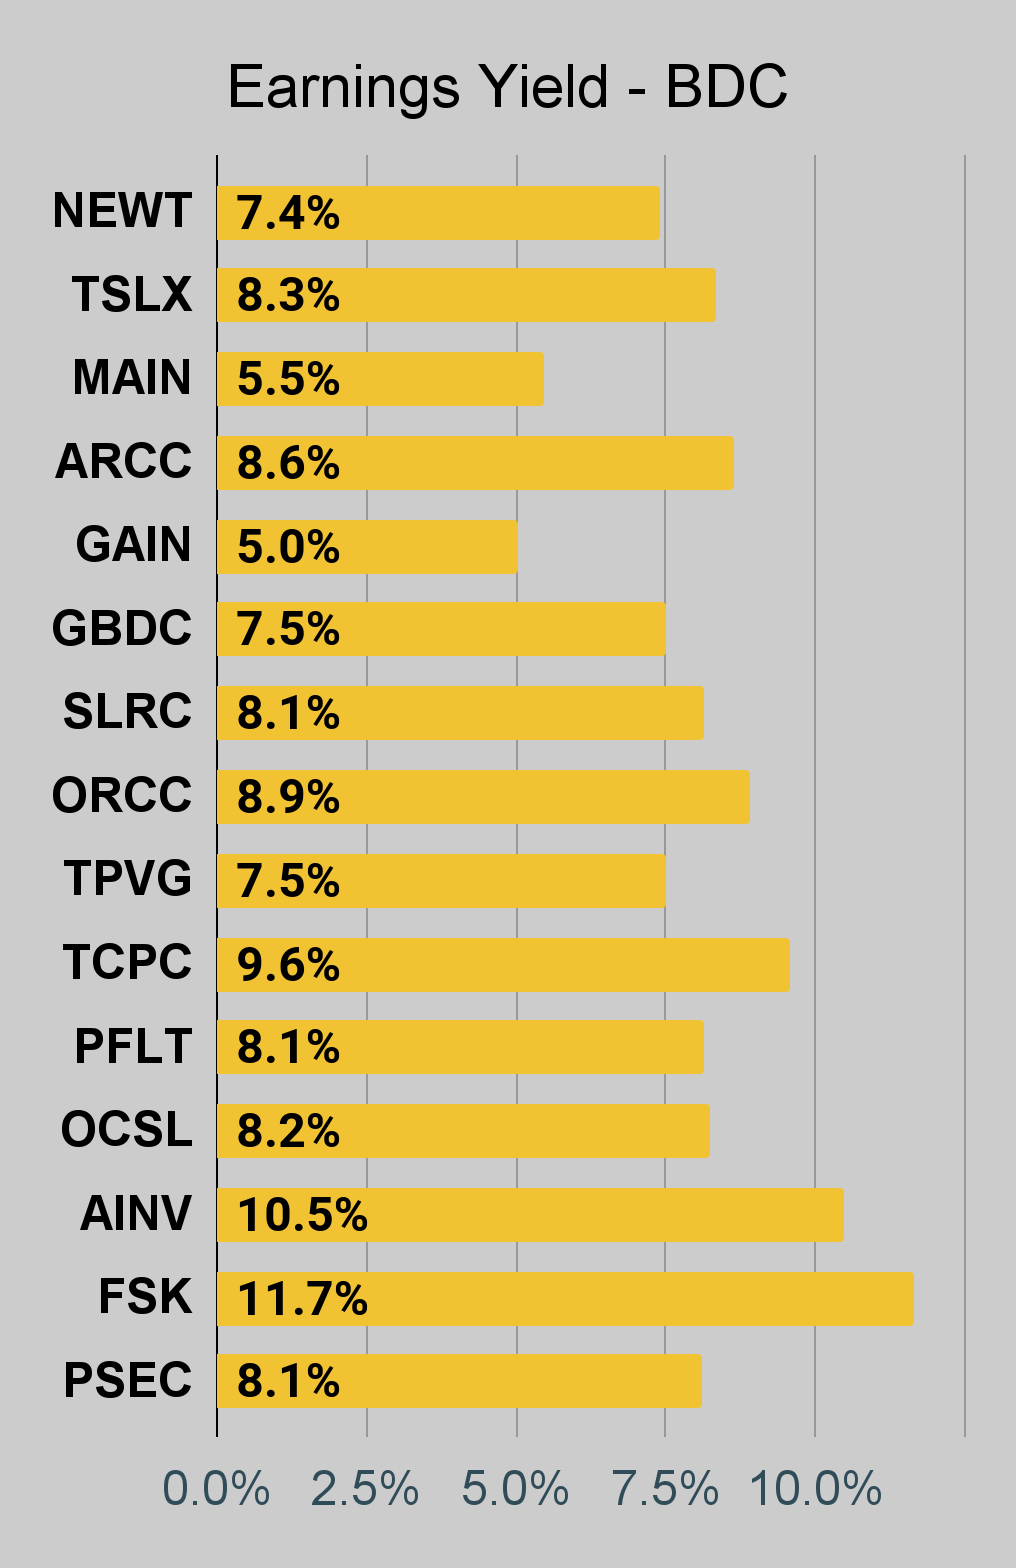
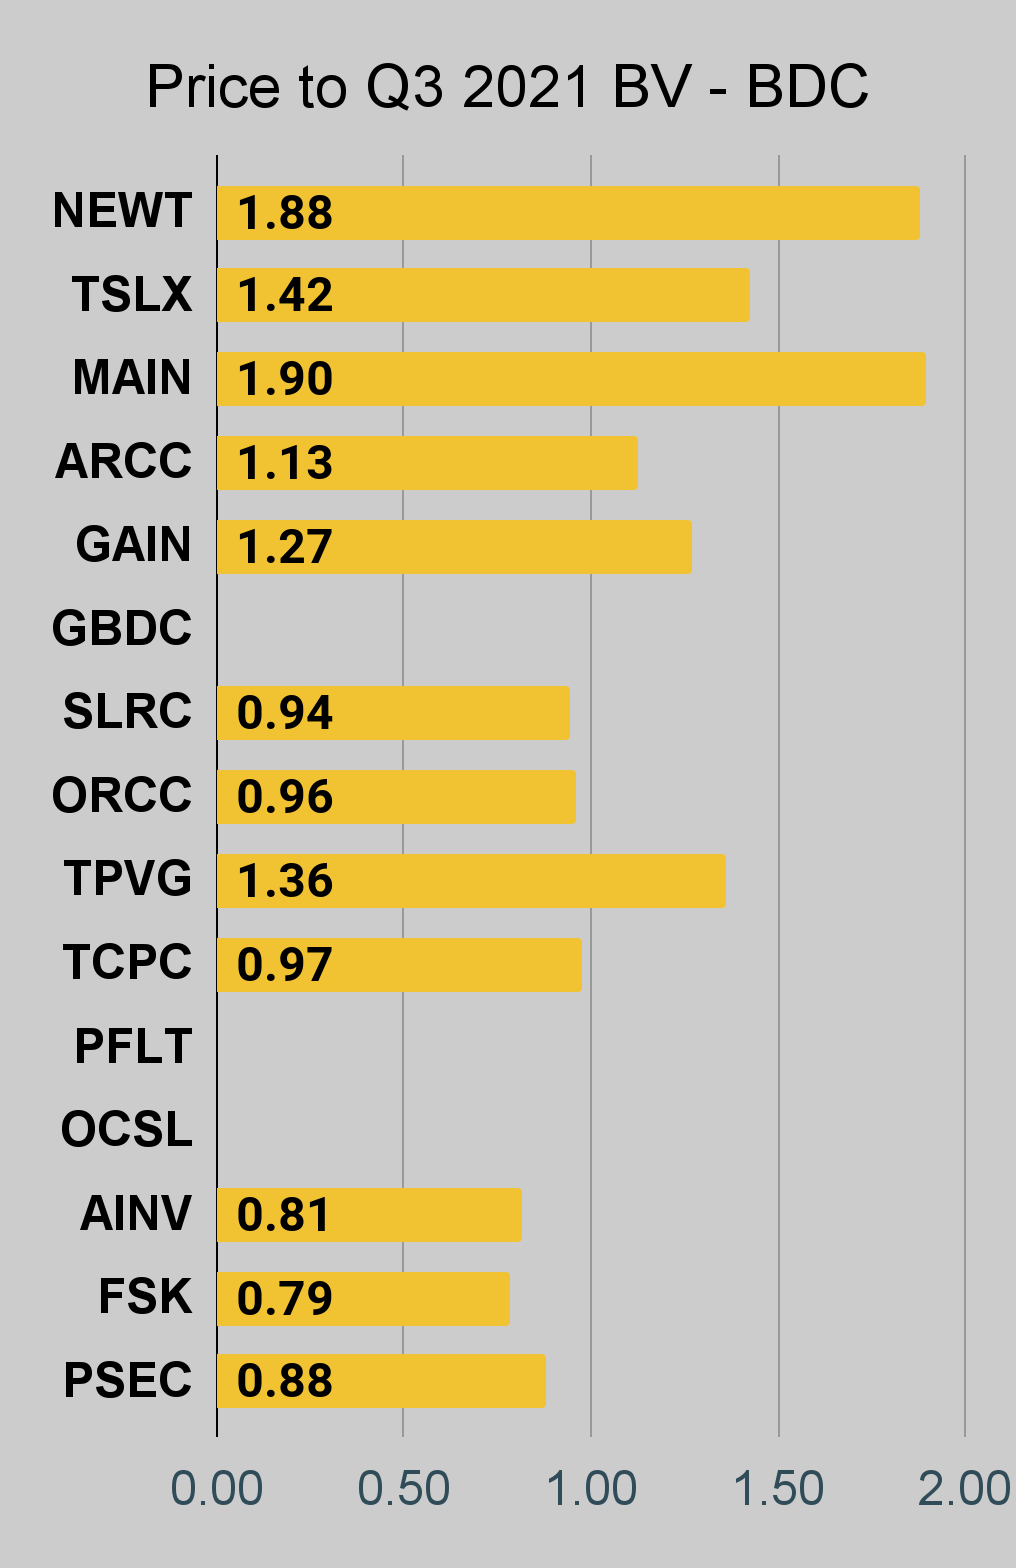
BDC Charts
|
|
|
Price to Q3 2021 Book Value
Some of these companies have already reported Q3 2021 values and some have not. Comparing a Q2 2021 value to a Q3 2021 value would be misleading, so we’re presenting the Q3 2021 values separately:
|
|
|

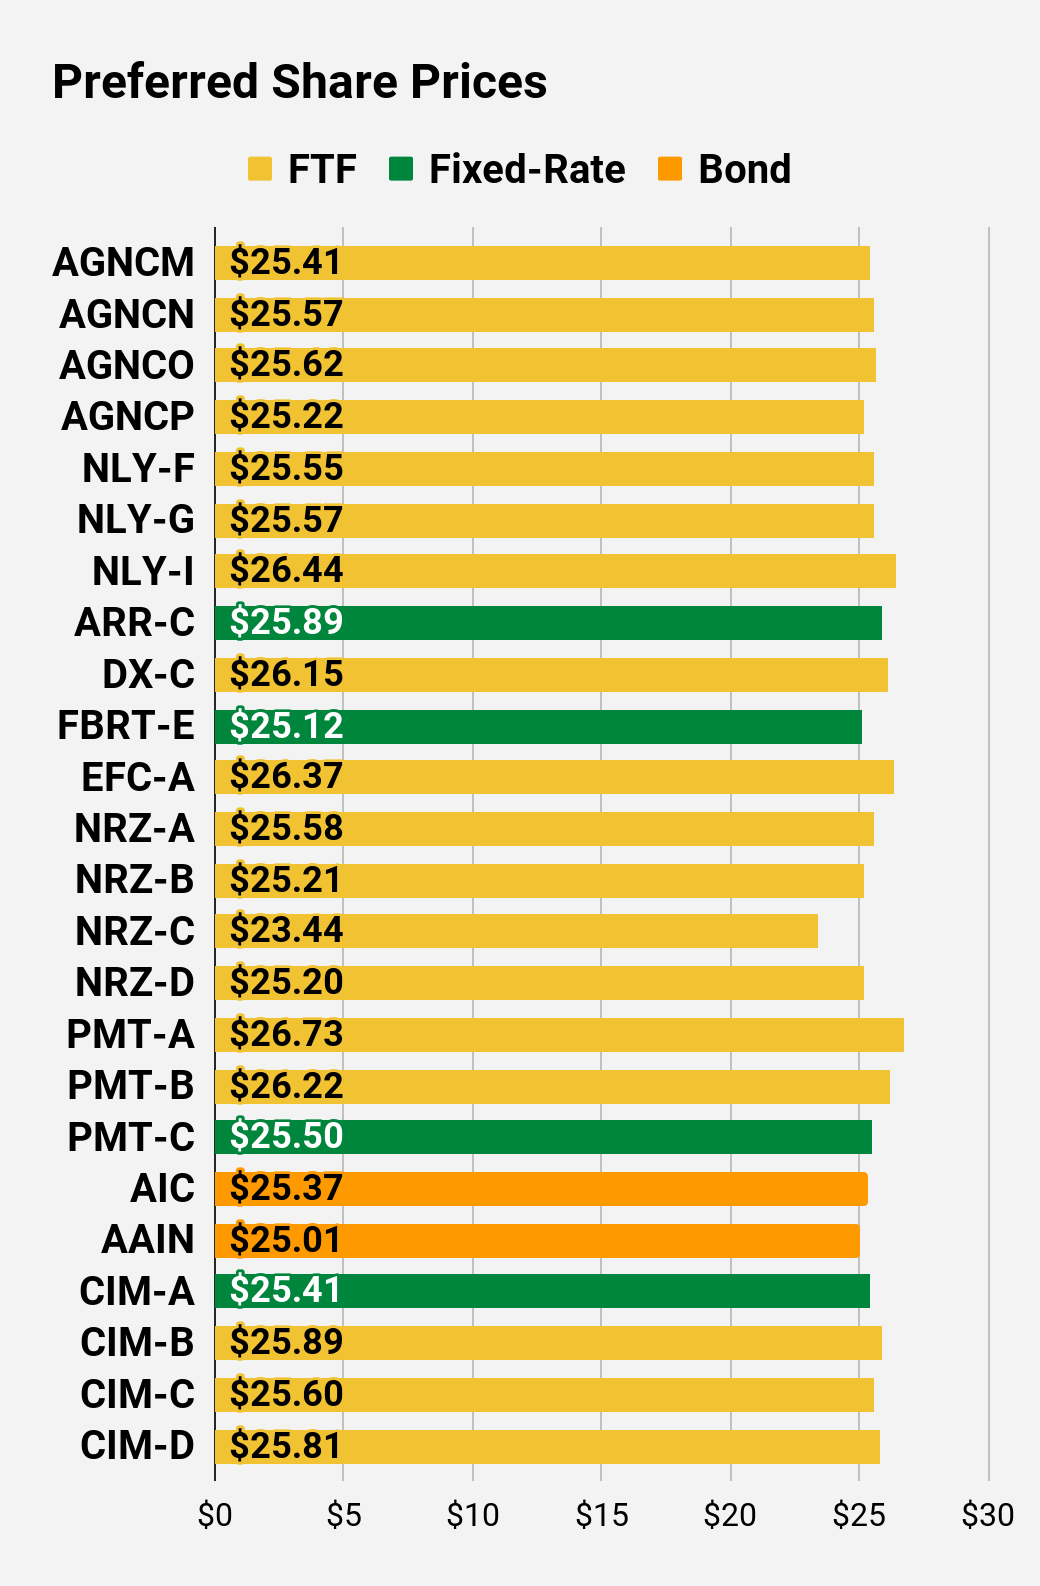
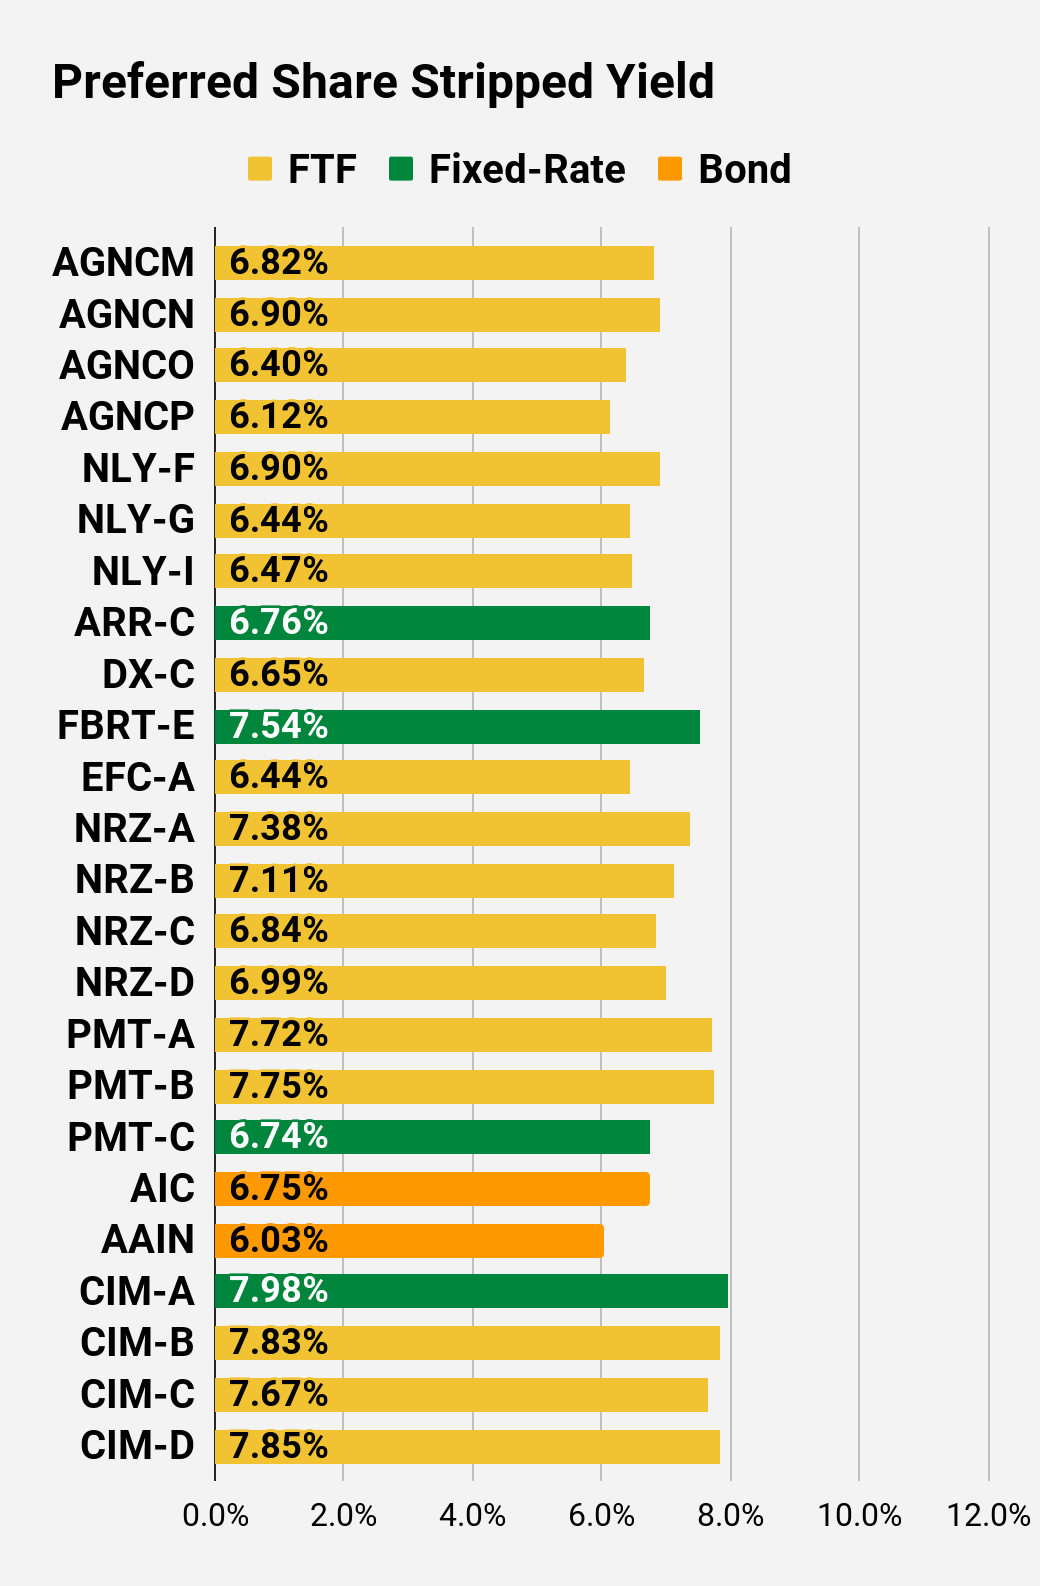
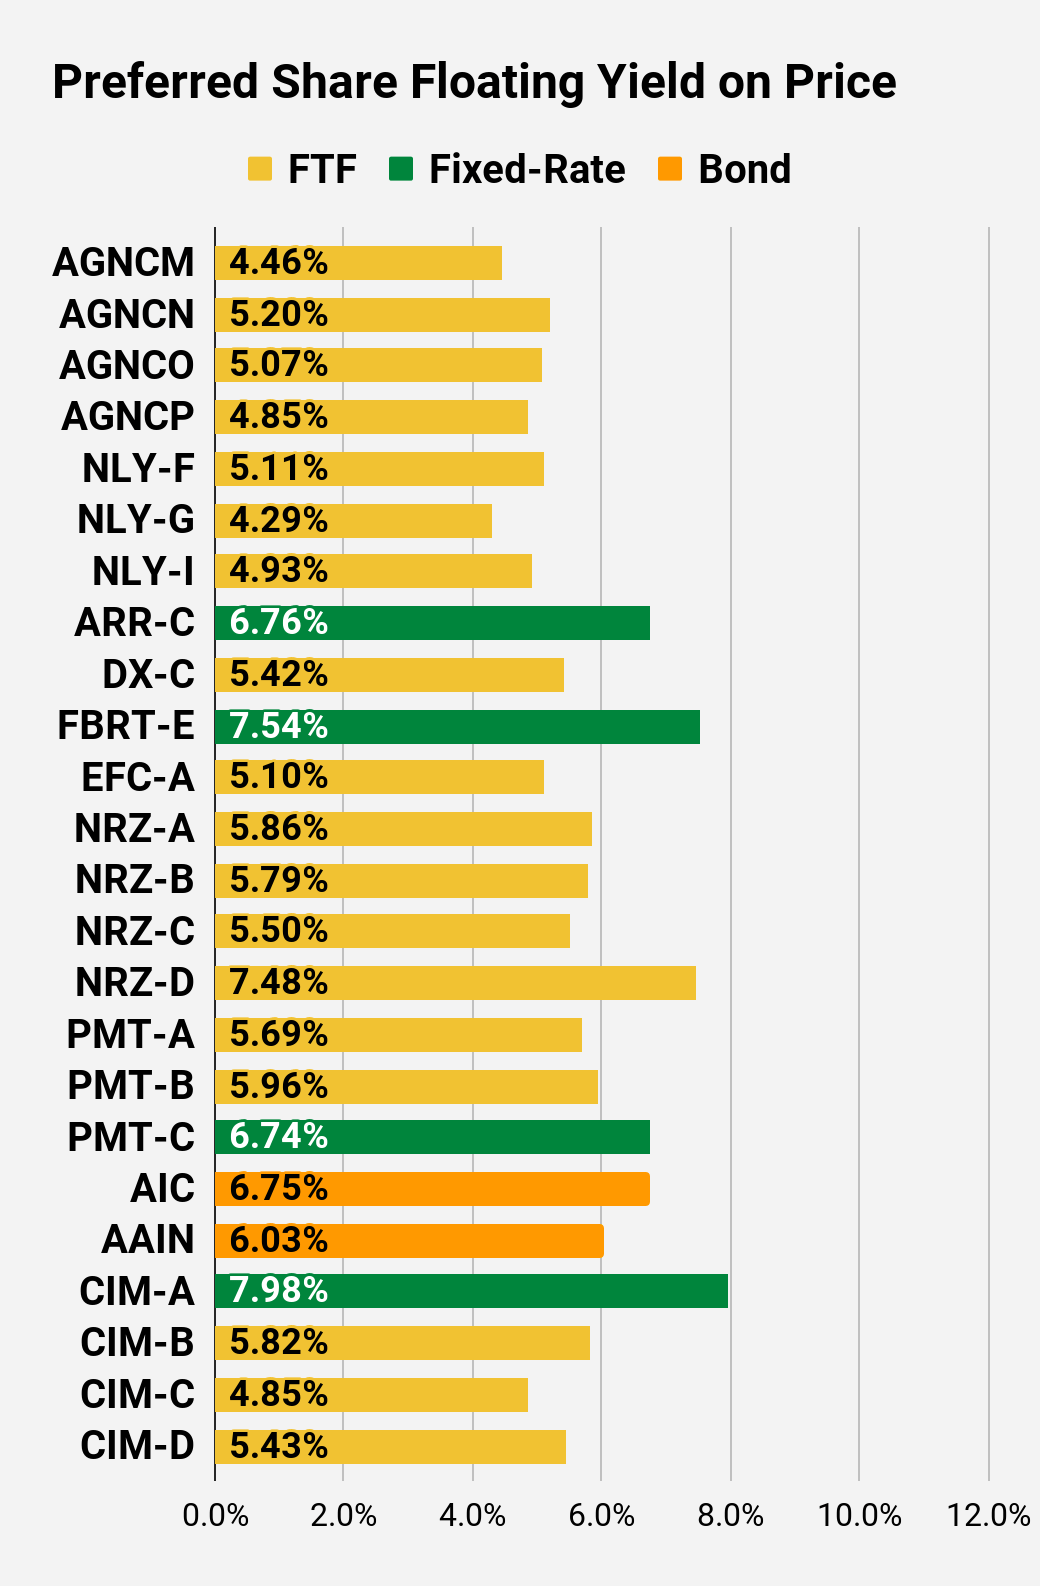
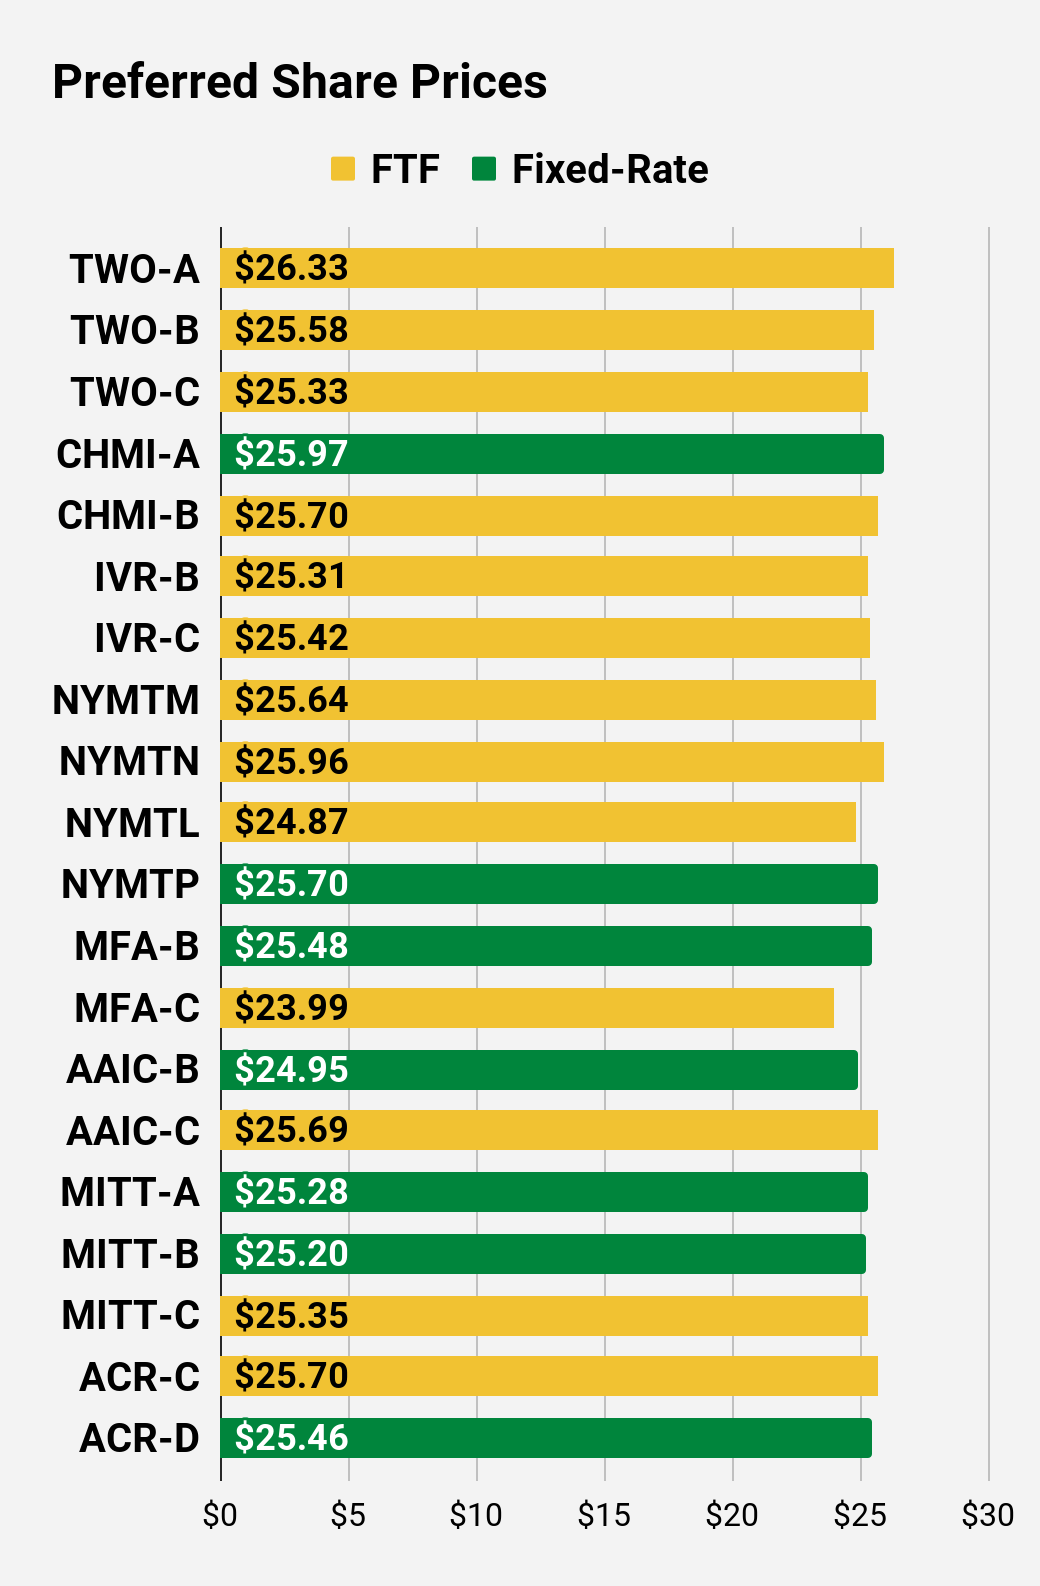
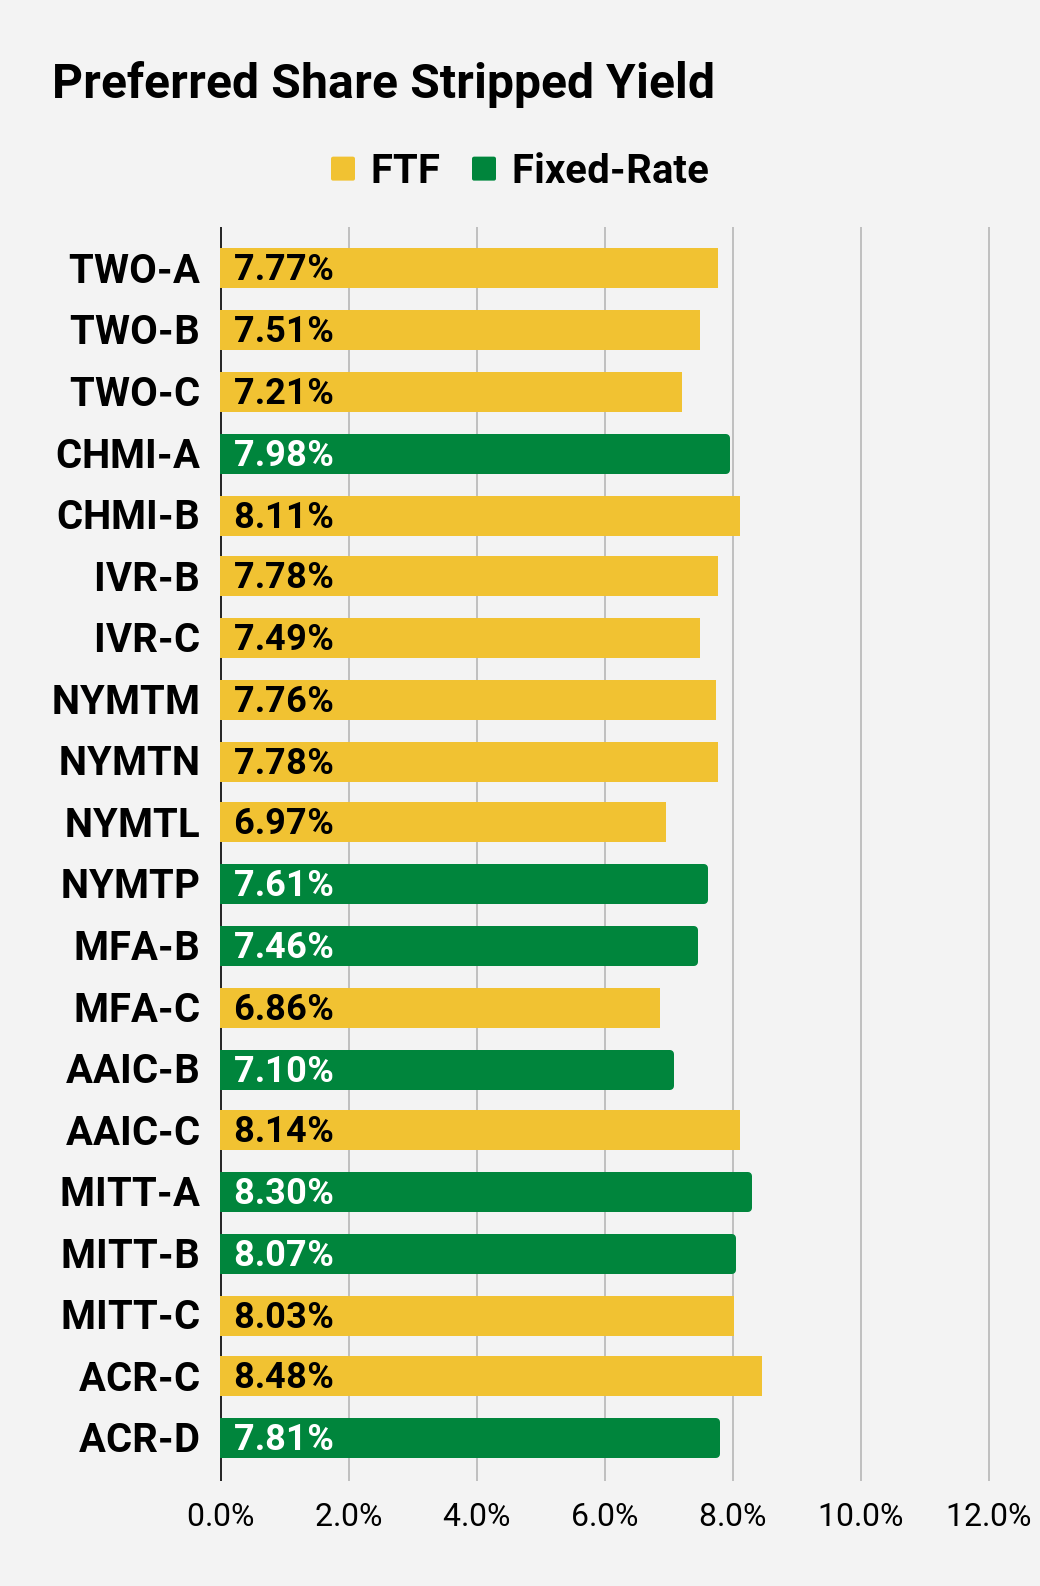
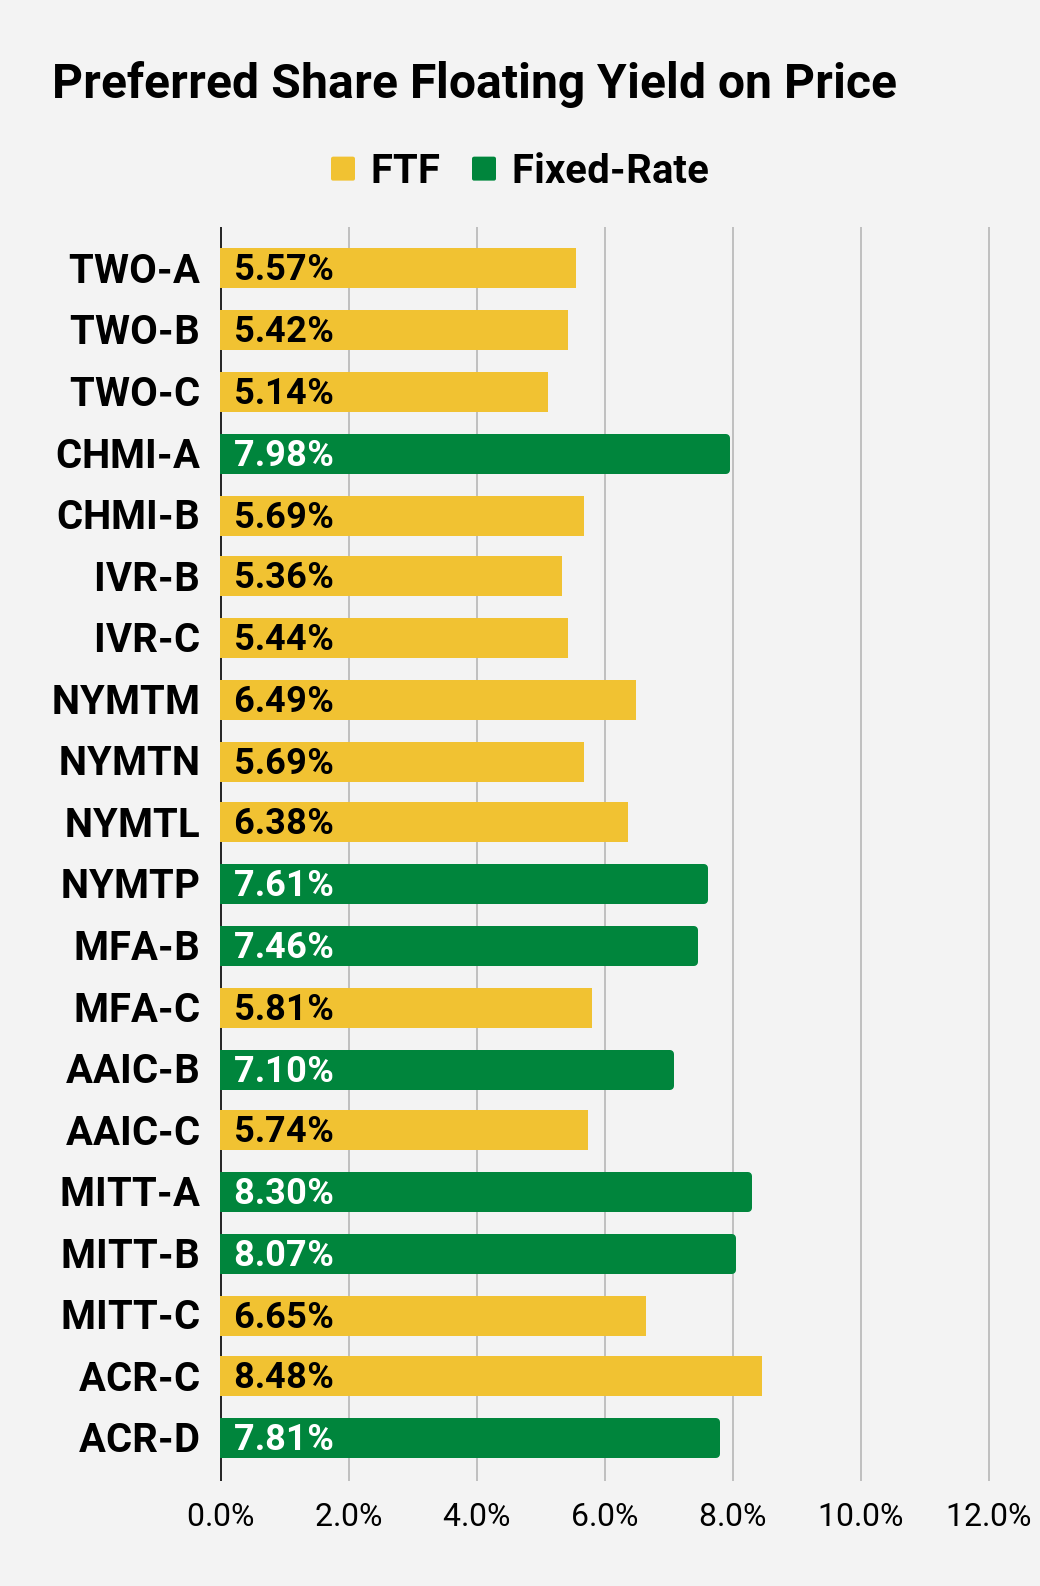
Preferred Share Charts
|
|
|
|
|
|
Preferred Share Data
Beyond the charts, we’re also providing our readers with access to several other metrics for the preferred shares.
After testing out a series on preferred shares, we decided to try merging it into the series on common shares. After all, we are still talking about positions in mortgage REITs. We don’t have any desire to cover preferred shares without cumulative dividends, so any preferred shares you see in our column will have cumulative dividends. You can verify that by using Quantum Online. We’ve included the links in the table below.
To better organize the table, we needed to abbreviate column names as follows:
- Price = Recent Share Price - Shown in Charts
- BoF = Bond or FTF (Fixed-to-Floating)
- S-Yield = Stripped Yield - Shown in Charts
- Coupon = Initial Fixed-Rate Coupon
- FYoP = Floating Yield on Price - Shown in Charts
- NCD = Next Call Date (the soonest shares could be called)
- Note: For all FTF issues, the floating rate would start on NCD.
- WCC = Worst Cash to Call (lowest net cash return possible from a call)
- QO Link = Link to Quantum Online Page
Ticker | Price | BoF | S-Yield | Coupon | FYoP | NCD | WCC | QO Link | P-Link |
$25.41 | FTF | 6.82% | 6.88% | 4.46% | 4/15/2024 | $3.89 | |||
$25.57 | FTF | 6.90% | 7.00% | 5.20% | 10/15/2022 | $1.18 | |||
$25.62 | FTF | 6.40% | 6.50% | 5.07% | 10/15/2024 | $4.26 | |||
$25.22 | FTF | 6.12% | 6.13% | 4.85% | 4/15/2025 | $5.14 | |||
$25.55 | FTF | 6.90% | 6.95% | 5.11% | 9/30/2022 | $1.19 | |||
$25.57 | FTF | 6.44% | 6.50% | 4.29% | 3/31/2023 | $1.86 | |||
$26.44 | FTF | 6.47% | 6.75% | 4.93% | 6/30/2024 | $3.20 | |||
$25.89 | 6.76% | 7.00% | 6.76% | 1/28/2025 | $4.66 | ||||
$26.15 | FTF | 6.65% | 6.90% | 5.42% | 4/15/2025 | $4.88 | |||
$25.12 | 7.54% | 7.50% | 7.54% | 12/14/2021 | $0.18 | ||||
$26.37 | FTF | 6.44% | 6.75% | 5.10% | 10/30/2024 | $3.70 | |||
$25.58 | FTF | 7.38% | 7.50% | 5.86% | 8/15/2024 | $4.59 | |||
$25.21 | FTF | 7.11% | 7.13% | 5.79% | 8/15/2024 | $4.70 | |||
$23.44 | FTF | 6.84% | 6.38% | 5.50% | 2/15/2025 | $6.75 | |||
$25.20 | FTF | 6.99% | 7.00% | 7.48% | 11/15/2026 | $8.56 | |||
$26.73 | FTF | 7.72% | 8.13% | 5.69% | 3/15/2024 | $3.35 | |||
$26.22 | FTF | 7.75% | 8.00% | 5.96% | 6/15/2024 | $4.28 | |||
$25.50 | 6.74% | 6.75% | 6.74% | 8/24/2026 | $7.94 | ||||
$25.37 | Bond | 6.75% | 6.75% | 6.75% | 12/14/2021 | $0.03 | |||
$25.01 | Bond | 6.03% | 6.00% | 6.03% | 8/1/2023 | $2.61 | |||
$25.41 | 7.98% | 8.00% | 7.98% | 12/14/2021 | $0.00 | ||||
$25.89 | FTF | 7.83% | 8.00% | 5.82% | 3/30/2024 | $4.10 | |||
$25.60 | FTF | 7.67% | 7.75% | 4.85% | 9/30/2025 | $7.15 | |||
$25.81 | FTF | 7.85% | 8.00% | 5.43% | 03/30/2024 | $4.18 |
Second Batch:
Ticker | Price | BoF | S-Yield | Coupon | FYoP | NCD | WCC | QO Link | P-Link |
$26.33 | FTF | 7.77% | 8.13% | 5.57% | 04/27/2027 | $9.83 | |||
$25.58 | FTF | 7.51% | 7.63% | 5.42% | 07/27/2027 | $10.37 | |||
$25.33 | FTF | 7.21% | 7.25% | 5.14% | 1/27/2025 | $5.56 | |||
$25.97 | 7.98% | 8.20% | 7.98% | 8/17/2022 | $0.67 | ||||
$25.70 | FTF | 8.11% | 8.25% | 5.69% | 4/15/2024 | $4.38 | |||
$25.31 | FTF | 7.78% | 7.75% | 5.36% | 12/27/2024 | $6.01 | |||
$25.42 | FTF | 7.49% | 7.50% | 5.44% | 9/27/2027 | $10.85 | |||
$25.64 | FTF | 7.76% | 7.88% | 6.49% | 1/15/2025 | $5.76 | |||
$25.96 | FTF | 7.78% | 8.00% | 5.69% | 10/15/2027 | $11.03 | |||
$24.87 | FTF | 6.97% | 6.88% | 6.38% | 10/15/2026 | $8.72 | |||
$25.70 | 7.61% | 7.75% | 7.61% | 12/14/2021 | -$0.39 | ||||
$25.48 | 7.46% | 7.50% | 7.46% | 12/14/2021 | -$0.12 | ||||
$23.99 | FTF | 6.86% | 6.50% | 5.81% | 3/31/2025 | $6.68 | |||
$24.95 | 7.10% | 7.00% | 7.10% | 5/12/2022 | $1.05 | ||||
$25.69 | FTF | 8.14% | 8.25% | 5.74% | 3/30/2024 | $4.38 | |||
$25.28 | 8.30% | 8.25% | 8.30% | 12/14/2021 | $0.18 | ||||
$25.20 | 8.07% | 8.00% | 8.07% | 12/14/2021 | $0.24 | ||||
$25.35 | FTF | 8.03% | 8.00% | 6.65% | 9/17/2024 | $5.62 | |||
$25.70 | FTF - Floor | 8.48% | 8.63% | 8.48% | 7/30/2024 | $5.23 | |||
$25.46 | 7.81% | 7.88% | 7.81% | 7/30/2024 | $4.95 |
Strategy
Our goal is to maximize total returns. We achieve those most effectively by including “trading” strategies. We regularly trade positions in the mortgage REIT common shares and BDCs because:
- Prices are inefficient.
- Long-term, share prices generally revolve around book value.
- Short-term, price-to-book ratios can deviate materially.
- Book value isn’t the only step in analysis but it is the cornerstone.
We also allocate to preferred shares and equity REITs. We encourage buy-and-hold investors to consider using more preferred shares and equity REITs.
Performance
We compare our performance against 4 ETFs that investors might use for exposure to our sectors:
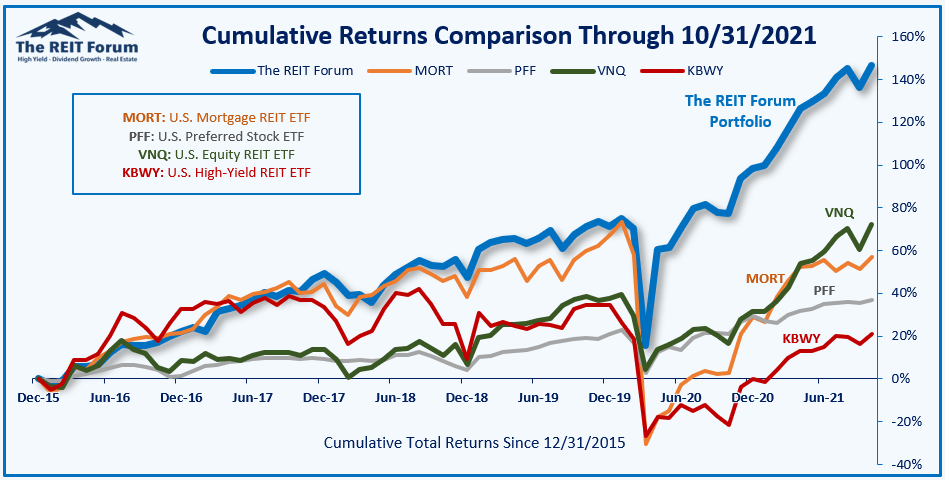
Source: The REIT Forum
The four ETFs we use for comparison are:
Ticker | Exposure |
One of the largest mortgage REIT ETFs | |
One of the largest preferred share ETFs | |
Largest equity REIT ETF | |
The high-yield equity REIT ETF. Yes, it has been dreadful. |
When investors think it isn’t possible to earn solid returns in preferred shares or mortgage REITs, we politely disagree. The sector has plenty of opportunities, but investors still need to be wary of the risks. We can’t simply reach for yield and hope for the best. When it comes to common shares, we need to be even more vigilant to protect our principal by regularly watching prices and updating estimates for book value and price targets.
Ratings:
- Bullish on DX, PMT, NRZ-D
If you want access to our entire portfolio and all of our current top picks, feel free to join us:
 We have over 1600 happy customers and we're currently offering investors a special 20% discount for their first year. This is a great time to try the service.