klmax/iStock via Getty Images
If I pull up a daily chart of Juniper Networks (NYSE:JNPR), it can be seen that shares are at a crossroads at present. I state this because shares have lost the 10-day moving average and now are at risk of losing the 50-day moving average also. If the 50-day fails, the next logical destination for the share price would be the 100-day which is currently at the $31.78 mark. This level has provided solid support for shares over the past 12 months (and once more in January of this year) so we would be banking on this taking place once more. The 200-day average ($29.55) has not been breached in well over two years which demonstrates that Juniper clearly remains in a bull market despite the elevated volatility we have seen this year.
Juniper shares fighting to remain above support (Stockcharts)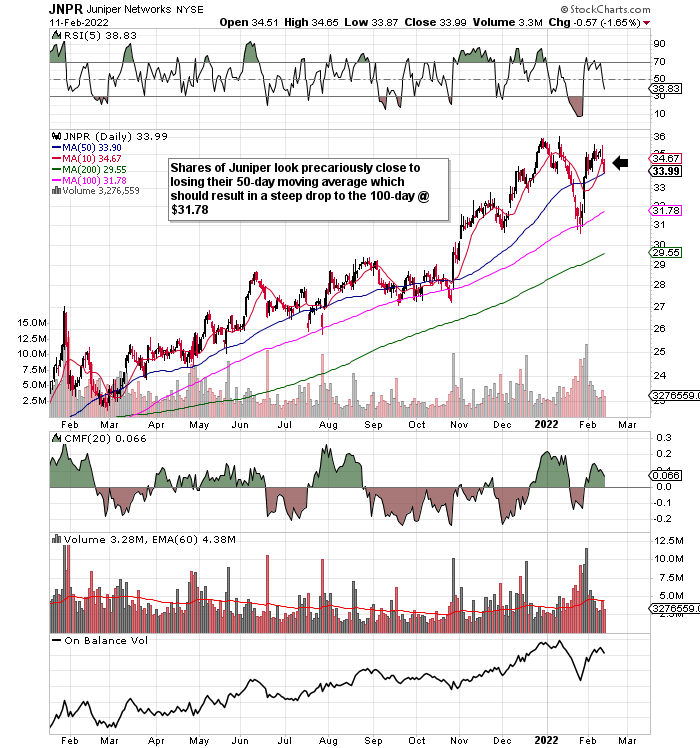
From a long standpoint, I would prefer to see a successful test of the 200-day average support level in this present downswing. The reason being is that this would set up an attractive buying opportunity if indeed the fundamentals of Juniper stacked up at the time. One way to ascertain the strength of the company is to evaluate the key trends of the dividend to see if there is strength in this area. The reason being is that the trends of the key financial metrics which make up the dividend come from all three of the financial statements. This invariably means that a strong dividend usually points to strong fundamentals in the long run.
Dividend Yield
Juniper's dividend yield (FWD) comes in at 2.47%. The company's yield is running slightly ahead of the sector's 1.44% average and also Juniper's 5-year average of 2.67%. This is understandable given my comments earlier on how Juniper has been in a solid bull run for over two years now. Investors use the yield as a barometer on whether shares are cheap or not but Juniper's yield would quickly bounce back to its 5-year average for example if the 100-day average quickly comes into play here once more.
Dividend Growth
There is no getting away from the fact that near-term growth rates of the dividend are poor compared to the average in this sector. Juniper's 5-year dividend growth rate (CAGR) for example comes in at almost 15%. We are nowhere near this growth rate at present although the company's 5% quarterly increase recently to $0.21 per share gives room for encouragement. I state this because growth in the dividend fosters confidence concerning earnings growth going forward. Furthermore, as inflation continues to rear its ugly head, growth in the payout is now more important than ever in order to protect shareholder purchasing power. To see if this increase is easily covered by cash, we go to the cash flow statement.
Free Cash Flow
Juniper generated $116 million of operating cash flow in Q4 which resulted in $0.27 per share of free cash flow. Free cash flow covered the dividend although management bought back almost $150 million of its own stock during the quarter. The annual free cash flow number however of $1.82 per share looks far healthier as it shows the fire-power (Pay-out ratio of under 44%) in which management can continue to reward shareholders. Investors have to be careful here though with payout ratios as a company's assets and liabilities can be temporarily altered in order to boost cash flow in the near term.
Therefore, although metrics and trends discussed up to now are helpful, they are not forward-looking in nature. Therefore, to gauge the future sustainability of the payout, we like to go to trends in metrics such as the firm's debt to equity ratio as well as forward earnings projections.
Debt To Equity Ratio
In terms of Juniper's balance sheet, $1.68 billion of long-term debt was reported at the end of Q4 as opposed to $4.31 billion of shareholder equity. Although this looks sustainable (debt to equity ratio of just under 0.4) on the surface, it must be pointed out that Juniper still has over $3.7 billion of goodwill in the asset section of the balance sheet. Suffice it to say, sustained growth (at a rate the market will demand) needs to be in the pipeline here to ensure this goodwill stays on the balance sheet at full value.
Income Statement
This brings us to the income statement where we saw revenues of $1.299 (6% rolling quarter growth) million in the fourth quarter and non-GAAP Earnings of $0.56 per share. The encouraging trend here is that top-line growth which is a victory in itself given the supply chain bottlenecks which are plaguing many markets. Although revenues also grew for the full fiscal year, core net profit was slightly down in 2020 due to higher costs. The trends in the backlog however as well as growth in the cloud business lead us to believe that we will indeed witness strong double-digit bottom-line growth next year and beyond. This is obviously bullish for the dividend.
Conclusion
Juniper has all the signs of needing to reset its valuation somewhat (hence the recent volatility) before finding a firm bottom. The dividend however looks well covered and the company's strong balance sheet, as well as earnings trends, bode well for the pay-out going forward. We look forward to continued coverage.
----------------------
Elevation Code's blueprint is simple. To relentlessly be on the hunt for attractive setups through value plays trading under intrinsic value. To constantly put ourselves in positions where we have limited downside but yet significant upside always remains the objective of the portfolio.
-----------------------