Philip Steury/iStock via Getty Images
I'm a big believer in owning what are called high quality compounders, or stocks with consistently high returns on invested capital that outperform over time. These stocks often have characteristics such as high earnings multiples, topline growth consistently above GDP, and margin expansion over time. High quality compounders that come to mind are Brown-Forman (BF.B), Rollins (ROL), S&P Global (SPGI), Visa (V), Pool Corp (POOL), and even the large tech firms. While all of these differ drastically from one another, they generally tend to be dominant players in their respective industries and earn high returns on invested capital. However, return on invested capital cannot be viewed in isolation. High quality companies operating in mature industries will have trouble investing new cash and earning the same level of high returns their legacy business enjoyed. They will have to choose between investing in lower returning opportunities or distributing the free cash flows; Clorox (CLX) and Hershey (HSY) are good examples of this. Admittedly, compounders can be difficult to value for the following reasons:
- Growth cannot continue above GDP forever.
- Margins cannot expand forever.
- It is unknown if or when new investment opportunities will dry up.
After pulling back over 15% over the past few months, I decided to brush up on one of my favorite compounders, Estee Lauder (NYSE:EL), and attempt to value it.
Estee Lauder is one of the leading manufacturers, marketers, and sellers of quality skin care, makeup, fragrance and hair care products across the world. The company operates a multitude of brands and is a consistent acquirer of up-and-coming brands.
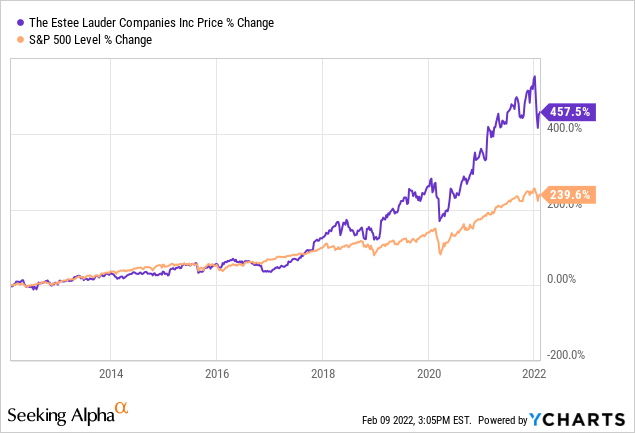
Estee Lauder is a high quality compounder that has handily outperformed the S&P 500 over the past decade.
It is important to know if Estee Lauder's outperformance is due to an expansion in the multiple, which may indicate the company is overvalued based upon its historical pricing multiples. Below is the EV to EBITDA multiple over the past ten years.
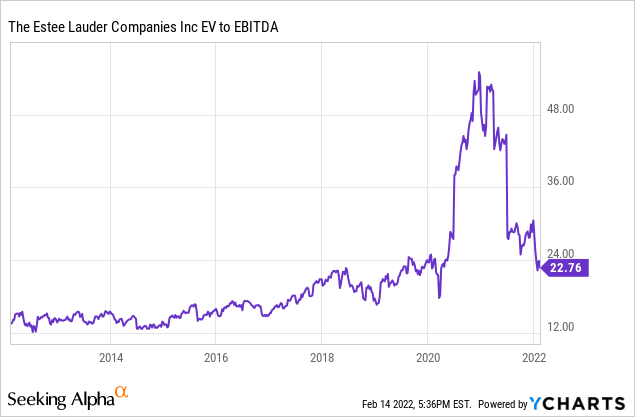
While Estee Lauder's multiple has expanded, it has come down closer to pre-pandemic levels. Accordingly, Estee Lauder's outperformance primarily stems from the company's high return on invested capital (ROIC), which has consistently exceeded 15%.
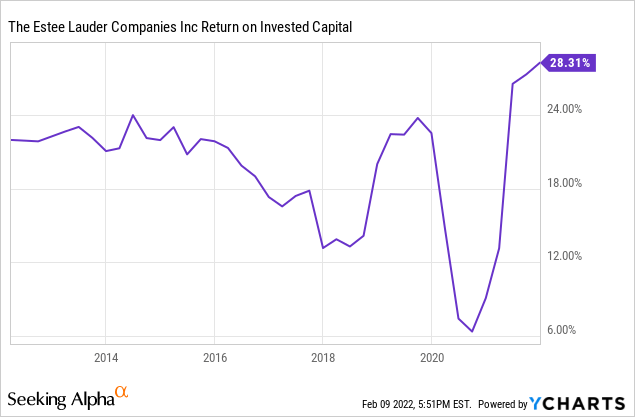
Estee Lauder's high returns on invested capital is driven by the stickiness of its brands and addition of new brands over time.

Estee Lauder has a dual share structure with the Lauder family controlling approximately 85% of the voting power of the common stock. While some may see it as a negative, I see it as a positive given the family's conservative use of debt and its managers efficient allocation of capital over time.
Starting with the financial statements, it appears that the company suffered from the pandemic but there were large impairment charges that skew the results. On a normalized EBITDA basis (excluding restructuring and impairment charges), Estee Lauder actually grew during the pandemic.
| 2019 | 2020 | 2021 | TTM 12/31/21 | |
| Norm. EBITDA | 3,244 | 3,528 | 3,715 | 4,191 |
| Norm EBITDA Margin | 21.83% | 24.68% | 22.91% | 23.64% |
Management expects robust sales growth of 10%-12% for the fiscal year ending June 30, 2022.
I prepared a discounted cash flow model to project out Estee Lauder's cash flows over the next ten years. Before diving into the assumptions, it is important to talk about the two most subjective points, which are revenue growth and margin expansion. Since 2010, Estee Lauder has grown revenue at a rate of 6.88% per year to 2021 and 7.41% per year to the trailing twelve months ending December 31, 2021. Management has indicated that long-term, the company expects to return to its growth targets of 6% to 8% sales growth. What is unclear is what is management's definition of long-term? Whether it is 10 years or 20 years, by definition it cannot be forever.
In addition to revenue growth, Estee Lauder has a consistent history of expanding margins.
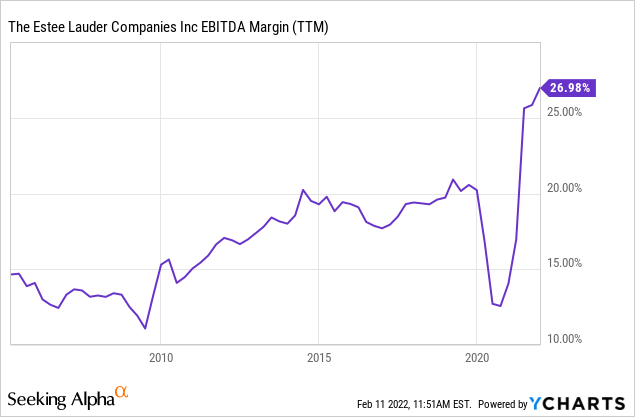
From 1999 to the trailing twelve months ending December 31, 2021, Estee Lauder's EBITDA margins have increased approximately 2.19% per year. In addition, management stated it expects operating margins to expand approximately 50 basis points (0.50%) per year in the long-term.
Past performance does not translate into future results, but upon running my DCF, it appears the market has already priced in revenue growth and/or margin expansion.
I prepared a 10-year DCF based on the following assumptions (using calendar years and not fiscal years):
- Topline revenue growth of 8% for 3 years, 7% for 3 years, 6% for 3 years, and 4% in year 10.
- Gross profit margins of 78.5% which was approximately the average from 2017-2019.
- EBITDA margins are anticipated to increase by approximately 2% per year until the 10th year. This is slightly lower than EBITDA margin growth of 2.19% over the past few decades.
- Depreciation is estimated to grow with revenue by 7% in 2022, 6% in 2023 and 2024.
- No restructuring charges, goodwill impairment, or intangible asset impairment costs are forecast.
- Taxes are estimated at 23% or management's expected normalized tax rate.
- Changes in net working capital (including cash) is estimated at 21% of revenue, or the average from 2017-2019. Management indicated that working capital is going to return to a more normalized level.
- Capital expenditures are estimated at 4.5% of revenue which is in-line with most historical periods.
For a discount rate, I utilized a cost of equity of 8%, which was based upon the forward looking return estimates for large cap stocks of 6%-9% as reported by Aswath Damodaran. For a cost of debt I utilized Estee Lauder's weighted average after-tax cost of debt of approximately 2.7% for the fiscal year ending June 30, 2019 (cost of debt of 3.5% tax impacted at the normalized tax rate of 23%). This assumes interest rates move back to pre-pandemic levels. A debt weighting of only 5% is applied given Estee Lauder's historical aversion to debt. This resulted in a weighted average cost of capital (WACC) of 7.73%.
For the terminal period, I utilized various long-term growth rates as these are the most subjective inputs to the model. It is important to remember that long-term growth estimates for a terminal value represent growth in perpetuity. This becomes a theoretical problem when using growth rates above long-term GDP as the business will eventually become larger than the U.S. economy. Alternatively, using long-term growth rates above GDP may not be unreasonable since a business may experience a period of growth above GDP in earlier years and then growth below GDP in later periods. This could result in an effective growth rate higher than long-term GDP estimates. The DCF resulted in the following values under the different terminal growth assumptions.
| 3% LT Growth | 4% LT Growth | 5% LT Growth | 6% LT Growth | |
| Present Value of Cash Flows | 27,693 | 27,693 | 27,693 | 27,693 |
| Present Value of Terminal Value | 62,936 | 79,684 | 108,680 | 171,106 |
| Total Enterprise Value | 90,629 | 107,377 | 136,373 | 198,799 |
| Less: Debt | (5,531) | (5,531) | (5,531) | (5,531) |
| Market Value of Equity | 85,098 | 101,846 | 130,842 | 193,268 |
| Divided By: Shares Outstanding | 360.60 | 360.60 | 360.60 | 360.60 |
| Price Per Share | $235.99 | $282.44 | $362.85 | $535.96 |
Based on EBITDA margins expanding for 10 years and revenue growth in management's long-term range, it appears the market is pricing in continued growth of approximately 4%-5% beyond year 10. To run another scenario, I ran another DCF with the same assumptions as the previous DCF but took it out 20 years. Revenue growth was estimated at 6% per year in years 7-20 and margins were estimated to expand for 10 years (same as previous DCF) and then held constant in years 11-20.
| 3% LT Growth | 4% LT Growth | 5% LT Growth | 6% LT Growth | |
| Present Value of Cash Flows | 53,817 | 53,817 | 53,817 | 53,817 |
| Present Value of Terminal Value | 54,535 | 69,047 | 94,172 | 148,265 |
| Total Enterprise Value | 108,352 | 122,864 | 147,990 | 202,082 |
| Less: Debt | (5,531) | (5,531) | (5,531) | (5,531) |
| Market Value of Equity | 102,821 | 117,333 | 142,459 | 196,551 |
| Divided By: Shares Outstanding | 360.60 | 360.60 | 360.60 | 360.60 |
| Price Per Share | $285.14 | $325.38 | $395.06 | $545.07 |
Based upon these two discounted cash flow models, it is clear the market is pricing in growth above GDP for a long period of time. This exercise shows why it is hard to value compounders since the timing of slowing margin expansion and/or revenue growth is unknown and likely far into the future. So is Estee Lauder a buy? It depends on your long-term growth expectations and time horizon. For me, I plan to never sell Estee Lauder and would be comfortable adding some at these levels after the recent pullback. Management's strong track record gives me a higher confidence that growth may be above my forecast. However, only time will tell. Broadly speaking, I believe compounders such as Estee Lauder are a must-own as part of a diversified portfolio with a long-term investment horizon.