
Someone felt this image of a cat writing stock research or looking at dividend yields should be worth money. I agreed, so now this image is going to be trending on Seeking Alpha. Best stock photo you've seen so far today?
iridi/iStock via Getty Images
Get ready for charts, images, and tables because they are better than words. The ratings and outlooks we highlight here come after Scott Kennedy’s weekly updates in the REIT Forum. Your continued feedback is greatly appreciated, so please leave a comment with suggestions.
We’ve got five shares with bullish ratings and dividend yields ranging from about 10% to 12% (rounded). Dividend yields for each mortgage REIT are included in the tables for the recurring section of the article. I could list them again next to each pick, but then I would appear to be endorsing blind yield chasing. We absolutely do not do that. We trade between these shares based on fluctuations in the price-to-book ratio and the reasonable range of price-to-book ratios. With that said, it’s time for ratings.
Dynex Capital (DX) is trading about $15.40. Good deal. That’s a 10% discount to our book value projections from 02/25/2022. DX is one of the best mortgage REITs and should trade at a smaller discount than most peers. They also pay out their dividend monthly, which appeals to many investors. Since the start of 2020, over the last three years, and over the last five years, DX thoroughly beat the sector ETF (the gray bar):
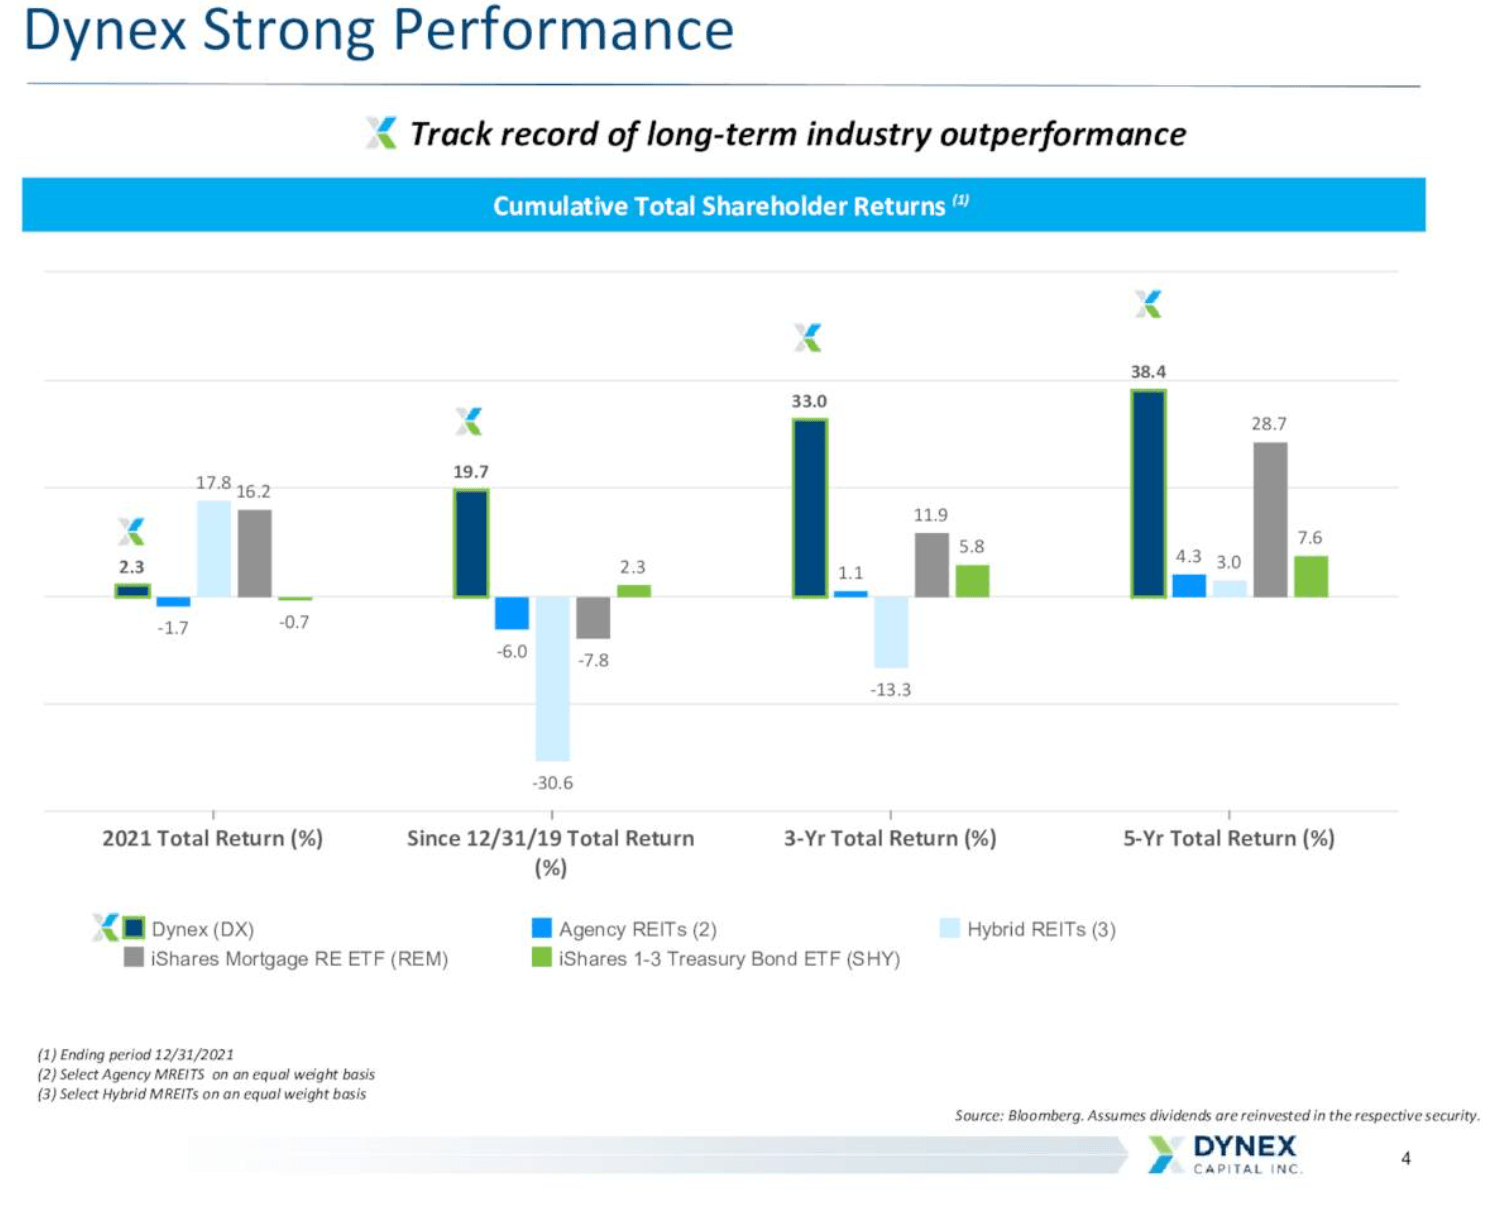
DX Investor Presentation
Let’s look at another agency-focused mortgage REIT with a monthly dividend. AGNC Investment Corp. (AGNC) has a bullish outlook also. Their book value per share (under GAAP) is inflated a bit by having intangible assets (goodwill from buying out the manager), but that’s considered in reaching our targets. The estimated price-to-book for AGNC is a bit lower, offsetting the extra book value from Goodwill.
There’s another big mortgage REIT we get asked about frequently. Annaly Capital Management (NLY) is the biggest of the mortgage REITs. By our estimates, NLY is trading pretty close to current estimated book value. Consequently, NLY gets a neutral outlook. The valuation is materially less attractive for NLY than for AGNC or DX, but the valuation for NLY isn’t high enough to warrant a bearish rating.
Next up, New Residential (NRZ) looks good. They’ve outperformed the sector lately and some investors may be concerned that their stronger performance is setting them up for disappointment. However, they simply delivered solid performance on several occasions. By our estimate shares of NRZ trade at a 12% discount to our projected BV from 02/25/2022.
PennyMac Mortgage Trust (PMT) hasn’t been quite as impressive as NRZ. Weaker performance on fundamentals and weaker performance on the share price. However, they look like a good deal with a 14% discount to our projected book value from 02/25/2022.
We’re also in the bullish range on AG Mortgage Investment Trust (MITT) now. Shares occasionally traded at extremely high price-to-book ratios and we had some opportunities to be quite bearish. However, the share price has taken a dramatic beating over the last year. Due to a huge disparity between share price performance and book value performance, MITT gets to be in the bullish range. We required a bigger discount on MITT than several peers for us to be bullish, but shares have a much bigger discount so that requirement is met.
Treasury Yields
I put together the following image for subscribers, but I’ll post it here also:
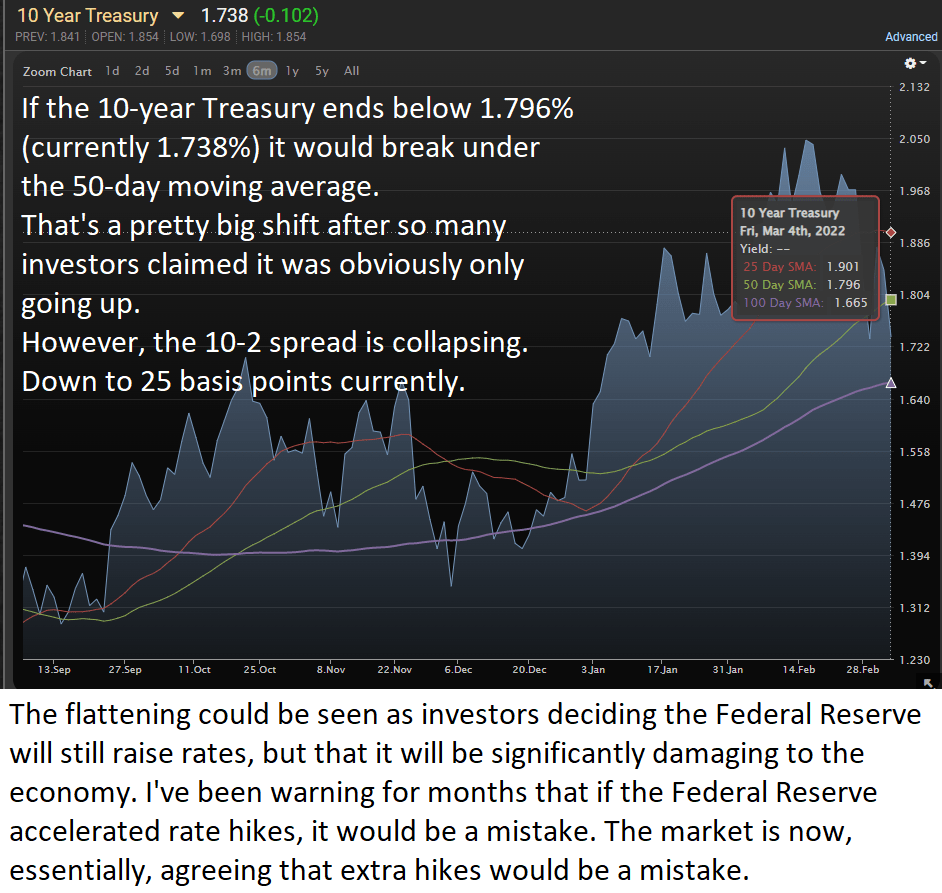
MBSLive
The curve is flattening. That doesn’t mean you need to buy or sell mortgage REITs. The change in the shape of the yield curve by itself is NOT a viable predictor for returns in the sector. We’ve seen solid performance with the curve flattening and with the curve steepening. We’ve also seen terrible performance with the curve flattening and the curve steepening. Anyone who assumes the flattening of the curve is a viable predictor of the performance of the sector is not only assuming that the market is inefficient, they are assuming that is staggeringly stupid. In my experience, these investors are either unwilling to share their complete trading history or have a very lackluster history.
Stop Talking About the Curve
For subscribers, I prepared a large guide to mortgage REITs focused on Annaly Capital Management and the Yield Curve. I don’t intend to post the whole guide here, but I’ll share some bits from it.
To demonstrate why you shouldn’t focus directly on the yield curve, I put together a chart contrasting the price-to-book ratios with the 10-2 Treasury spread. The 10-2 Treasury spread is the difference between the 10-year Treasury yield and the 2-year Treasury yield. It is also sometimes called the 2-10 spread, which makes less sense since it doesn’t put the terms in the proper order for the equation. For this to work on one chart, we needed to zoom it out a bit:
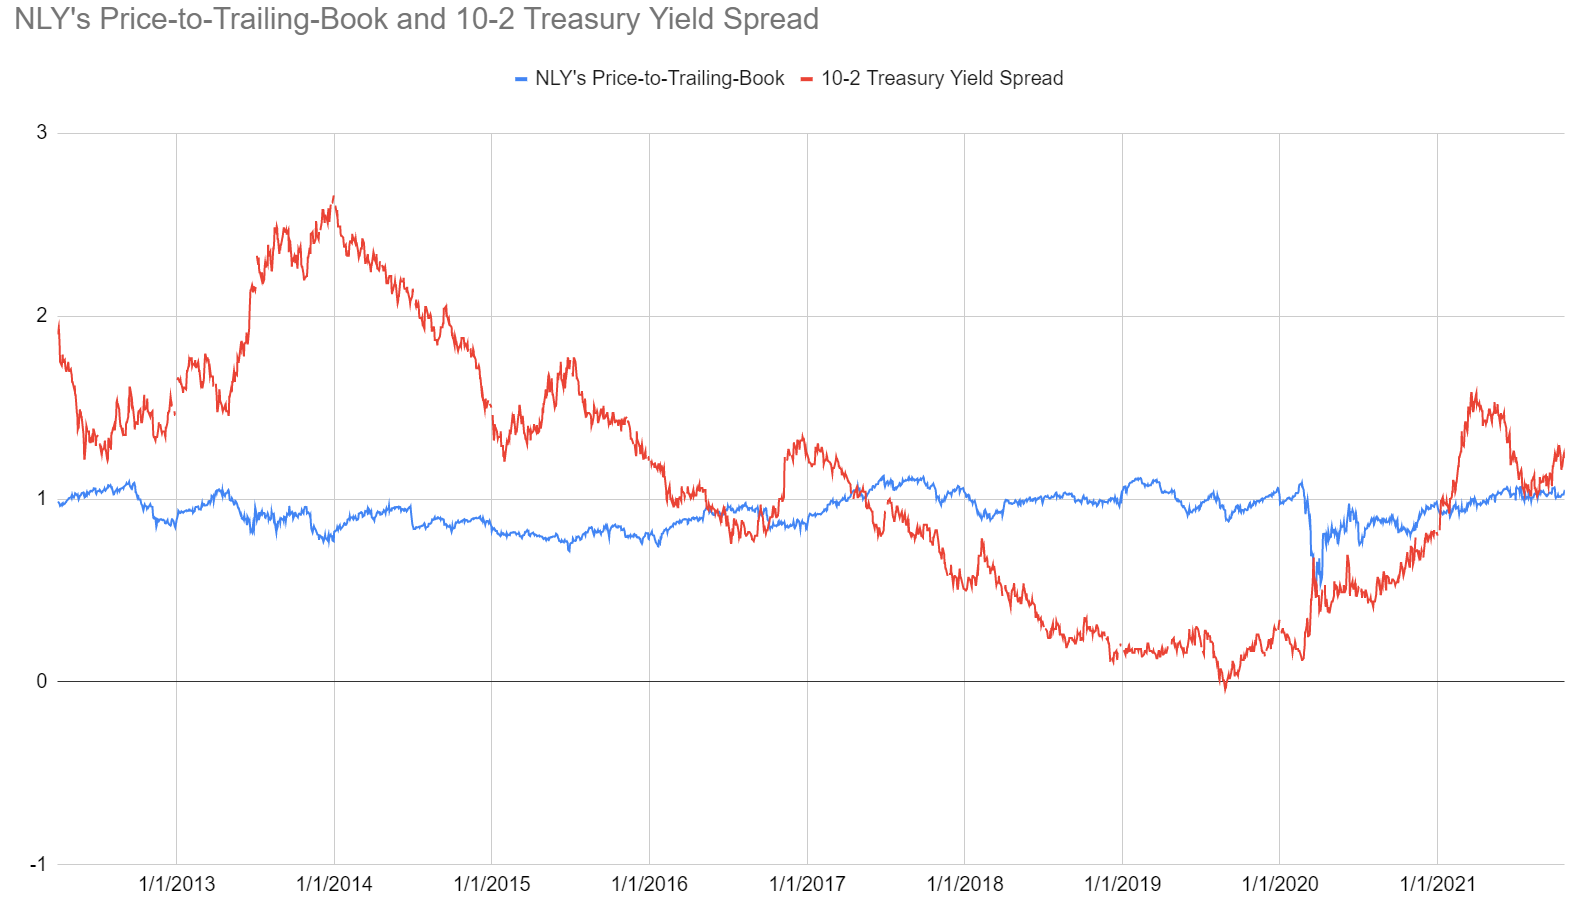
The REIT Forum
In this chart, the price-to-trailing-book ratio is shown in blue. Rather than using 100%, we’ve simply used a ratio of 1.0. The steepness of the yield curve is measured in basis points, so if the 10-year Treasury yield was 3.0% and the 2-year Treasury yield was 0.5%, then the spread would be 2.5% and we would represent that with a value of 2.5. Now that we have the image, let’s draw on the image to highlight many relevant points:
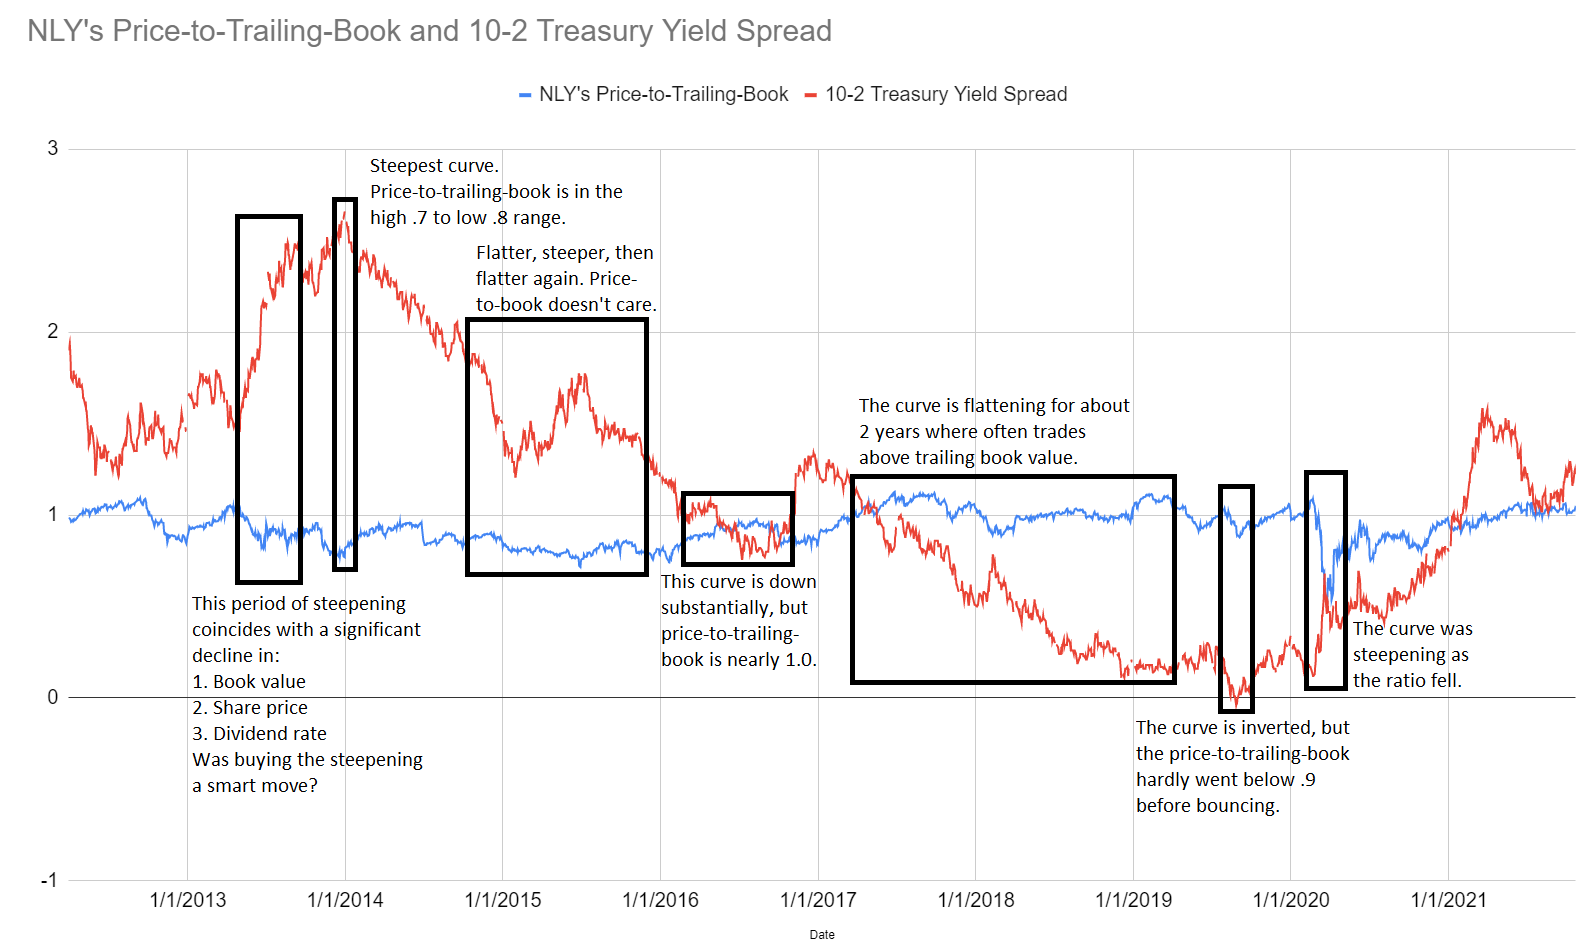
The REIT Forum
So, what’s the message here? You shouldn’t be focusing on the yield curve to decide when to buy. It simply isn’t a good indicator for when investors are getting a superior risk/reward profile. That doesn’t mean it's completely useless in analysis. However, it matters more to the management of the mortgage REIT for determining how to position the portfolio than it does for the investor debating when to buy or sell.
Why does the chart stop before 2022? Because I wrote the guide in December 2021 and I’m not a time traveler. If someone can’t get the message from nearly a decade worth of data, a few more months isn’t going to turn on the lightbulb.
Review
That gives you a few solid choices with DX, AGNC, NRZ, and PMT. We’re also bullish on MITT after shares got pummeled. On the other hand, we’re only neutral on NLY since we don’t want to enter positions without an attractive discount to projected current book value. We have far more ratings on The REIT Forum, but 6 is great for a single public article. If you’re still desperate to figure out which REITs had a yield near 10% and which ones were closer to 12%, the images below will take care of it.
The rest of the charts in this article may be self-explanatory to some investors. However, if you’d like to know more about them you’re encouraged to see our notes for the series.
Stock Table
We will close out the rest of the article with the tables and charts we provide for readers to help them track the sector for both common shares and preferred shares.
We’re including a quick table for the common shares that will be shown in our tables:
Type of REIT or BDC | ||||
Residential Agency | Residential Hybrid | Residential Originator and Servicer | Commercial | BDC |
Let the images begin!
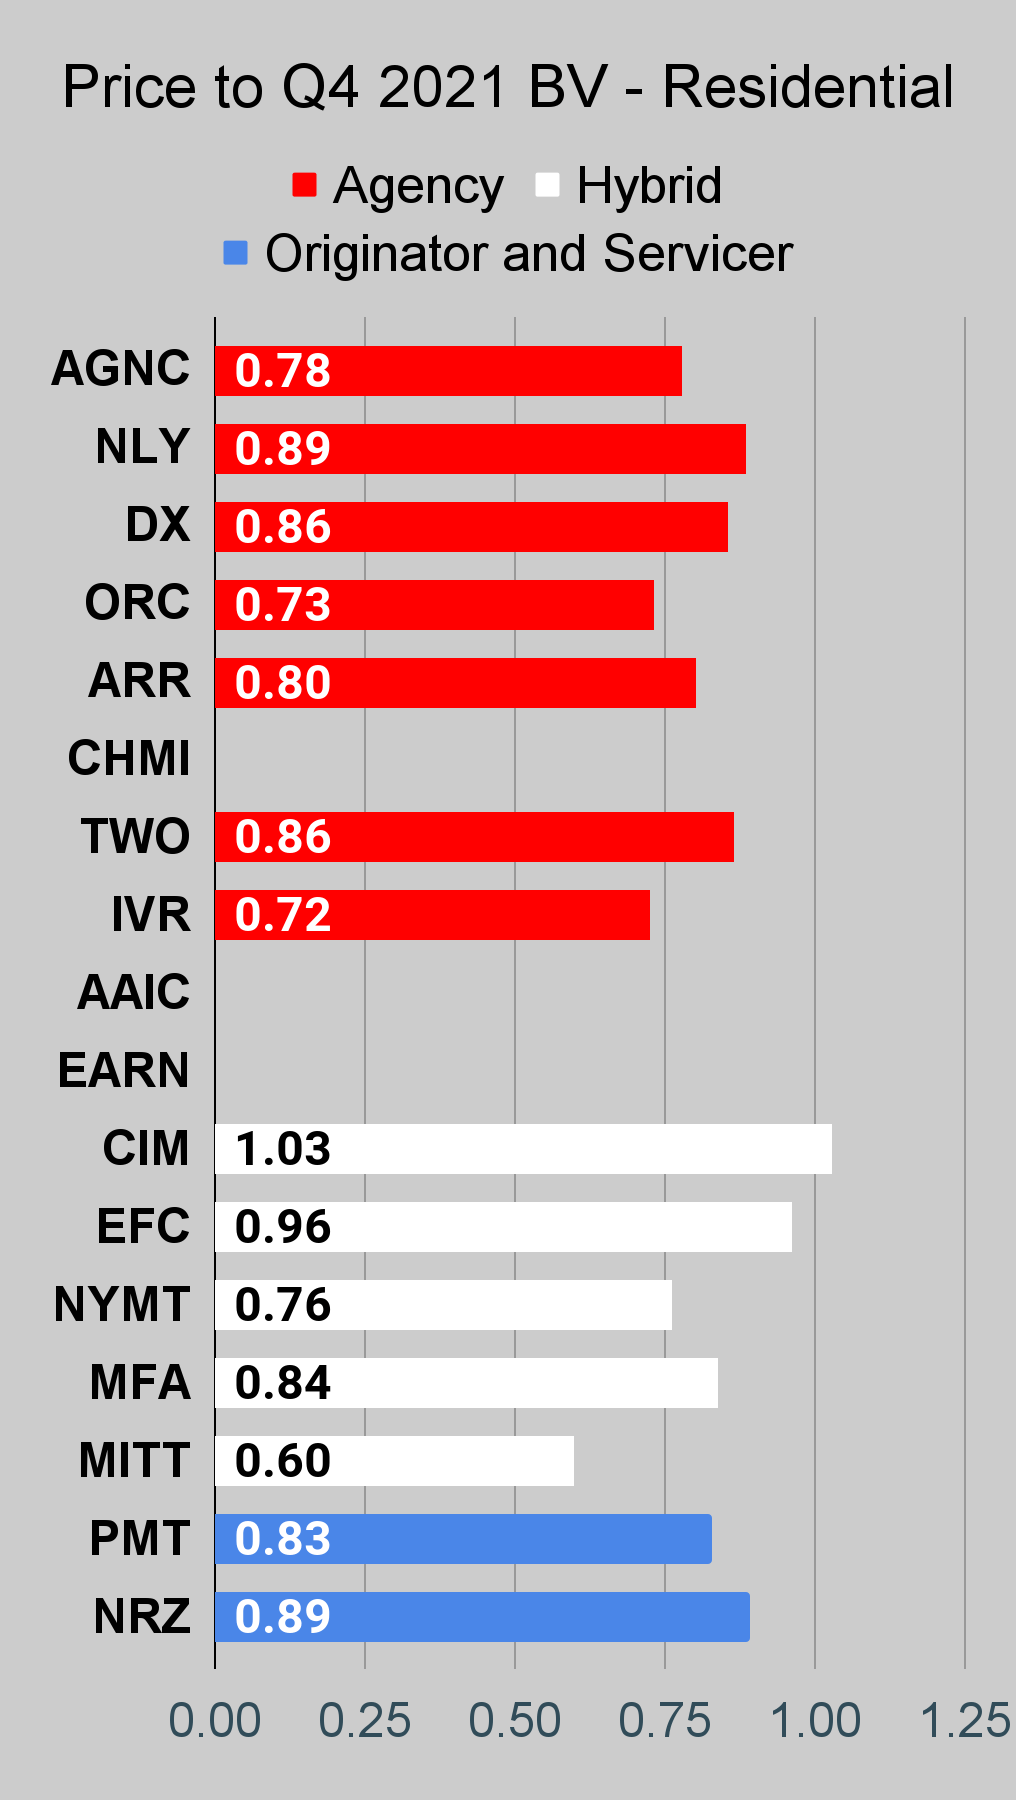
Residential Mortgage REIT Charts
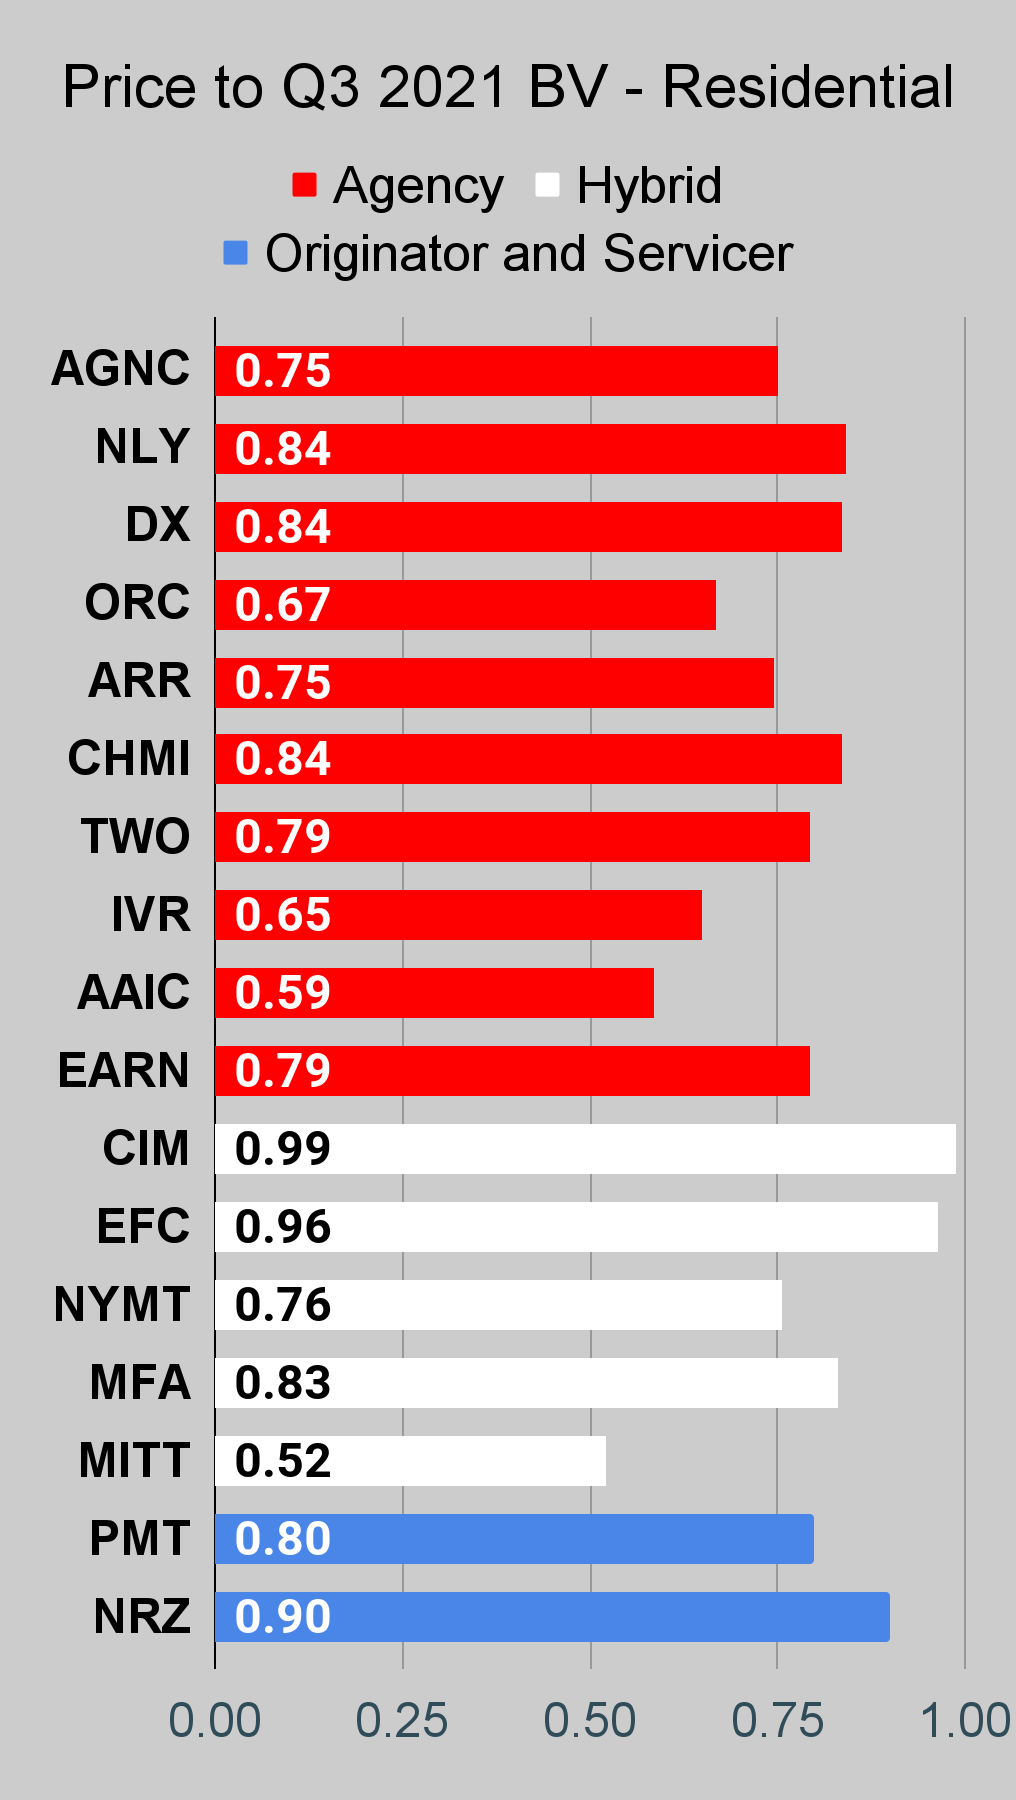 The REIT Forum | 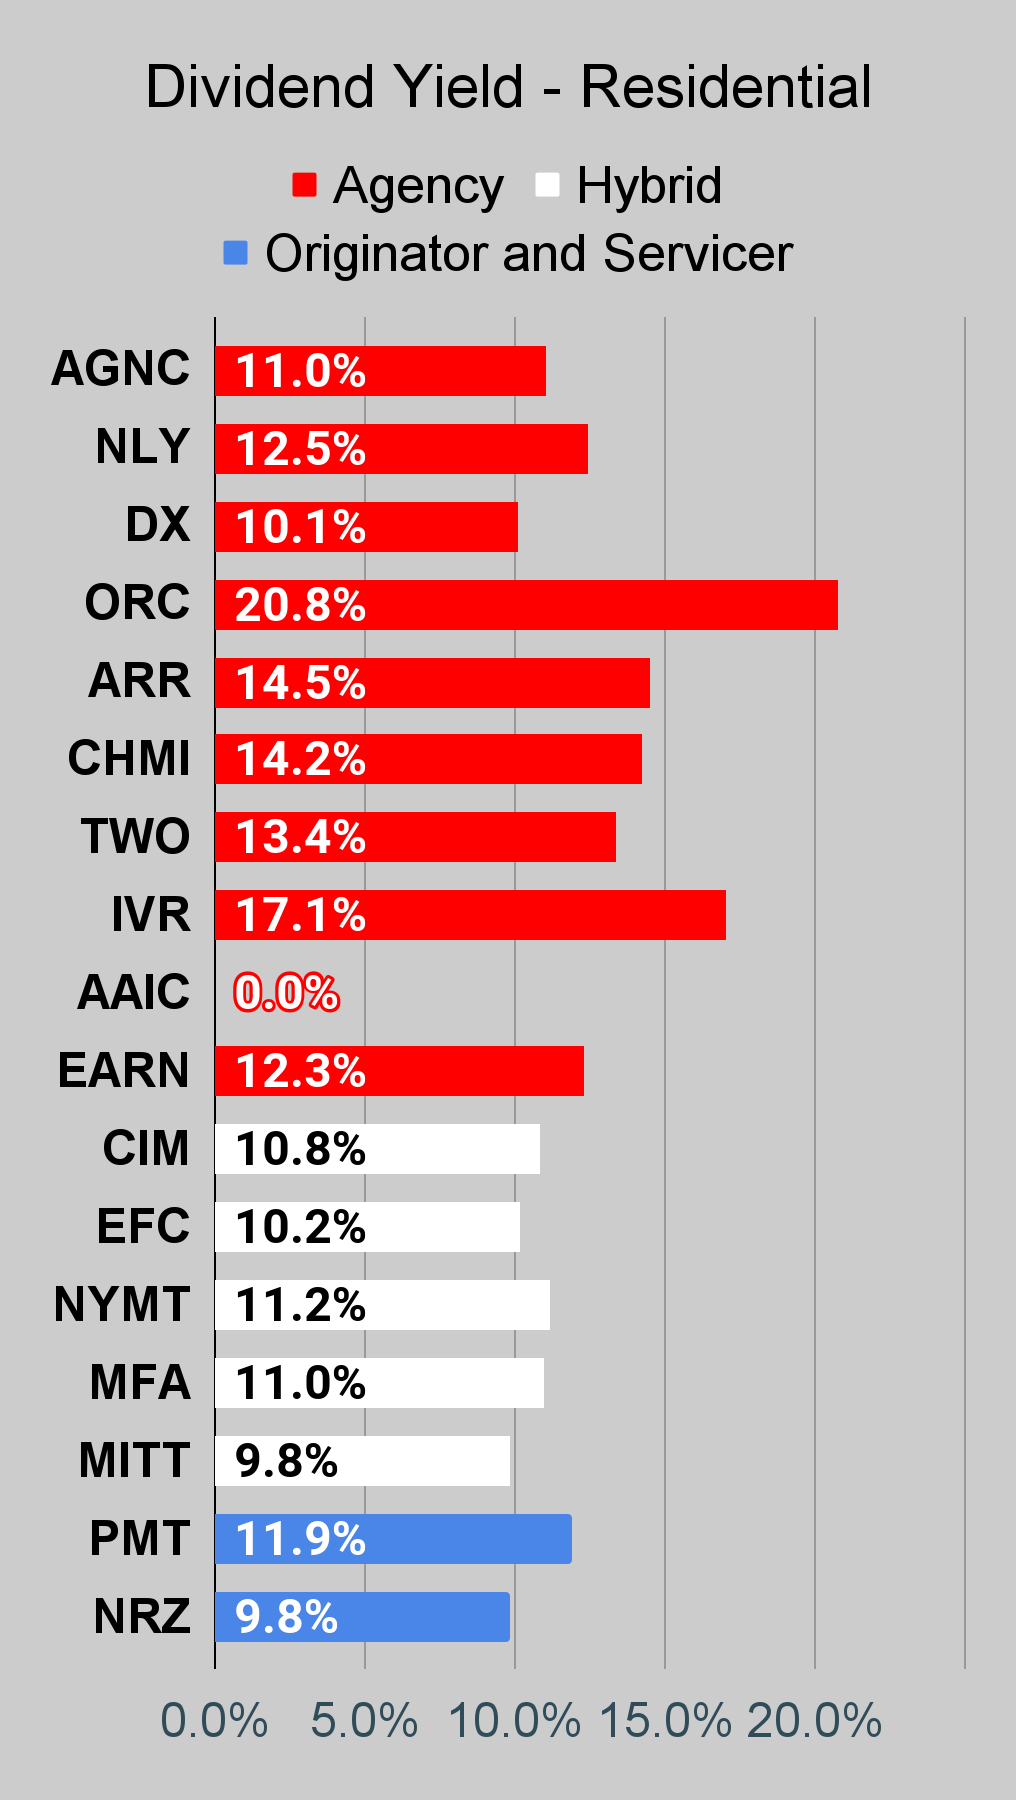 The REIT Forum | 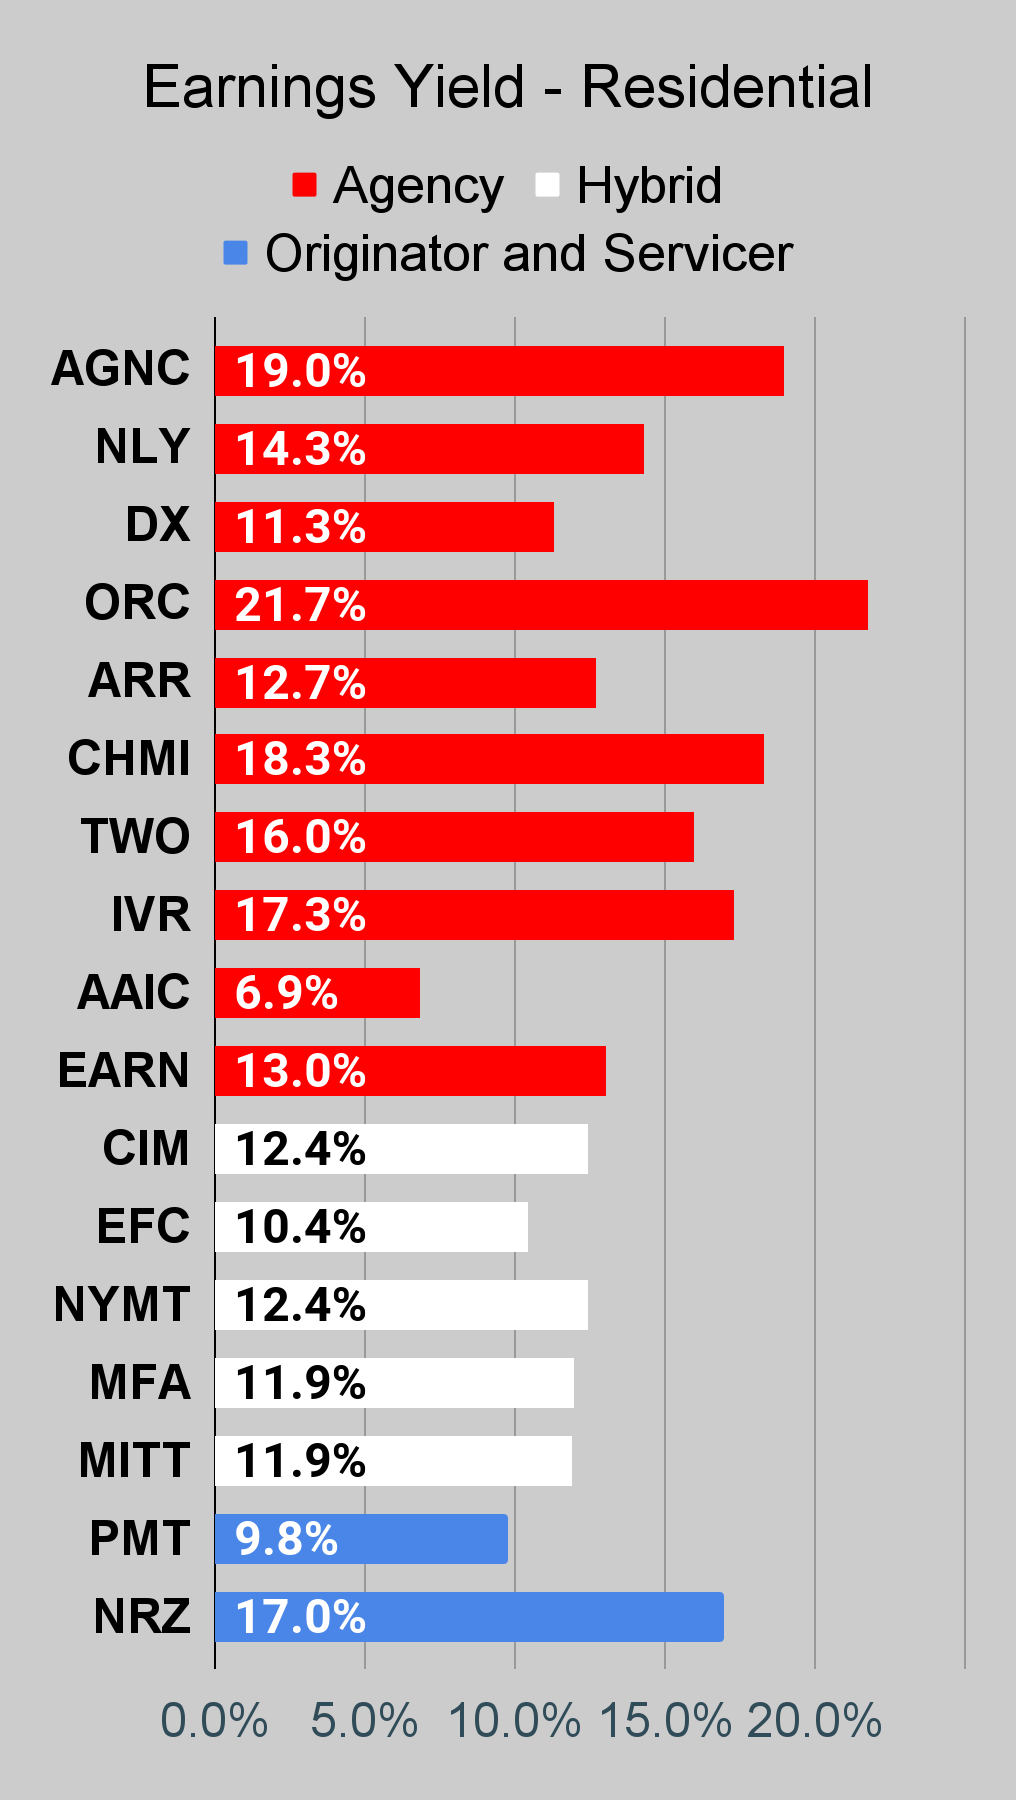 The REIT Forum |
Source: The REIT Forum
Commercial Mortgage REIT Charts
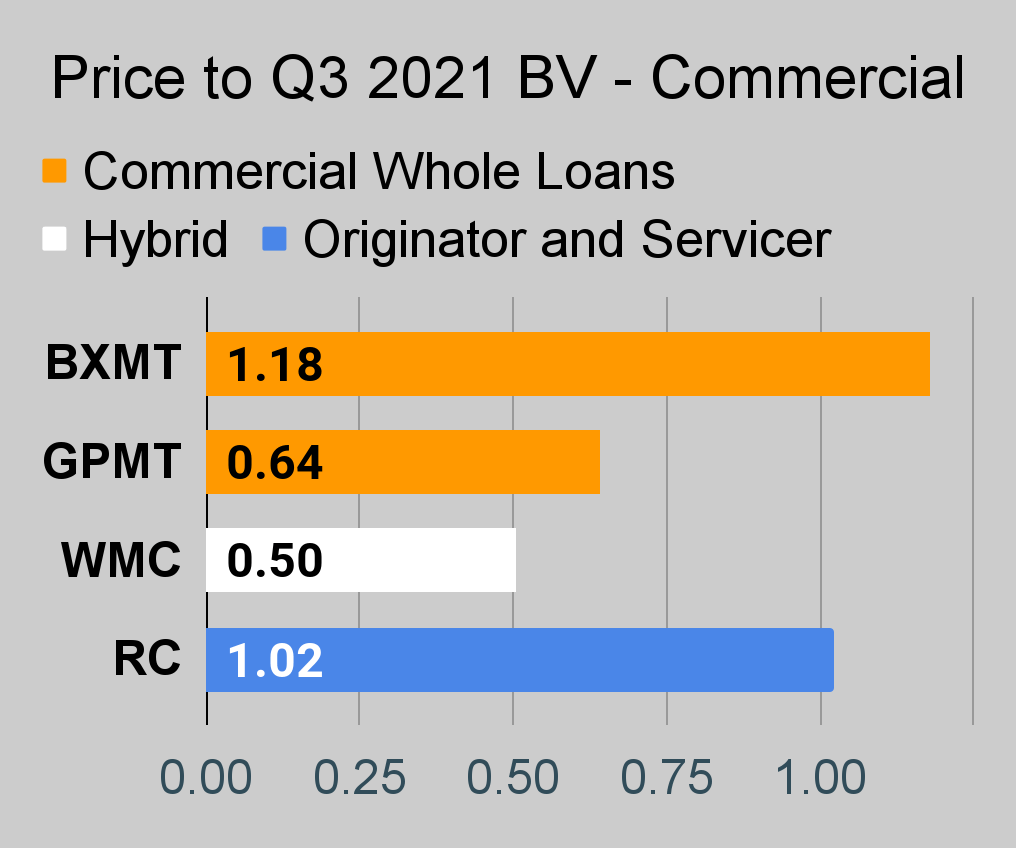 The REIT Forum | 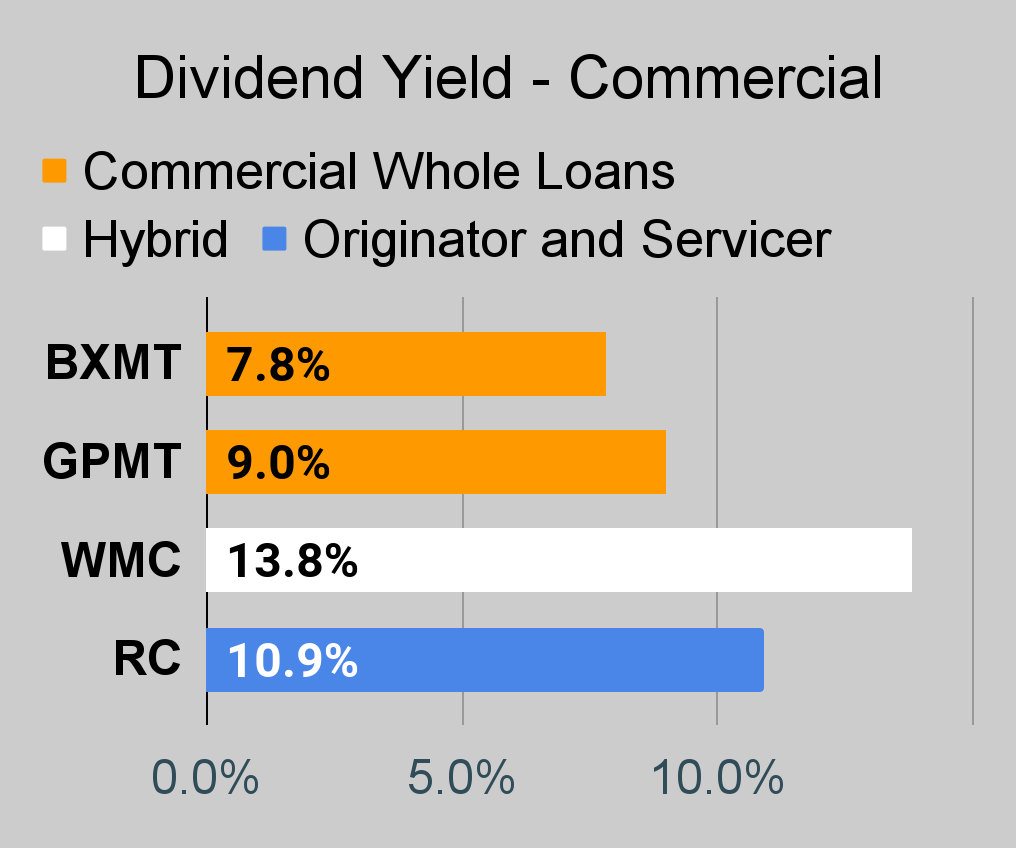 The REIT Forum | 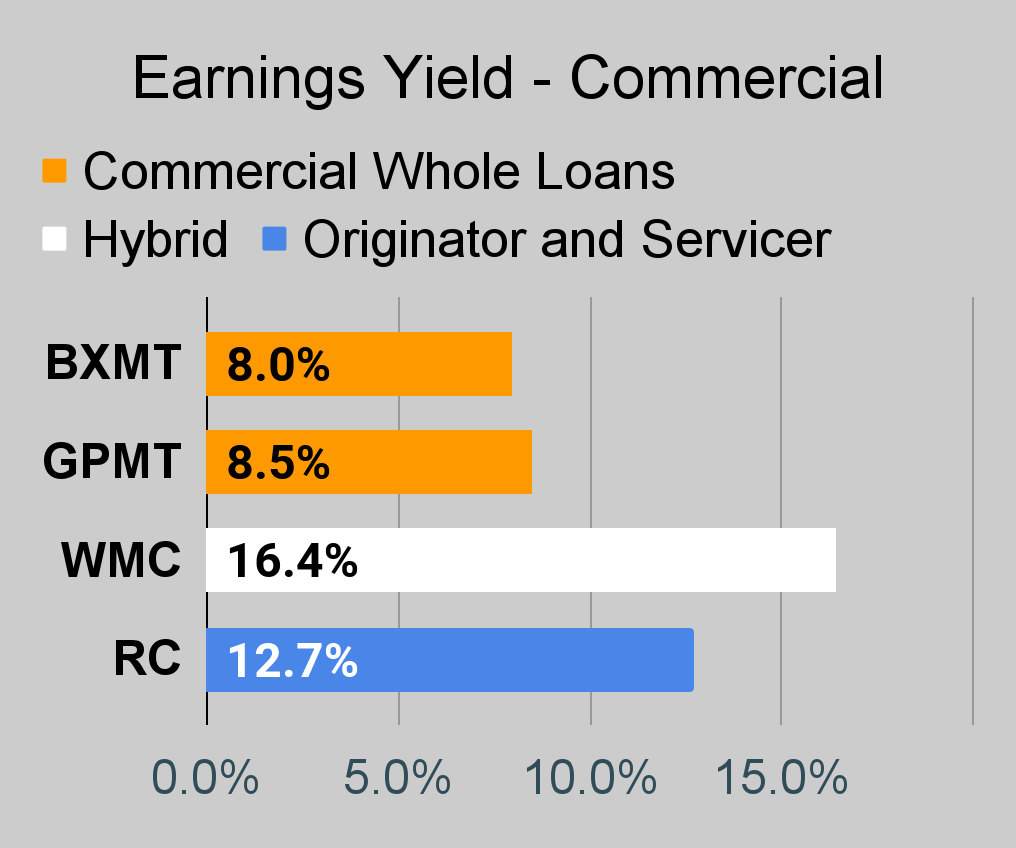 The REIT Forum |
BDC Charts
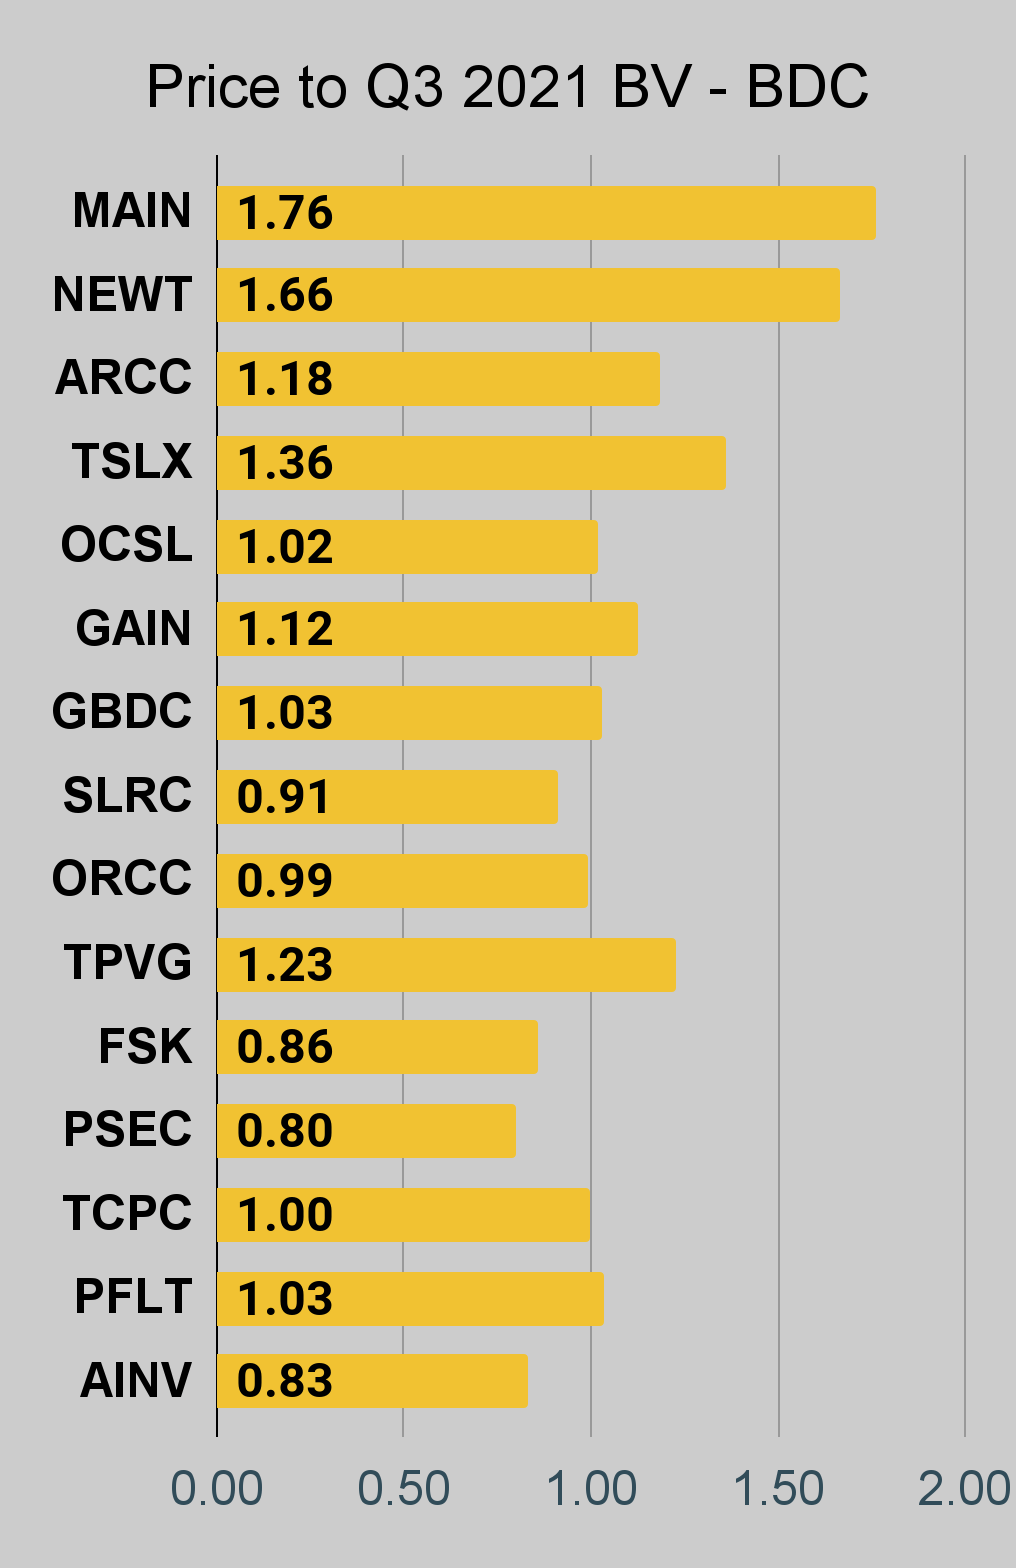 The REIT Forum | 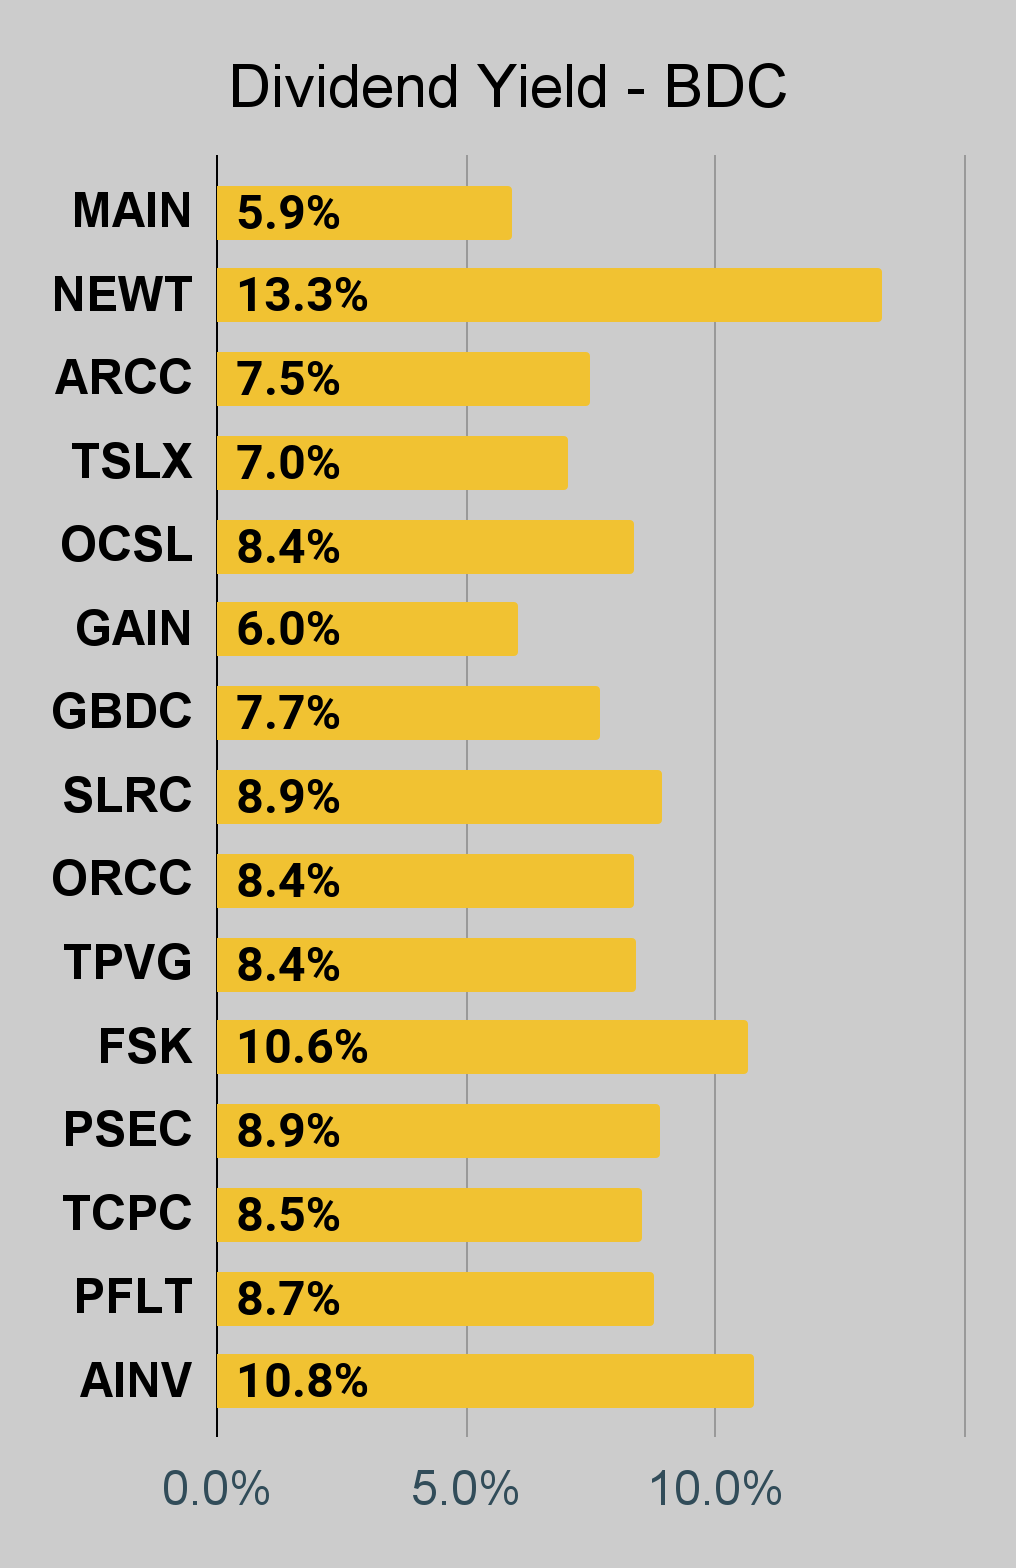 The REIT Forum | 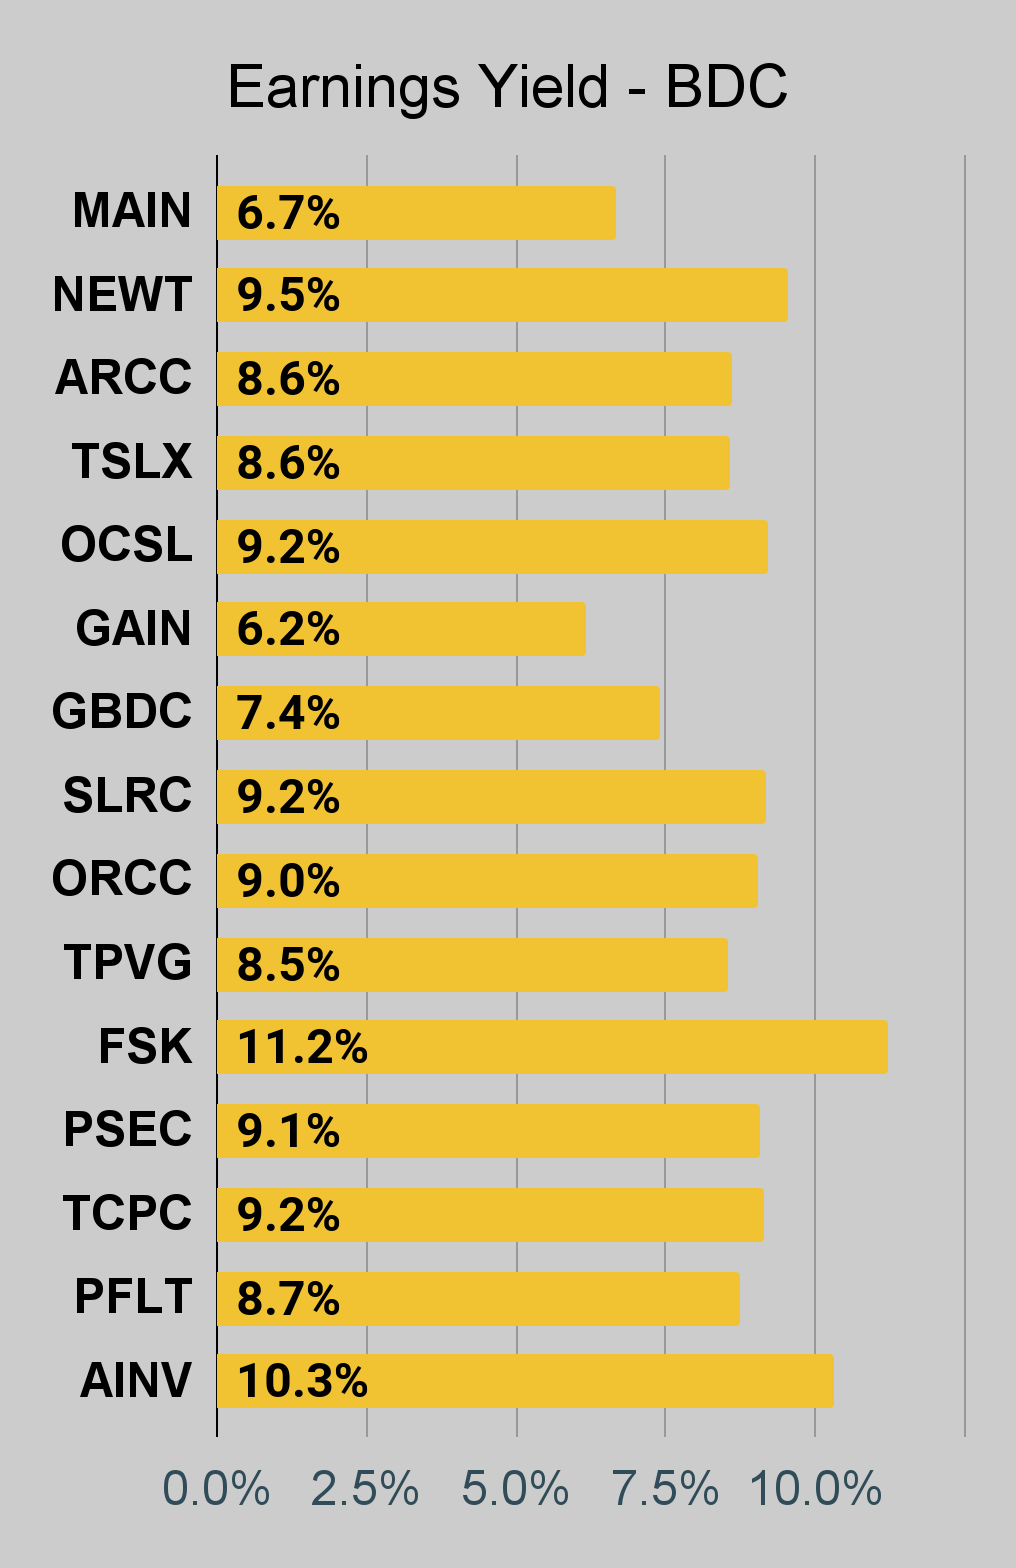 The REIT Forum |
Q4 2021 Charts
Several of these companies have not reported Q4 2021 values yet. If they have not reported, or reported recently, they will not have a bar in the following charts:
 The REIT Forum | 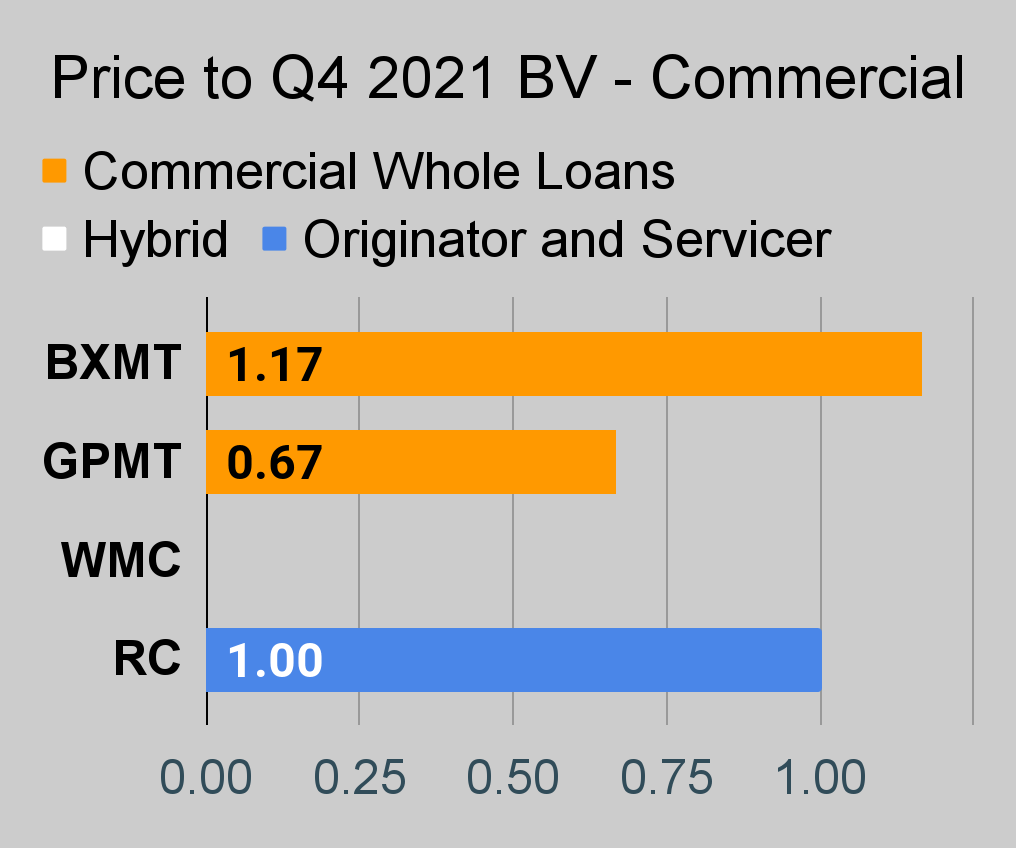 The REIT Forum | 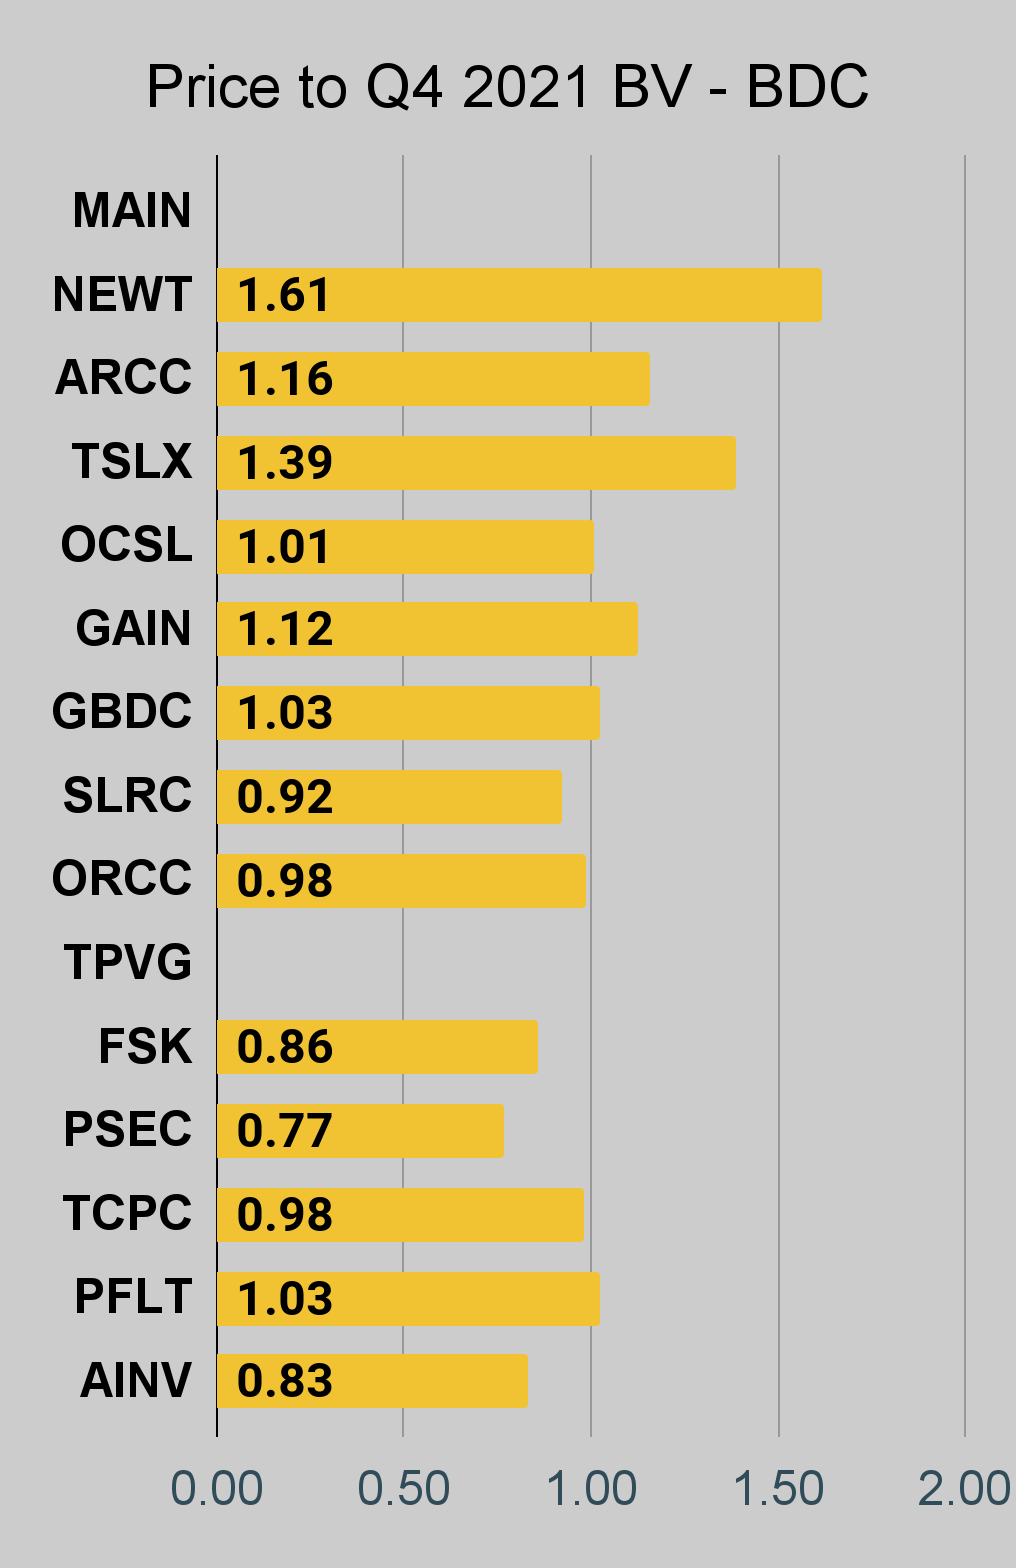 The REIT Forum |
To be clear, a few of those companies just reported and I haven't updated the public charts yet.
Preferred Share Charts
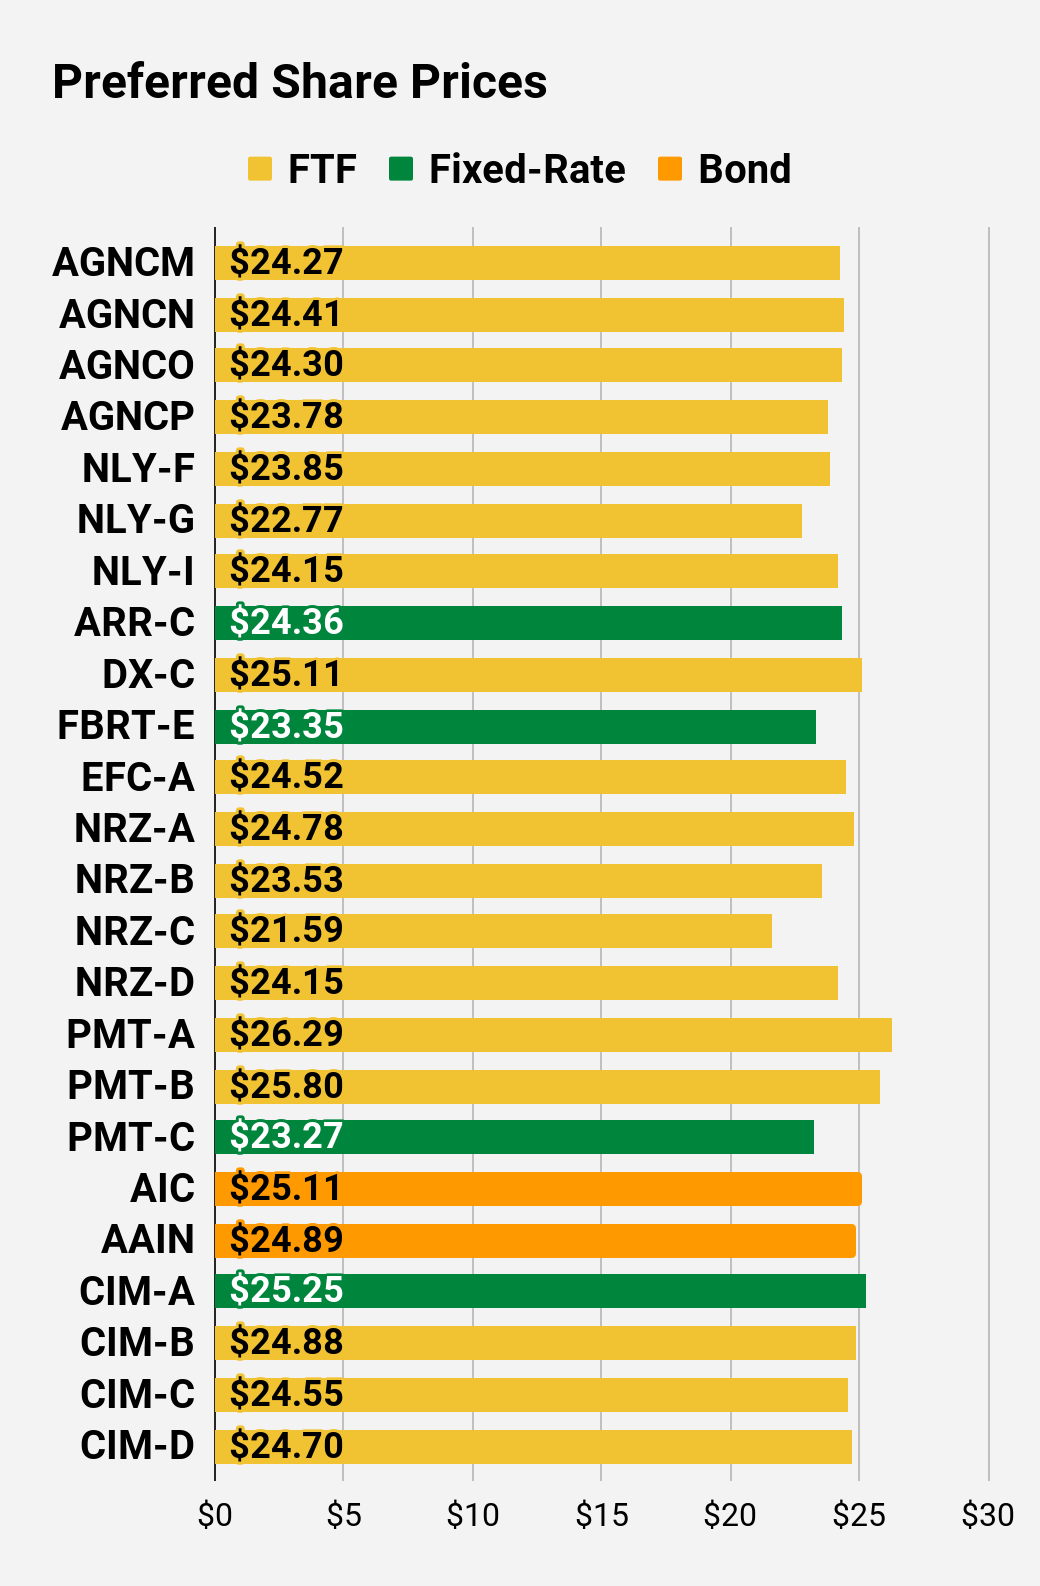 The REIT Forum | 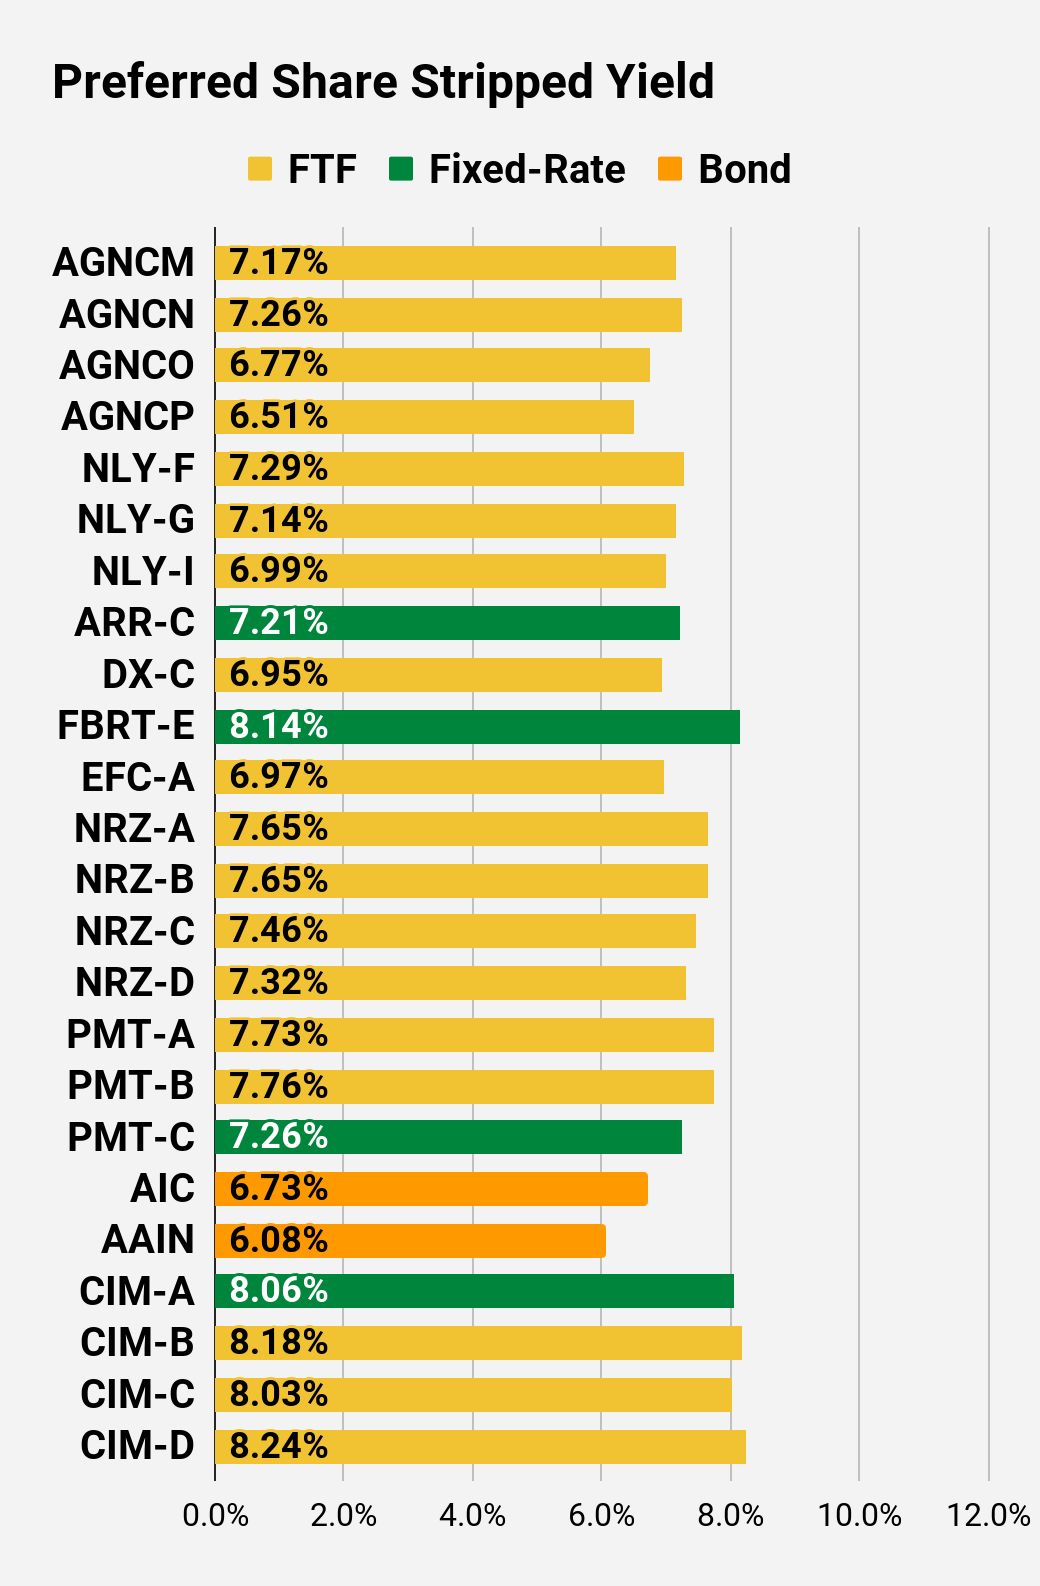 The REIT Forum | 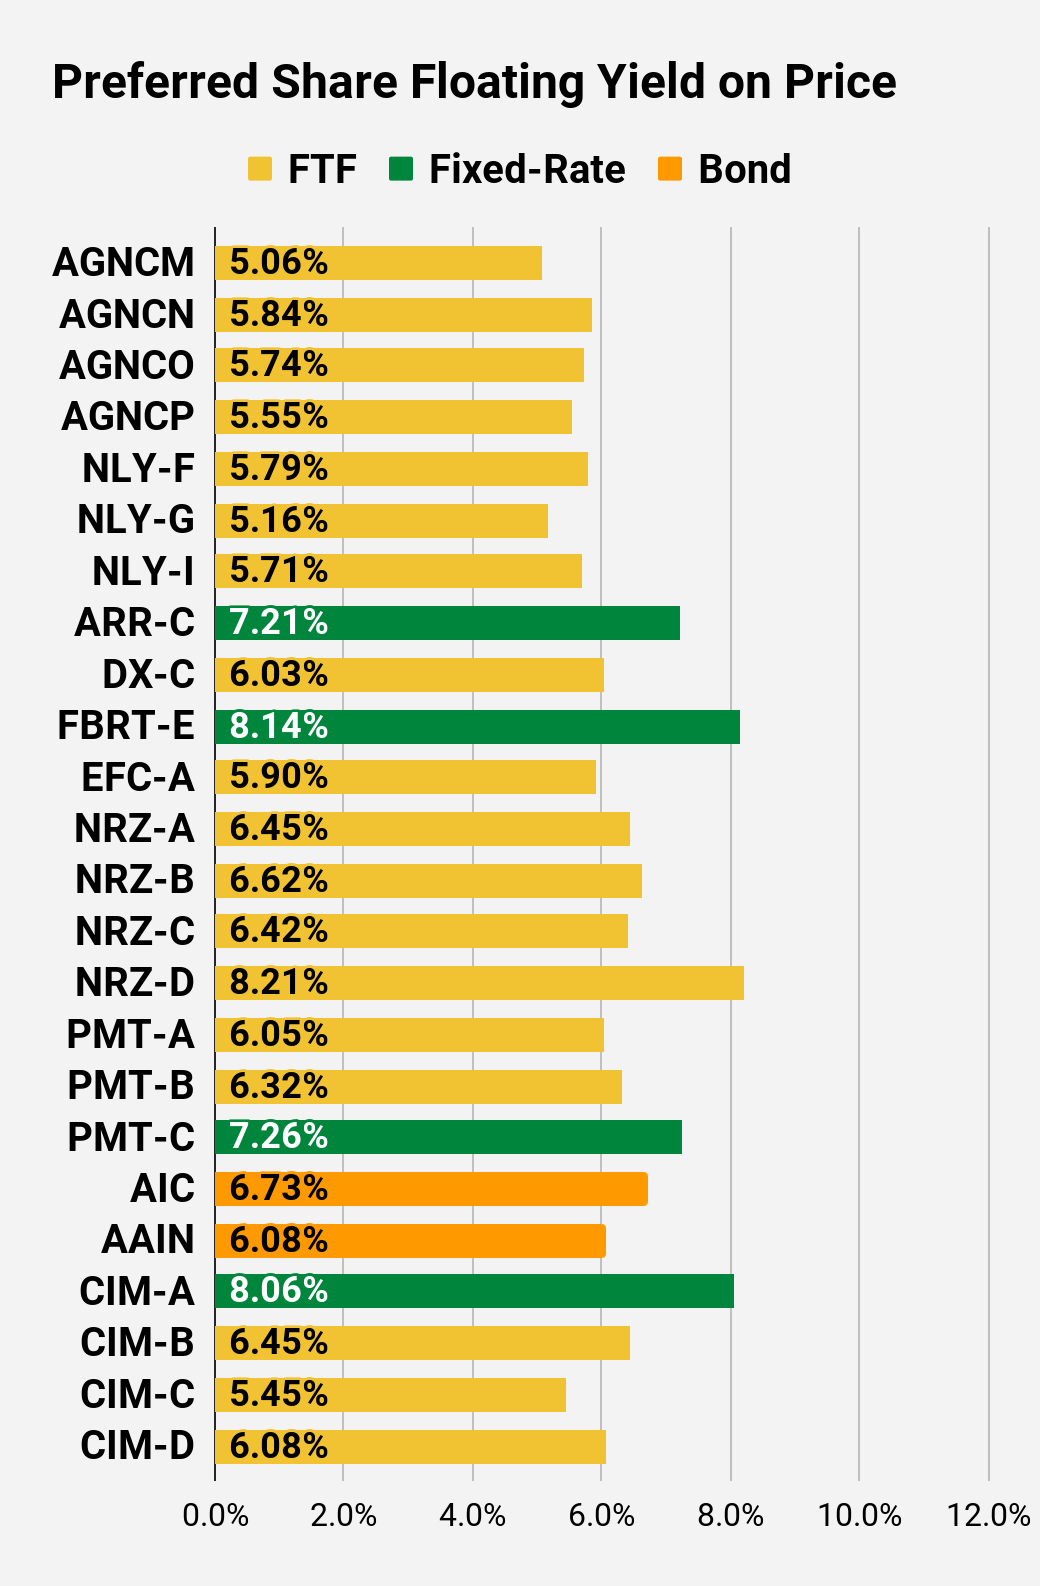 The REIT Forum |
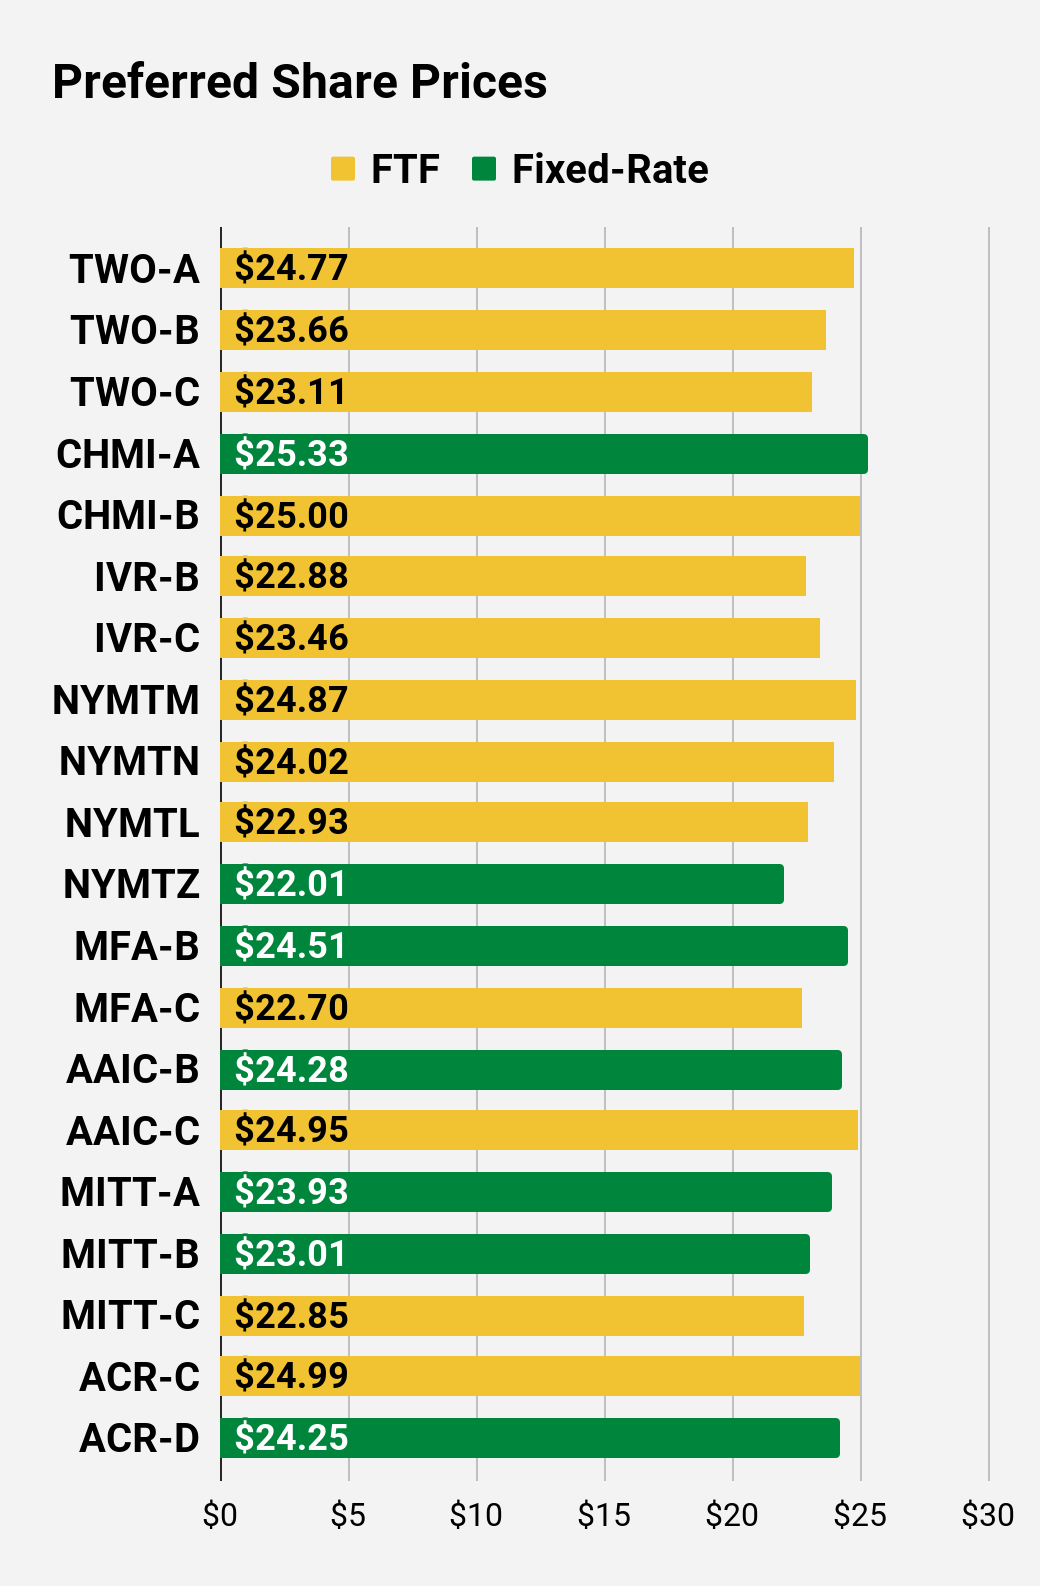 The REIT Forum | 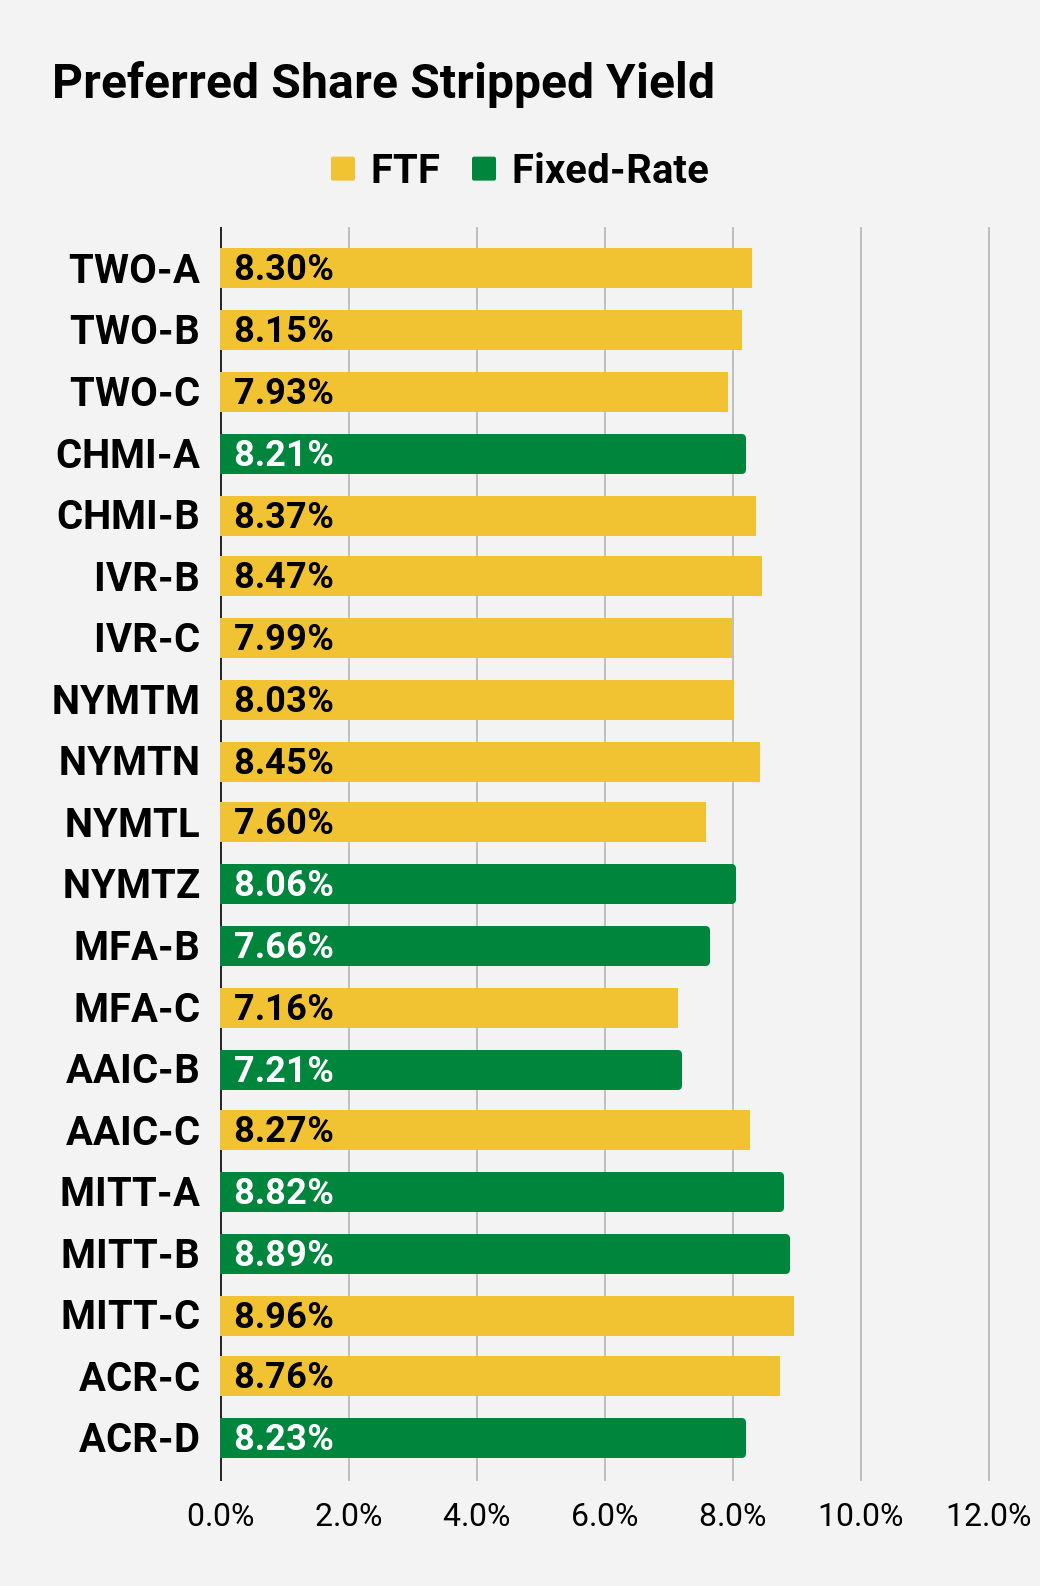 The REIT Forum | 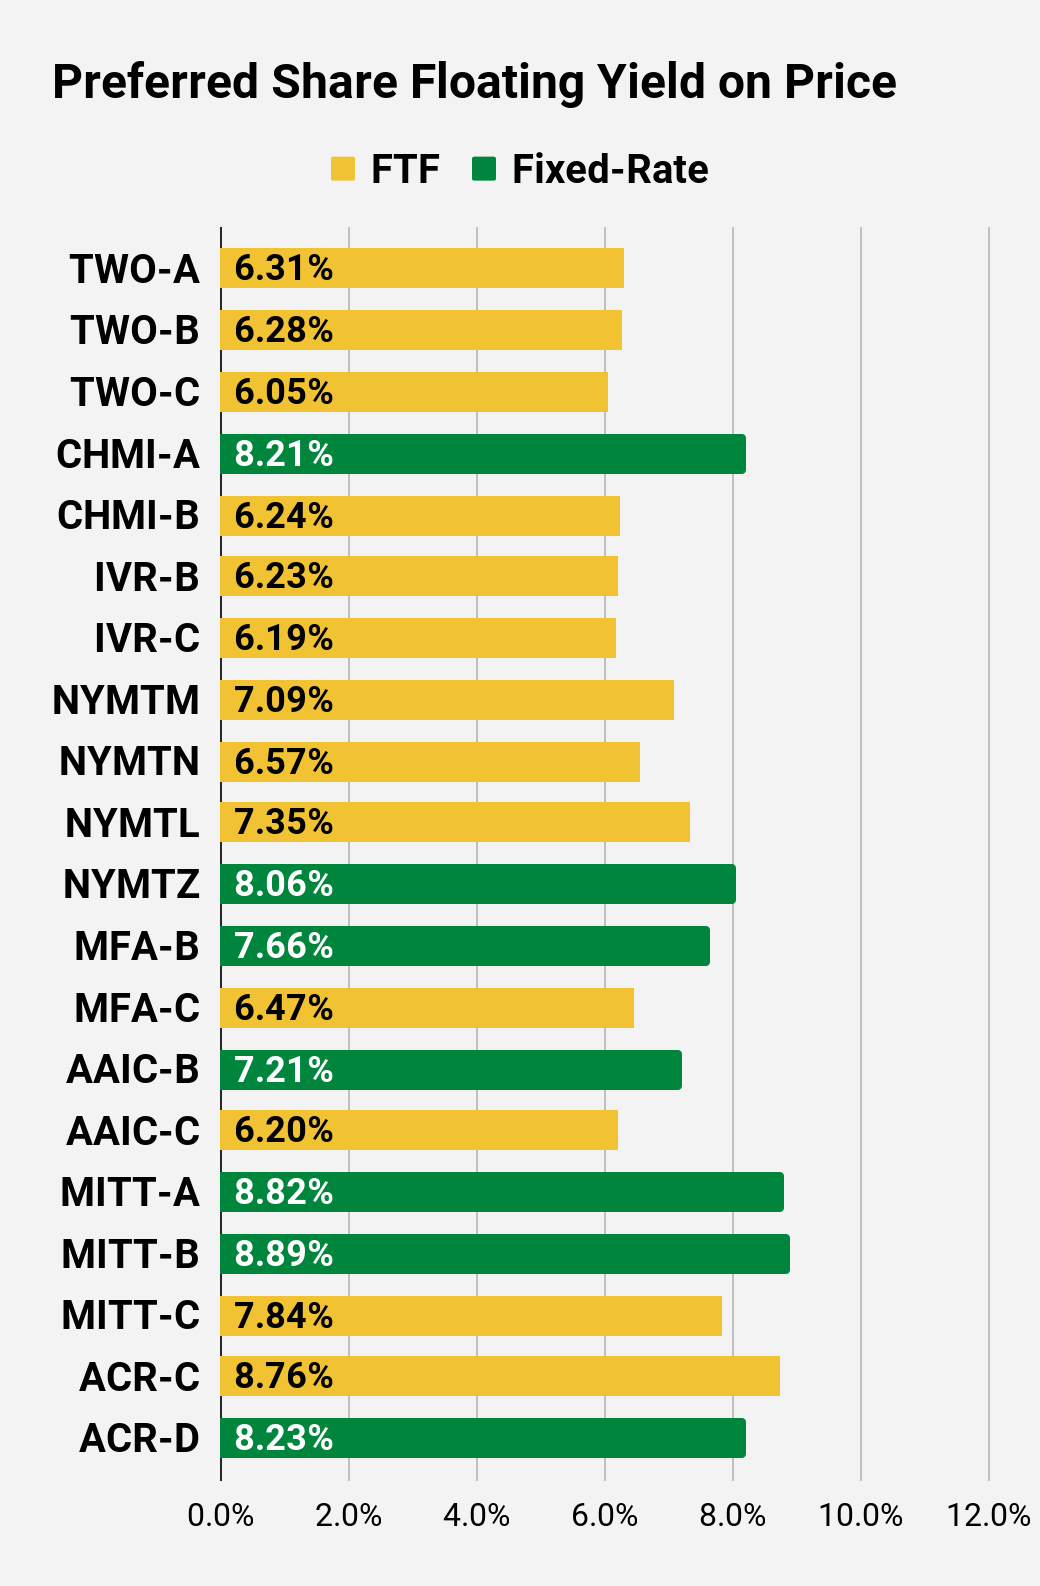 The REIT Forum |
Preferred Share Data
Beyond the charts, we’re also providing our readers with access to several other metrics for the preferred shares.
After testing out a series on preferred shares, we decided to try merging it into the series on common shares. After all, we are still talking about positions in mortgage REITs. We don’t have any desire to cover preferred shares without cumulative dividends, so any preferred shares you see in our column will have cumulative dividends. You can verify that by using Quantum Online. We’ve included the links in the table below.
To better organize the table, we needed to abbreviate column names as follows:
- Price = Recent Share Price - Shown in Charts
- BoF = Bond or FTF (Fixed-to-Floating)
- S-Yield = Stripped Yield - Shown in Charts
- Coupon = Initial Fixed-Rate Coupon
- FYoP = Floating Yield on Price - Shown in Charts
- NCD = Next Call Date (the soonest shares could be called)
- Note: For all FTF issues, the floating rate would start on NCD.
- WCC = Worst Cash to Call (lowest net cash return possible from a call)
- QO Link = Link to Quantum Online Page
Ticker | Price | BoF | S-Yield | Coupon | FYoP | NCD | WCC | QO Link | P-Link |
$24.27 | FTF | 7.17% | 6.88% | 5.06% | 4/15/2024 | $4.60 | |||
$24.41 | FTF | 7.26% | 7.00% | 5.84% | 10/15/2022 | $1.90 | |||
$24.30 | FTF | 6.77% | 6.50% | 5.74% | 10/15/2024 | $5.17 | |||
$23.78 | FTF | 6.51% | 6.13% | 5.55% | 4/15/2025 | $6.20 | |||
$23.85 | FTF | 7.29% | 6.95% | 5.79% | 9/30/2022 | $2.02 | |||
$22.77 | FTF | 7.14% | 6.50% | 5.16% | 3/31/2023 | $3.86 | |||
$24.15 | FTF | 6.99% | 6.75% | 5.71% | 6/30/2024 | $4.65 | |||
$24.36 | 7.21% | 7.00% | 7.21% | 1/28/2025 | $5.74 | ||||
$25.11 | FTF | 6.95% | 6.90% | 6.03% | 4/15/2025 | $5.49 | |||
$23.35 | 8.14% | 7.50% | 8.14% | 3/26/2022 | $2.00 | ||||
$24.52 | FTF | 6.97% | 6.75% | 5.90% | 10/30/2024 | $5.20 | |||
$24.78 | FTF | 7.65% | 7.50% | 6.45% | 8/15/2024 | $4.92 | |||
$23.53 | FTF | 7.65% | 7.13% | 6.62% | 8/15/2024 | $5.93 | |||
$21.59 | FTF | 7.46% | 6.38% | 6.42% | 2/15/2025 | $8.21 | |||
$24.15 | FTF | 7.32% | 7.00% | 8.21% | 11/15/2026 | $9.18 | |||
$26.29 | FTF | 7.73% | 8.13% | 6.05% | 3/15/2024 | $2.78 | |||
$25.80 | FTF | 7.76% | 8.00% | 6.32% | 6/15/2024 | $3.71 | |||
$23.27 | 7.26% | 6.75% | 7.26% | 8/24/2026 | $9.23 | ||||
$25.11 | Bond | 6.73% | 6.75% | 6.73% | 3/26/2022 | -$0.06 | |||
$24.89 | Bond | 6.08% | 6.00% | 6.08% | 8/1/2023 | $2.35 | |||
$25.25 | 8.06% | 8.00% | 8.06% | 3/26/2022 | $0.22 | ||||
$24.88 | FTF | 8.18% | 8.00% | 6.45% | 3/30/2024 | $4.61 | |||
$24.55 | FTF | 8.03% | 7.75% | 5.45% | 9/30/2025 | $7.72 | |||
$24.70 | FTF | 8.24% | 8.00% | 6.08% | 03/30/2024 | $4.79 |
Second Batch:
Ticker | Price | BoF | S-Yield | Coupon | FYoP | NCD | WCC | QO Link | P-Link |
$24.77 | FTF | 8.30% | 8.13% | 6.31% | 04/27/2027 | $10.89 | |||
$23.66 | FTF | 8.15% | 7.63% | 6.28% | 07/27/2027 | $11.82 | |||
$23.11 | FTF | 7.93% | 7.25% | 6.05% | 1/27/2025 | $7.33 | |||
$25.33 | 8.21% | 8.20% | 8.21% | 8/17/2022 | $0.79 | ||||
$25.00 | FTF | 8.37% | 8.25% | 6.24% | 4/15/2024 | $4.56 | |||
$22.88 | FTF | 8.47% | 7.75% | 6.23% | 12/27/2024 | $7.47 | |||
$23.46 | FTF | 7.99% | 7.50% | 6.19% | 9/27/2027 | $11.87 | |||
$24.87 | FTF | 8.03% | 7.88% | 7.09% | 1/15/2025 | $6.04 | |||
$24.02 | FTF | 8.45% | 8.00% | 6.57% | 10/15/2027 | $12.48 | |||
$22.93 | FTF | 7.60% | 6.88% | 7.35% | 10/15/2026 | $10.23 | |||
$22.01 | 8.06% | 7.00% | 8.06% | 1/15/2027 | $11.74 | ||||
$24.51 | 7.66% | 7.50% | 7.66% | 3/26/2022 | $0.48 | ||||
$22.70 | FTF | 7.16% | 6.50% | 6.47% | 3/31/2025 | $7.19 | |||
$24.28 | 7.21% | 7.00% | 7.21% | 5/12/2022 | $0.92 | ||||
$24.95 | FTF | 8.27% | 8.25% | 6.20% | 3/30/2024 | $4.18 | |||
$23.93 | 8.82% | 8.25% | 8.82% | 3/26/2022 | $1.59 | ||||
$23.01 | 8.89% | 8.00% | 8.89% | 3/26/2022 | $2.49 | ||||
$22.85 | FTF | 8.96% | 8.00% | 7.84% | 9/17/2024 | $7.62 | |||
$24.99 | FTF - Floor | 8.76% | 8.63% | 8.76% | 7/30/2024 | $5.40 | |||
$24.25 | 8.23% | 7.88% | 8.23% | 5/21/2026 | $9.23 |
Strategy
Our goal is to maximize total returns. We achieve those most effectively by including “trading” strategies. We regularly trade positions in the mortgage REIT common shares and BDCs because:
- Prices are inefficient.
- Long-term, share prices generally revolve around book value.
- Short-term, price-to-book ratios can deviate materially.
- Book value isn’t the only step in analysis, but it is the cornerstone.
We also allocate to preferred shares and equity REITs. We encourage buy-and-hold investors to consider using more preferred shares and equity REITs.
Performance
We compare our performance against 4 ETFs that investors might use for exposure to our sectors:
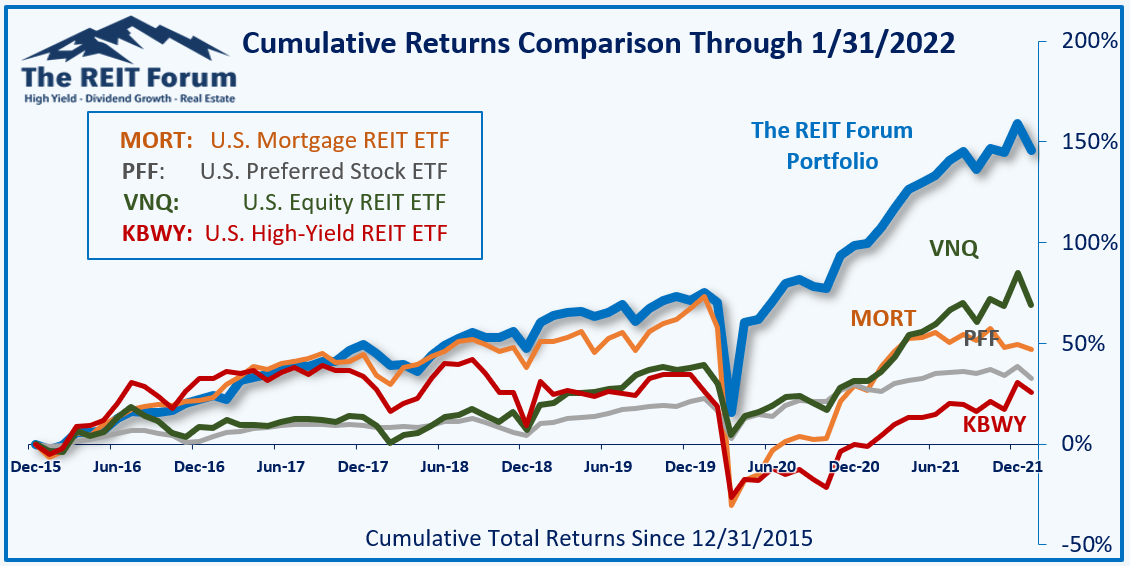
The REIT Forum
Source: The REIT Forum
The four ETFs we use for comparison are:
Ticker | Exposure |
One of the largest mortgage REIT ETFs | |
One of the largest preferred share ETFs | |
Largest equity REIT ETF | |
The high-yield equity REIT ETF. Yes, it has been dreadful. |
When investors think it isn’t possible to earn solid returns in preferred shares or mortgage REITs, we politely disagree. The sector has plenty of opportunities, but investors still need to be wary of the risks. We can’t simply reach for yield and hope for the best. When it comes to common shares, we need to be even more vigilant to protect our principal by regularly watching prices and updating estimates for book value and price targets.
Ratings:
- Bullish on AGNC, DX, PMT, NRZ, MITT
- Neutral on NLY
Want the best research? It’s time to raise your game. Get access to several features you won’t find on the public side.
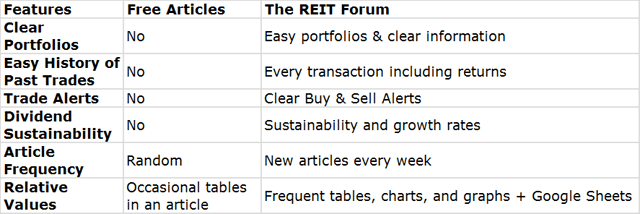
You can get access to everything we have to offer right now. Try our service and decide for yourself.