jnnault/E+ via Getty Images
Focus of Article:
The focus of PART 1 of this article is to analyze Annaly Capital Management Inc.'s (NYSE:NLY) recent results and compare several of the company's metrics to 19 mortgage real estate investment trust (mREIT) peers. This analysis will show past and current data with supporting documentation within four tables. Table 1a will compare NLY's mortgage-backed securities ("MBS")/investment composition, recent leverage, hedging coverage ratio, and change in investment portfolio size to the 19 mREIT peers. Table 1b will compare NLY's BV, economic return (loss), and premium (discount) to estimated CURRENT BV using stock prices as of 3/18/2022 to the 19 mREIT peers. Table 2 will show a quarterly compositional analysis of NLY's agency MBS portfolio while Table 3 will show the company's recent hedging coverage ratio over the prior two quarters (only contributor/team to provide continuous detailed hedging metrics).
I am writing this two-part article due to the continued requests that such an analysis be specifically performed on NLY versus its mREIT peers at periodic intervals. This article also discusses the importance of understanding the composition of NLY's MBS/investment and derivatives portfolios when it comes to projecting the company's future quarterly results as interest rates/yields fluctuate. Understanding the characteristics of a company's MBS/investment and derivatives portfolios can shed some light on which companies are overvalued or undervalued strictly per a "numbers" analysis. This is not the only data that should be examined to initiate a position within a particular stock/sector. However, I believe this analysis is a good "starting-point" to begin a discussion on the topic.
At the end of this article, there will be a conclusion regarding the following comparisons between NLY and the 19 mREIT peers: 1) trailing 24-month economic return (loss); 2) leverage as of 12/31/2021; 3) hedging coverage ratio as of 12/31/2021; and 4) premium (discount) to my estimated CURRENT BV (BV as of 3/18/2022). My BUY, SELL, or HOLD recommendation and updated price target for NLY will be in the "Conclusions Drawn" section of this article. This includes providing a list of the mREIT stocks I currently believe are undervalued (a buy recommendation), overvalued (a sell recommendation), or appropriately valued (a hold recommendation).
Overview of Several Classifications within the mREIT Sector:
I believe there are several different classifications when it comes to mREIT companies. For purposes of this article, I am focusing on four. It should be noted in light of several prior acquisitions and certain changes in overall investment strategies, some mREIT companies have minor-modest portfolios outside each entity's main concentration. However, I have continued to group certain mREIT companies in each entity's main classification for purposes of this article. Some market participants (and even some mREIT companies) have different classifications when compared to Table 1a. Some market participants/companies base classifications on the percentage of capital deployed in each entity's investment portfolio. However, my preference is to base a company's classification on the monetary "fair market value" ("FMV") of each underlying portfolio (which, for a fact, is what drives valuation fluctuations). In my professional opinion, there is no "uniform" methodology when it comes to classifying mREIT companies but more of an underlying preference. Readers should understand this as the analysis is presented below.
First, there are mREIT companies that earn a majority of their income from investing in fixed-rate agency MBS holdings. These investments consist of commercial/residential MBS, collateralized mortgage obligations ("CMO"), and agency debentures for which the principal and interest payments are guaranteed by government-sponsored enterprises/entities ("GSE"). This is extremely important to understand (especially when markets incorrectly priced in this notion at the onset of COVID-19 in early 2020). Since these investments typically have higher durations versus most other investments within the broader mREIT sector, companies within this classification typically utilize higher hedging coverage ratios in times of rising mortgage interest rates/U.S. Treasury yields (or a projected rise over the foreseeable future). NLY, AGNC Investment Corp. (AGNC), Arlington Asset Investment Corp. (AAIC), ARMOUR Residential REIT Inc. (ARR), Cherry Hill Mortgage Investment Corp. (CHMI), Dynex Capital Inc. (DX), Invesco Mortgage Capital Inc. (IVR) (moved to an agency mREIT back in 2020), Orchid Island Capital Inc. (ORC), and Two Harbors Investment Corp. (TWO) are currently classified as a fixed-rate agency mREIT.
Second, there are mREIT companies who earn varying portions of income from investing in agency MBS holdings, non-agency MBS holdings, other securitizations, and non-securitized mortgage-related debt investments (including residential whole loans). This type of company is known as a "hybrid" mREIT. In regards to non-agency MBS, this includes (but is not limited to) Alt-A, prime, subprime, and re/non-performing loans where the principal and interest are not guaranteed by a GSE. Since there is no "government guarantee" on the principal or interest payments of non-agency MBS and residential whole loans, coupons are generally higher when compared to agency MBS of a similar maturity. However, borrowing costs (including repurchase agreements) for these specific investments are also higher (no government guarantee; credit risk). Due to the subtle yet identifiable differences between agency and non-agency MBS/residential whole loans, I like to differentiate between an agency and a hybrid mREIT company. Since there is credit risk when it comes to non-agency MBS and residential whole loans, leverage ratios are typically lower when investing in these securitizations/investments when compared to agency MBS (even when credit risk remains low). 2020's historic volatility within this specific sector temporarily caused most mREIT peers to deleverage which has still led to some near-term "disruptions" regarding leverage ratios. Over time, this should return to more historical averages (will still take time though). Chimera Investment Corp. (CIM), Ellington Financial Inc. (EFC) (converted to a REIT in 2019), MFA Financial Inc. (MFA), AG Mortgage Investment Trust Inc. (MITT), New York Mortgage Trust Inc. (NYMT), and Western Asset Mortgage Capital Corp. (WMC) are currently classified as a hybrid mREIT.
Third, there are mREIT companies that invest in (but are not limited to) a combination of agency MBS, non-agency MBS, credit risk transfers ("CRT"), other mortgage-related investments (including direct originations of mortgages and/or correspondent production), non-securitized debt investments (including residential, multifamily, and commercial loans), and mortgage servicing rights ("MSR"). There are also mREIT companies that have underlying subsidiaries that originate mortgage-related/debt products. I believe New Residential Investment Corp. (NRZ), PennyMac Mortgage Investment Trust (PMT), and Ready Capital Corp. (RC) should currently be classified as an "originator and servicer" mREIT. Since NRZ and PMT currently have at least a modest portion of the company's investment portfolio in MSR and MSR-related investments which act as an "indirect" hedge (the same can be said regarding interest only [IO] securities), these companies do not need to utilize as high of a hedging coverage ratio when compared to the agency mREIT sub-sector (some could even argue to not have derivative instruments in place; if anything, "contra" hedges to counter a drop in rates/yields). Indirect hedges are not calculated within each company's hedging coverage ratio within this analysis (not the main purpose of these investments). As I have pointed out in the past, these investments actually benefit, from a valuation standpoint, in a rising interest rate environment as prepayment risk (and in a majority of scenarios credit risk) decreases while there is an increase in projected future discounted cash flows (and vice versa).
Finally, there are mREIT companies that basically solely invest in non-securitized, commercial whole loans with underlying collateral (real estate) tied to offices, multifamily units, hotels, retail stores, industrial complexes, and other miscellaneous types of properties. Regarding the two commercial whole loan mREIT peers I currently cover, Blackstone Mortgage Trust, Inc. (BXMT) and Granite Point Mortgage Trust Inc. (GPMT), these companies typically originate/invest in variable-rate, interest-only senior secured (typically first lien) debt. Since BXMT and GPMT both had 98%+ of their investment portfolio in variable-rate debt as of 12/31/2021, these companies currently do not need to utilize a high hedging coverage ratio (some could even argue to not have derivative instruments in place; LIBOR floors are a good substitute as well). Now let us start the comparative analysis between NLY and the 19 mREIT peers.
Leverage, Hedging Coverage Ratio, BV, Economic Return (Loss), and Premium (Discount) to Estimated Current BV Analysis - Overview:
Let us start this analysis by first getting accustomed to the information provided in Table 1a and 1b below. This will be beneficial when explaining how NLY compares to the 19 mREIT peers in regards to the metrics stated earlier.
Table 1a - mREIT Asset Composition, Leverage, Hedging Coverage Ratio, and Change in Investment Portfolio Size
The REIT Forum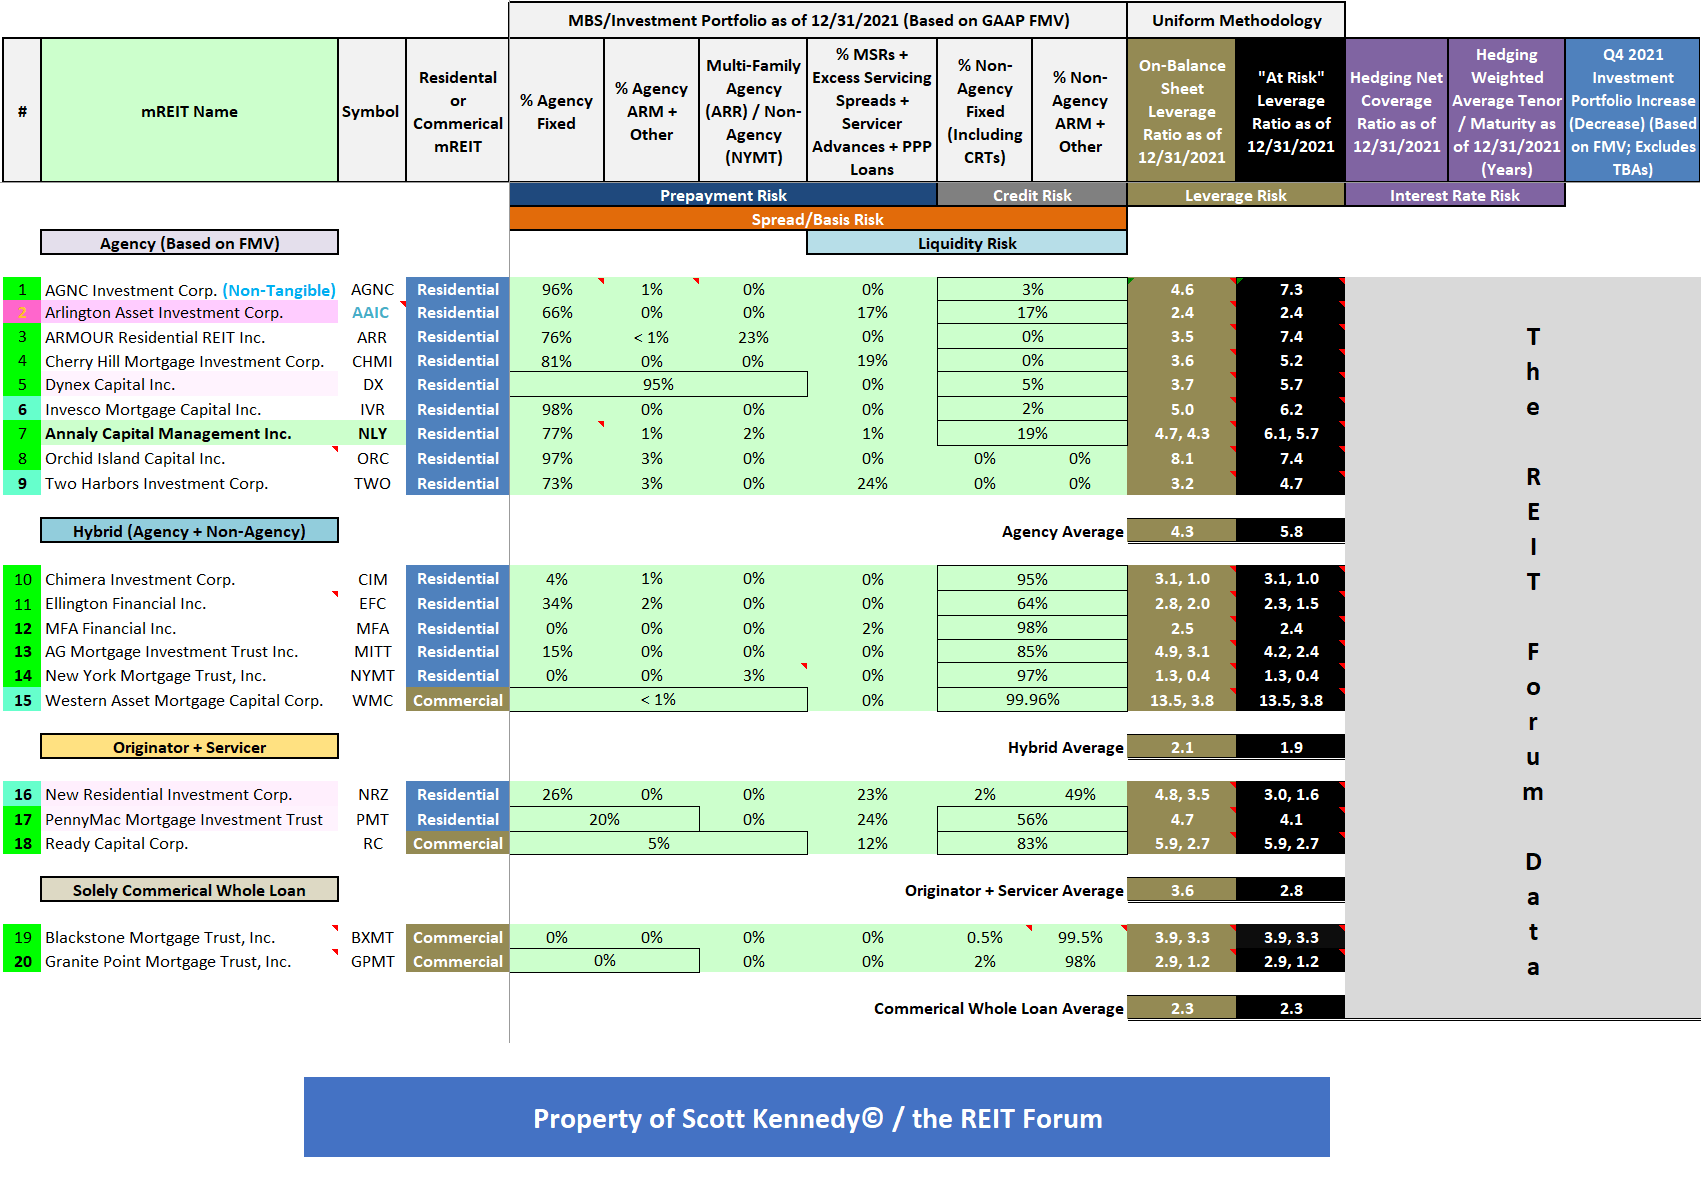
(Source: Table created by me, calculating asset compositions, leverage, and hedging coverage ratios from data provided by the SEC's EDGAR Database)
Table 1a above provides the following information on NLY and the 19 mREIT peers (see each corresponding column): 1) generalized MBS/investment portfolio composition as of 12/31/2021; 2) on-balance sheet leverage ratio as of 12/31/2021; 3) at-risk (total) leverage ratio as of 12/31/2021; 4) hedging coverage ratio as of 12/31/2021; 5) hedging weighted average tenor/maturity; and 6) change in investment portfolio size (excludes off-balance sheet transactions). Regarding the notion some mREIT peers have "two sets" of leverage ratios, I break out both non-recourse and recourse leverage. Within the two sets of leverage ratios within one column, recourse leverage ratios are represented by the lower figure on the right-hand side and are deemed more important.
Table 1b - BV, Economic Return (Loss), and Premium (Discount) to Estimated Current BV Analysis
The REIT Forum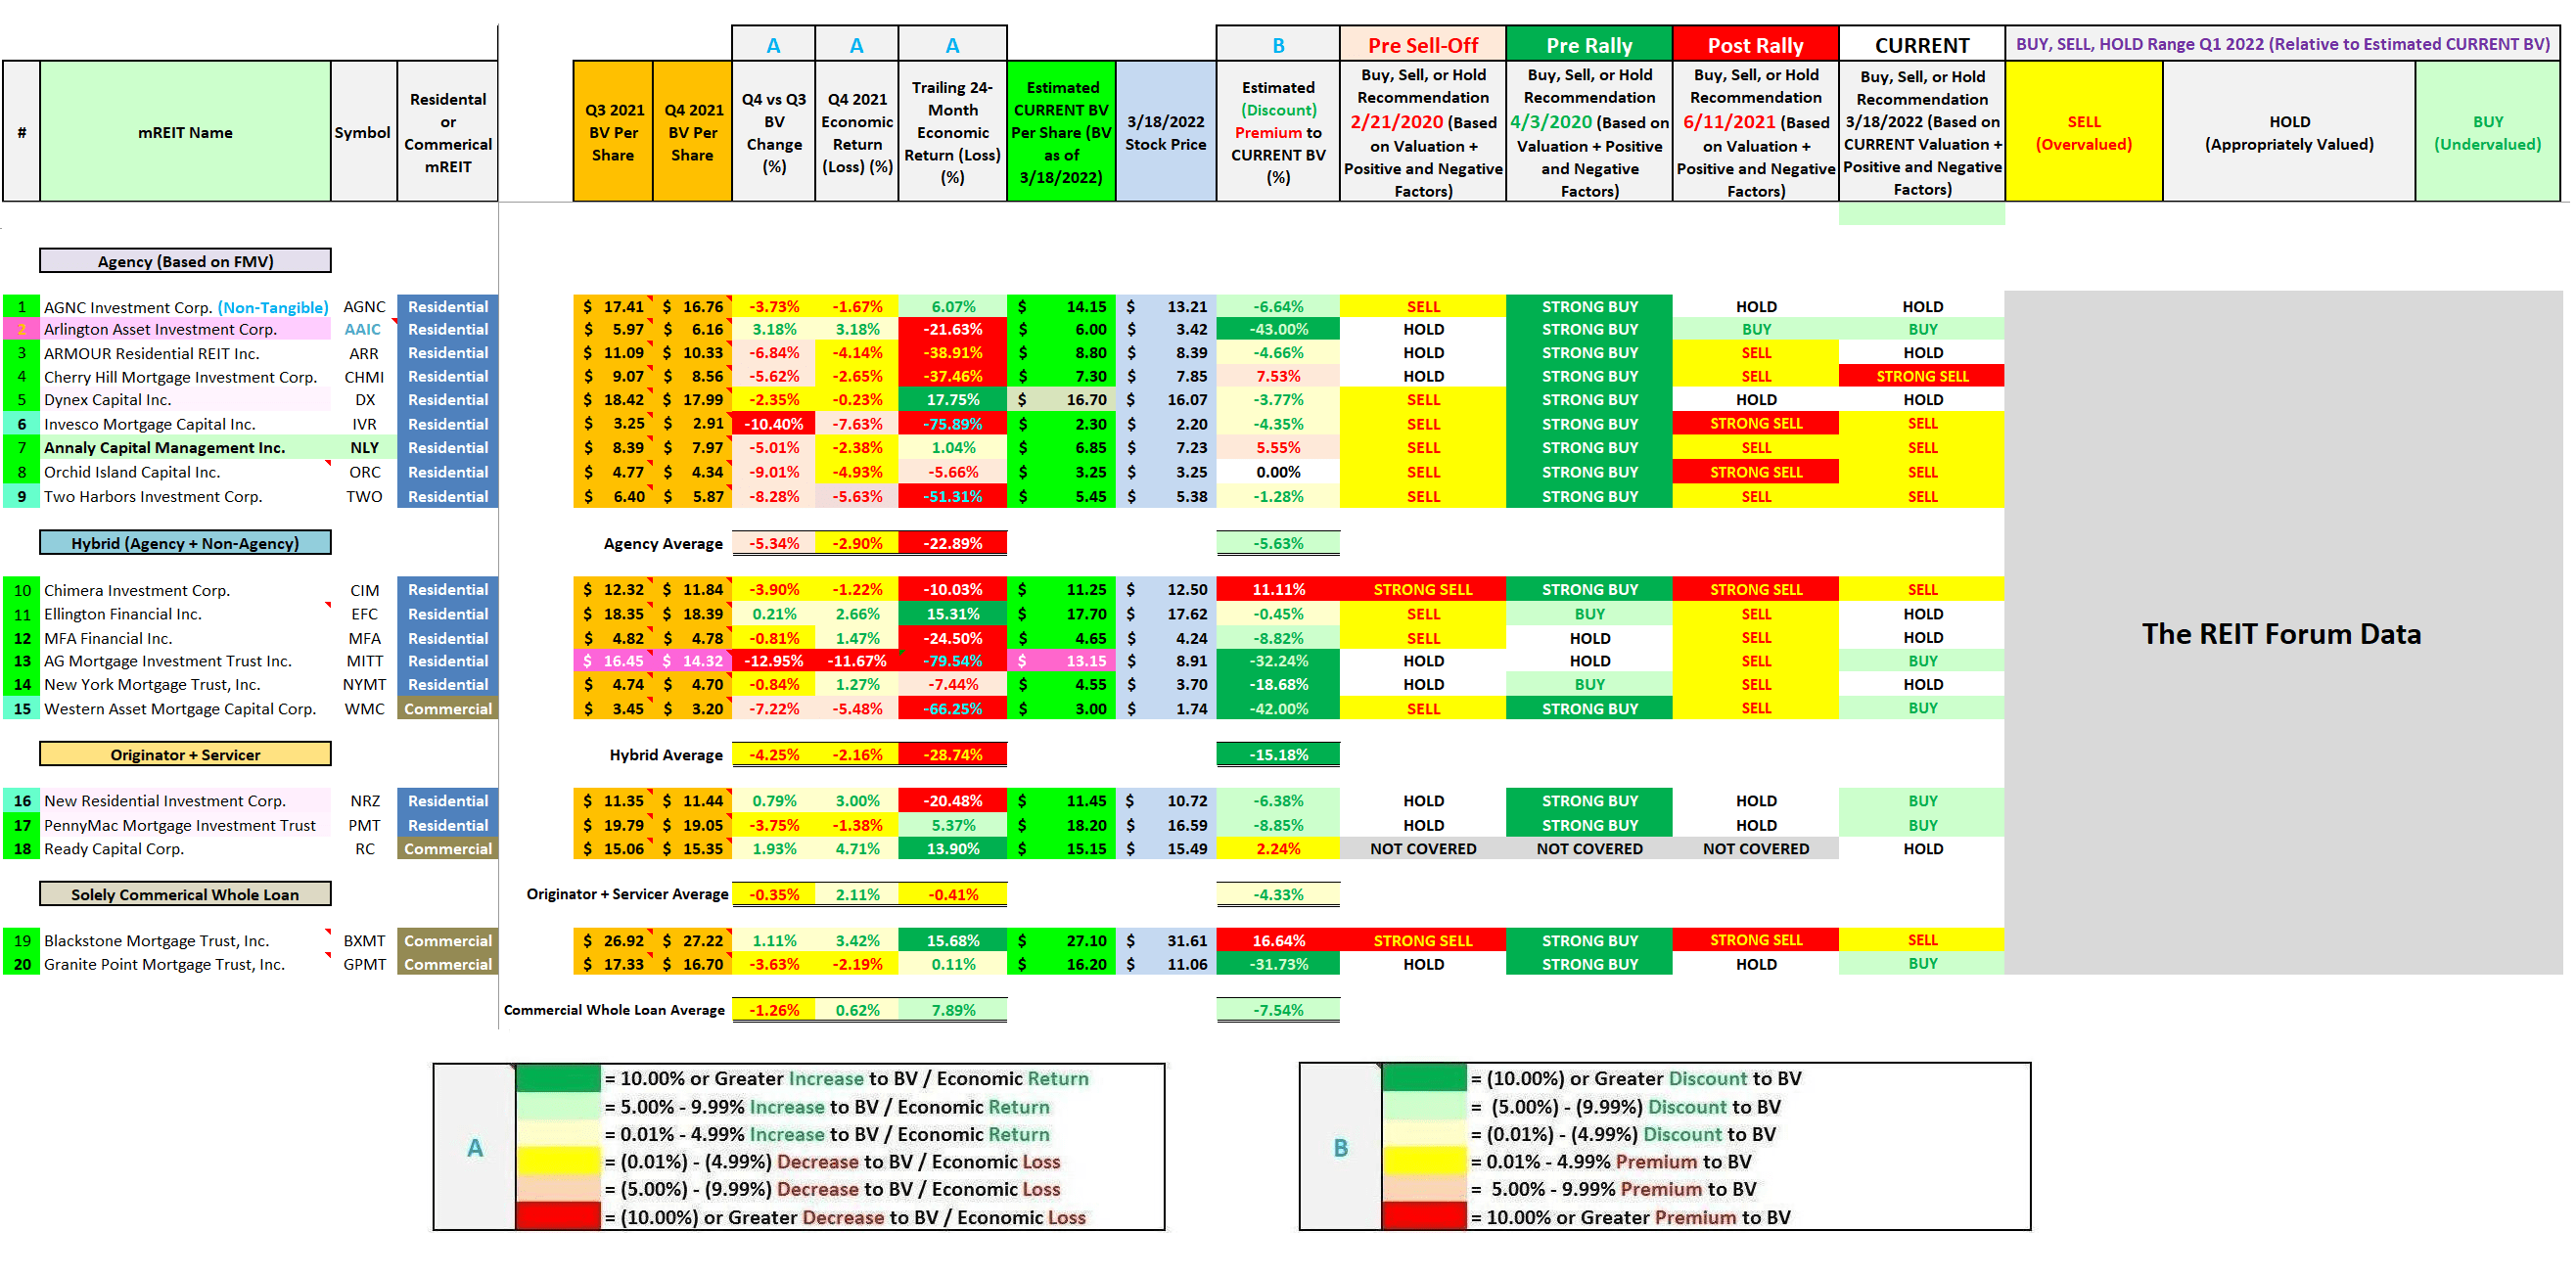
(Source: Table created by me, obtaining historical stock prices from NASDAQ and each company's 9/30/2021 and 12/31/2021 BV per share figures from the SEC's EDGAR Database [link provided below Table 1a])
Table 1b above provides the following information on NLY and the 19 mREIT peers (see each corresponding column): 1) BV per share at the end of the third quarter of 2021; 2) BV per share at the end of the fourth quarter of 2021; 3) BV per share change during the fourth quarter of 2021 (percentage); 4) economic return (loss) (change in BV and dividends accrued for/paid) during the fourth quarter of 2021 (percentage); 5) economic return (loss) during the trailing 24-months (percentage); 6) my estimated CURRENT BV per share (BV as of 3/18/2022); 7) stock price as of 3/18/2022; 8) 3/18/2022 premium (discount) to my estimated CURRENT BV (percentage); 9) 2/21/2020 BUY, SELL, or HOLD recommendation (pre market sell-off due to coronavirus [COVID-19]); 10) 4/3/2020 BUY, SELL, or HOLD recommendation (post majority of market sell-off due to COVID-19); 11) 6/11/2021 BUY, SELL, or HOLD recommendation (post majority of market rally due to COVID-19 epidemic and prior to more "hawkish" interest rate and monetary policy rhetoric); 12) 3/18/2022 BUY, SELL, or HOLD recommendation; and 13) BUY, SELL, and HOLD percentage recommendation range, relative to my estimated CURRENT BV.
Analysis of NLY:
As of 12/31/2021, NLY's investment portfolio consisted of 77% and 1% fixed- and variable-rate agency MBS holdings, respectively (based on FMV). When compared to 9/30/2021, NLY's percentage of fixed- and variable-rate agency MBS decreased (2%) and remained unchanged, respectively. NLY also had a 2% and 1% multifamily agency MBS and MSR sub-portfolio, respectively. When calculated, this was a decrease of (1%) and remained unchanged, respectively. Finally, NLY continued to invest in non-agency MBS and non-MBS holdings which accounted for 19% of the company's investment portfolio balance as of 12/31/2021 which was an increase of 3%. This included NLY's investments in preferred equity, corporate debt, middle market ("MM") lending, and seniors housing. Last year, NLY sold basically the company's entire commercial real estate sub-portfolio to Slate Asset Management L.P. ("Slate") for $2.33 billion. This sale closed/was finalized during the third quarter of 2021.
Using Table 1a above as a reference, when excluding borrowings collateralized by assets held in "securitization trusts" (non-recourse debt), NLY had an on-balance sheet leverage ratio of 4.3x while the company's at-risk (total) leverage ratio, when including its off-balance sheet net long "to-be-announced" ("TBA") MBS position, was 5.7x as of 12/31/2021. NLY had an on-balance sheet and at-risk (total) leverage ratio of 4.2x and 5.8x as of 9/30/2021, respectively. As such, NLY slightly increased the company's on-balance sheet leverage while slightly decreasing its at-risk (total) leverage during the fourth quarter of 2021. This was mainly due to a very minor on-balance sheet portfolio increase (mainly non-agency) within NLY's investment portfolio "countered" by a minor decrease to the company's off-balance sheet net long TBA MBS position.
As of 12/31/2021, NLY had the 4th lowest at-risk (total) leverage ratio when compared to the 8 other agency mREIT sub-sector peers within this analysis. Due to the notable impacts from the COVID-19 pandemic to the mREIT sector when it came to the quick "spike" in leverage and liquidity risk (rising credit risk more of a longer-term impact regarding all non-agency investments), outside the commercial whole loan mREIT peers (BXMT and GPMT), all sector peers I currently cover had various strategies at play when it comes to investment portfolio composition and risk management strategies. Even when several mREIT peers had very similar MBS/mortgage-related investments, 2020 strategies notably differed from company-to-company. Directly dependent on the amount/percentage of margins calls on certain outstanding borrowings (and the underlying investments pledged as collateral) and derivative instruments, most mREIT peers had a notable change in 2020 leverage ratios. Due to NLY's overall size and asset composition, this company was not "forced" to de-lever to the same extent as some of the smaller-capitalized agency mREIT peers (more "cushion" when it came to its existing capital base).
Previously, management implied NLY had a fairly "defensive posture" in regards to leverage during 2017-2018 due to the risk of widening spreads/lower MBS prices as Federal ("Fed") monetary policy dictated broader market dynamics (in particular, the Fed Funds Rate and the Fed Reserve's non-reinvestment of U.S. Treasuries and agency MBS). However, with the Fed's more "dovish" rhetoric in 2019 regarding U.S. monetary policy over the foreseeable future, I previously correctly anticipated NLY would increase leverage which was consistent with agency mREIT sector trends as net spreads narrowed. This benefited most mREIT peers during the fourth quarter of 2019.
However, this led to more severe BV declines during the first quarter of 2020 when the COVID-19 "pandemic panic" occurred across all financial markets (especially March). This was partially offset during the second quarter of 2020 as MBS pricing/valuations (and most other mortgage-related investments outside some CMBS and commercial whole loans) rebounded in price/valuation as financial panic/stress eased (mainly due to the Fed's swift response regarding financial assistance and monetary policy). This general trend continued into the third and fourth quarters of 2020 as broader market pricing/valuations (outside isolated pockets) rebounded further. As such, most mREIT peers reported BV increases during the third and fourth quarters of 2020 (including NLY).
During the first quarter of 2021, even though severe agency MBS price decreases occurred within lower coupons, spreads notably tightened within most derivative instruments which led to outperformance within certain agency mREIT peers (and broader sector peers) who utilized higher hedging coverage ratios (especially with higher duration hedges). However, during the second quarter of 2021, I believe markets finally started to begin pricing in the eventual announcement of the Federal Open Market Committee ("FOMC") to begin its asset tapering program. Remember, the market is always "forward thinking" in its processes. As such, speculation appeared to be on the rise in my opinion. The Fed was previously purchasing $80 billion of U.S. Treasury securities and $40 billion in agency MBS each month. This fear/speculation directly resulted in a widening of spreads within fixed-rate agency MBS relative to derivative instrument valuations this past summer (increase in spread/basis risk).
Moving to more recent trends, during the first two weeks of June 2021, along with the first couple weeks of July 2021, markets experienced a modest widening of spreads between most agency MBS coupons (including specified pools) versus interest rate payer swaps, net (short) U.S. Treasury securities, and Eurodollar futures. As such, derivative valuation decreases "trumped", in basically all coupons and characteristics, MBS price fluctuations. Simply put, this negatively impacted BVs within the agency mREIT sub-sector (and to a lesser degree other mREIT peers who invest in agency MBS and utilize derivative instruments designed to combat interest rate risk) during the second quarter of 2021.
This trend continued into July-August 2021 to some extent (just not as severe). Some of this risk temporarily abated in September-October 2021 but "re-announced itself" beginning in November 2021. This most recent rise in spread/basis risk has been anticipated and continuously pointed out to subscribers of the REIT Forum over the past 6+ months. This is important to understand. I believe this was mainly the result of economic indicators/reports showing strong inflationary data. Typically, strong inflationary data results in an increase to rates/yields as we saw in September 2021 and again in early November 2021.
FOMC Chairman Powell stated there was strong data to suggest quickening the Fed's asset tapering program due to strong inflationary data (mainly via the Consumer Price Index; CPI). This led to a faster "lift-off" of the Fed Funds Rate versus previous expectations. This was a bit of a "curveball" for markets as this was a new Fed narrative. The change in monetary policy directly impacted the shorter-end of the yield curve with all rates/yields with 1-, 2-, and -3-year maturities modestly increasing during the second half of 2021. This narrative "shifted" the timing for the both the end of the Fed's quantitative easing program ("QE4") and the "lift-off" of the Fed Funds Rate. Instead of the Fed's asset tapering program ending in June 2022, recent events caused "peg" QE4 to end by March 2022 (3 months earlier). This was all but confirmed by Mr. Powell during his press conference after the FOMC's December 2021 and January 2022 meetings. This, in turn, led to market participants accelerating the dates for when the Fed Funds Rate will increase from its 0-25 basis point ("bp") range (and multiple subsequent raises).
Most market participants recently expected the Fed Funds Rate to be in a range of 150-225 bps (1.50%-2.25%) by the end of 2022. My personal projection is the Fed Funds Rate will be in a range of 1.00%-1.50% by the end of 2022. When compared to the past month, my personal range/projection has remained unchanged.
Bringing this back to the stock market, this will cause an eventual increase in borrowing costs throughout financial markets. This has recently already been mostly "baked" into financial markets. Simply put, this has (and will continue) put some pressure on financial markets/equity valuations/multiples in my professional opinion. As such, some general caution remains warranted regarding stock market performance as a whole. I believe early 2022 has been a great example regarding how markets will typically react to the perception of rising interest rates in general (lower market multiples; especially in high growth sectors like technology).
Regarding the mREITs, this will eventually have a negative impact on repurchase ("repo") agreement borrowing costs; especially on agency MBS. Average agency MBS repo rates have remained in a tight range of 0.10%-0.25% since the spring of 2020. As a reminder, there is a very strong, direct relationship between the Fed Funds Rate and agency repo agreement rates. As such, this accelerated timeline will likely cause slightly-modestly higher agency repo agreement rates during 2022. However, this will still take time to develop. This is NOT an immediate impact. In addition, the general notion is there will be some "relief" on conditional/constant prepayment rates ("CPR") which would lead to lower premium amortization expense which would help alleviate rising borrowing costs from a net spread perspective. This assumes the long-end of the yield curve, when compared to the short-end, does not "invert". Furthermore, with likely agency MBS price decreases and higher available coupons with new supply, new purchases would likely have a better overall yield versus purchases during 2020-2021. Companies who "locked in" some very low-low interest rate payer swaps/swaptions would also record less of an expense/more income with rising short-term interest rates for some time.
So, pressure on most mREIT BVs but eventually a better earnings outlook; especially for agency mREITs (as long as management teams correctly formulate and act upon a correct investment and derivative portfolio strategies). As I have always stated, the mREIT business model is always a balancing act. Management teams just have to correctly identify which type of economic cycle is likely to occur over the foreseeable future and set up strategies to both mitigate risk and accelerate earnings. Each company's prospects are factored into mREIT's recommendation ranges and general risk rating.
Generally speaking, during late November 2021-March 2022, agency MBS has underperformed their derivative instrument counterparts. This has caused the aforementioned rise in spread/basis risk during the second half of the fourth quarter of 2021-March 2022 which has negatively impacted most sector BVs. Specifically regarding spread/basis risk, I believe markets have already priced in the FOMC's asset tapering program, recent lift-off of the Fed Funds Rate, and most recently the reduction of the Fed's balance sheet. Remember, the market is always "forward thinking" in its processes.
Moving on, NLY had a BV of $8.39 per common share at the end of the third quarter of 2021. NLY had a BV of $7.97 per common share at the end of the fourth quarter of 2021. This calculates to a quarterly BV decrease of ($0.42) per common share or (5.01%). When including NLY's quarterly dividend of $0.22 per common share, the company had an economic loss of ($0.20) per common share or (2.38%) for the third quarter of 2021. When compared to fixed-rate agency mREIT peers like AGNC and DX, a minor underperforming quarter from a BV perspective.
I correctly projected most agency mREIT companies would experience a modest BV decrease during the fourth quarter of 2021. I also correctly projected the agency mREIT sub-sector would slightly modestly underperform the hybrid, originator and servicer, and commercial whole loan mREIT sub-sectors regarding BV fluctuations during the fourth quarter of 2021. Each mREIT's earnings results for the fourth quarter of 2021 were previously discussed with Marketplace subscribers in "real time" through earnings chat notes and subsequent earnings articles.
Let us now discuss NLY's MBS and derivatives portfolios to spot certain characteristics which will impact future results. Table 2 below provides NLY's proportion of fixed- and variable-rate agency MBS holdings as of 12/31/2021 versus 9/30/2021 (the vast majority of the company's investment portfolio).
Table 2 - NLY Agency MBS Portfolio Composition (12/31/2021 Versus 9/30/2021)
Annaly Capital Website Annaly Capital Website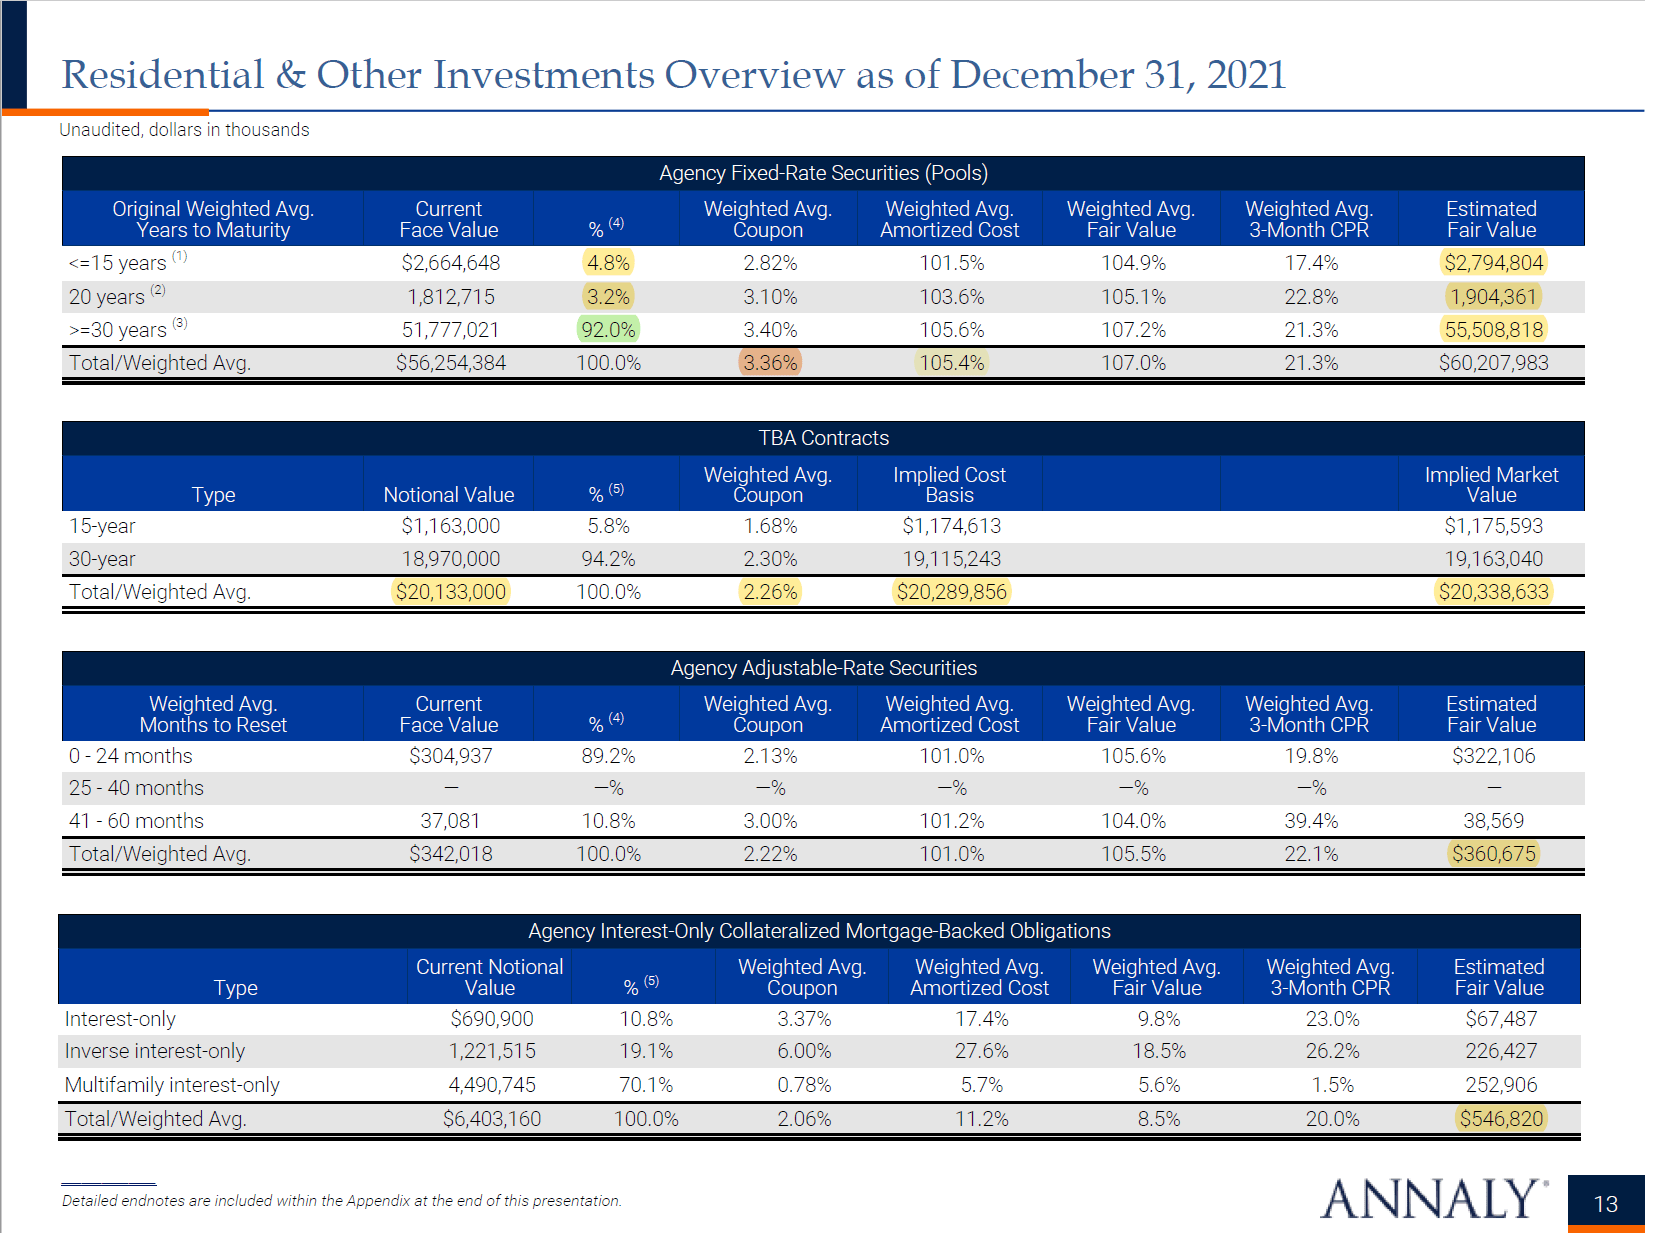
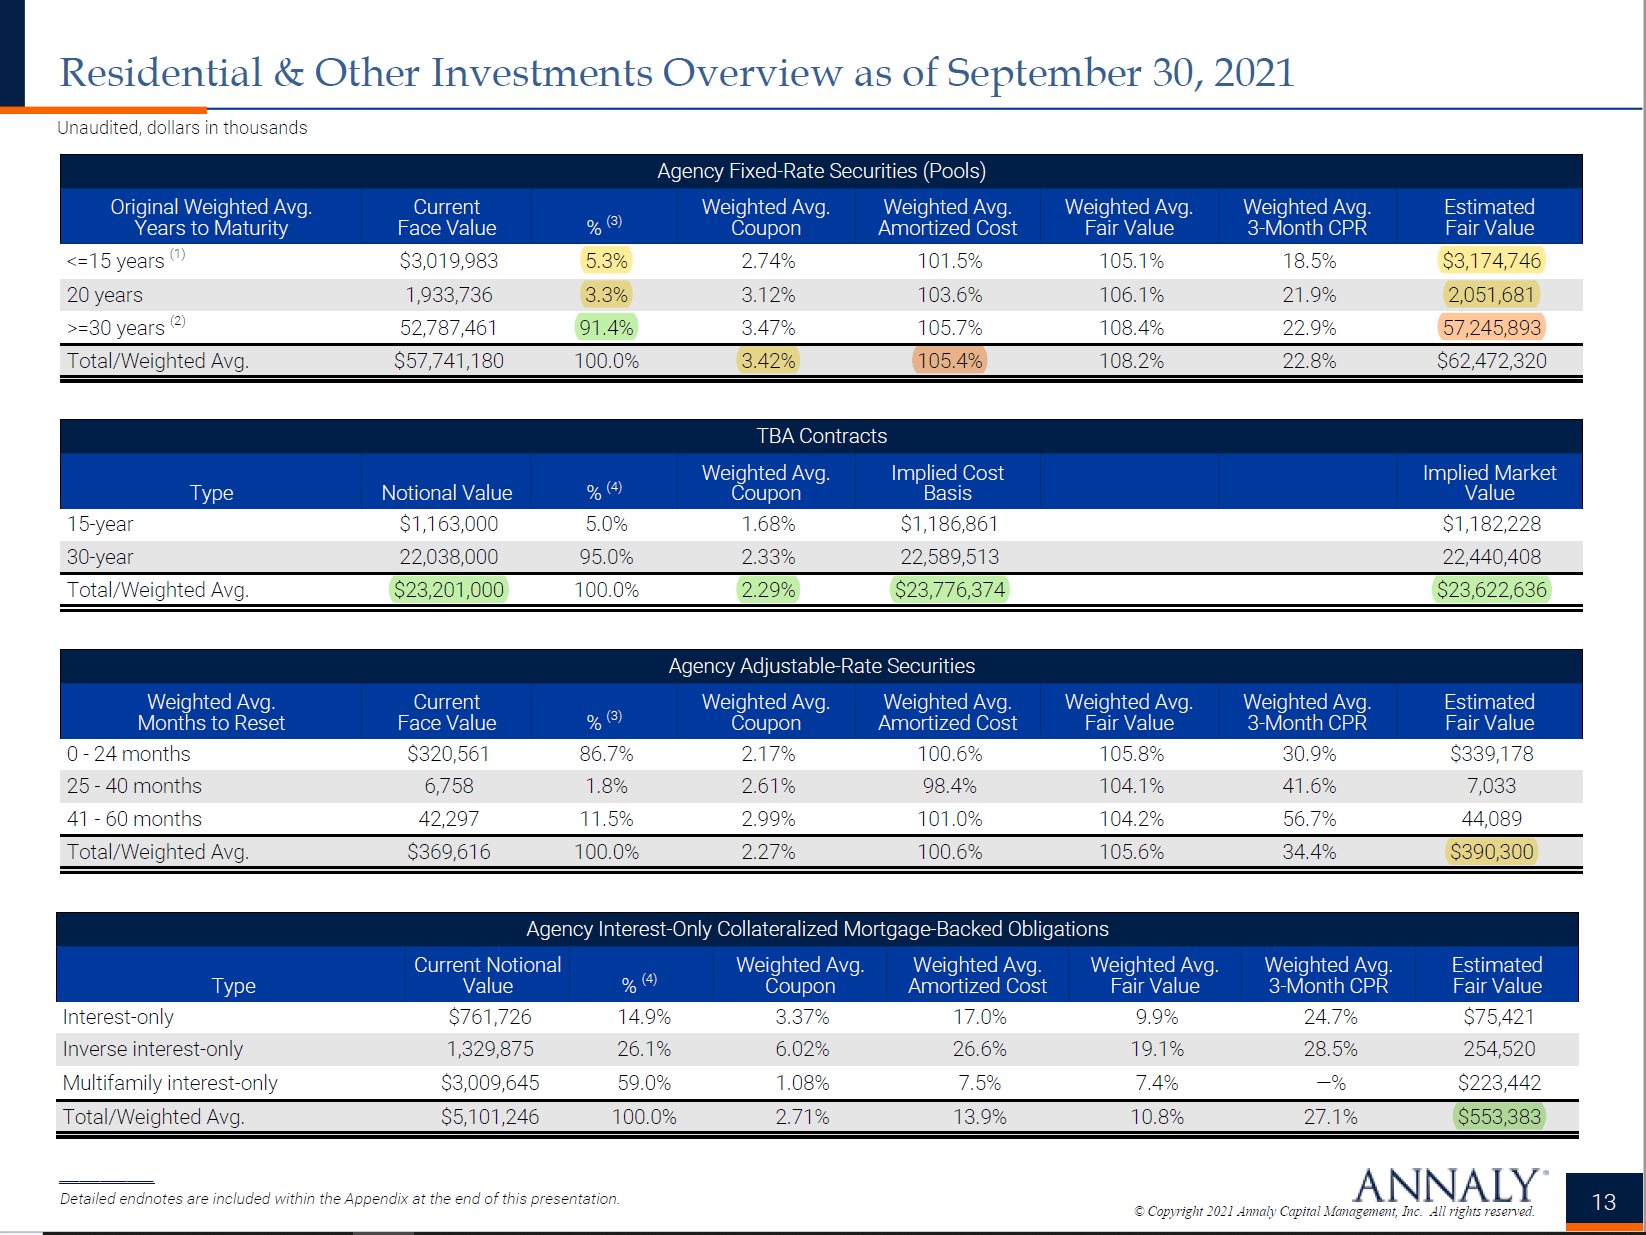
(Source: Table obtained [with added highlights] from NLY's quarterly shareholder presentation for the third and fourth quarters of 2021. Permission for use has previously been granted by NLY's investor relation's department [copyright shown in slides].)
Using Table 2 above as a reference, NLY continued to maintain a portfolio heavily invested in 30-year fixed-rate agency MBS holdings during the fourth quarter of 2021. NLY's proportion of 15-year fixed-rate agency MBS holdings very slightly decreased from 5.3% to 4.8% during the quarter (based on par/face value). NLY's proportion of 20-year fixed-rate agency MBS holdings very slightly decreased from 3.3% to 3.2%. As such, NLY's proportion of 30-year fixed-rate agency MBS very slightly increased from 91.4% to 92.0%. When compared to a fixed-rate agency mREIT peer like ARR, NLY continued to have a higher proportion of 30-year fixed-rate agency MBS holdings during the fourth quarter of 2021. NLY had a similar proportion when compared to AGNC and ORC.
NLY's on-balance sheet fixed-rate agency MBS holdings had a weighted average coupon ("WAC") of 3.36% as of 12/31/2021 which was a (6) basis points ("bps") decrease when compared to 9/30/2021. This provides direct evidence NLY had some higher coupon fixed-rate agency MBS sales/"roll-off"/prepayments during the quarter. Continuing a trend from the past 7 quarters, NLY's TBA MBS position had a notably lower WAC of just 2.26% which was consistent with a few other fixed-rate agency mREIT peers regarding forward/generic MBS strategies (lower coupons generally equate to less prepayment risk). In addition, NLY's weighted average three-month conditional prepayment rate ("CPR") decreased from 22.8% to 21.3% which was also a fairly consistent trend across the sector as mortgage interest rates increased by the end of the fourth quarter of 2021 (a bit of a "delayed" impact to this metric; including seasonal trends). Let us now move on to NLY's derivatives portfolio.
While management has, in the past, diversified the company's investment portfolio into less interest rate sensitive holdings (lower durations), a majority of the company's investment portfolio (from a valuation standpoint) was still in fixed-rate agency MBS. Along with the "plummet" in the Fed Funds Rate to near 0% in March 2020 (which also caused a proportionately large decrease to the London Interbank Offered Rate ("LIBOR") across all tenors/maturities and all other applicable short-term funding/interest rates) and subsequent margin calls in certain derivative instruments, NLY notably reduced the company's hedging coverage ratio during the first quarter of 2020. As NLY entered into new interest rate swap contracts during the second, third, and fourth quarters of 2020 (at notably more attractive terms), management gradually "rebuilt" the company's derivatives portfolio. NLY basically maintained this previously built-up derivatives portfolio during the first, second, and third quarters of 2021 (slight alterations within several sub-accounts). With the risk of continued higher mortgage interest rates/U.S. Treasury yields heading into 2022, management became more defensive during the fourth quarter of 2021. To highlight the recent activity within NLY's derivatives portfolio, Table 3 is presented below.
Table 3 - NLY Hedging Coverage Ratio (12/31/2021 Versus 9/30/2021)
The REIT Forum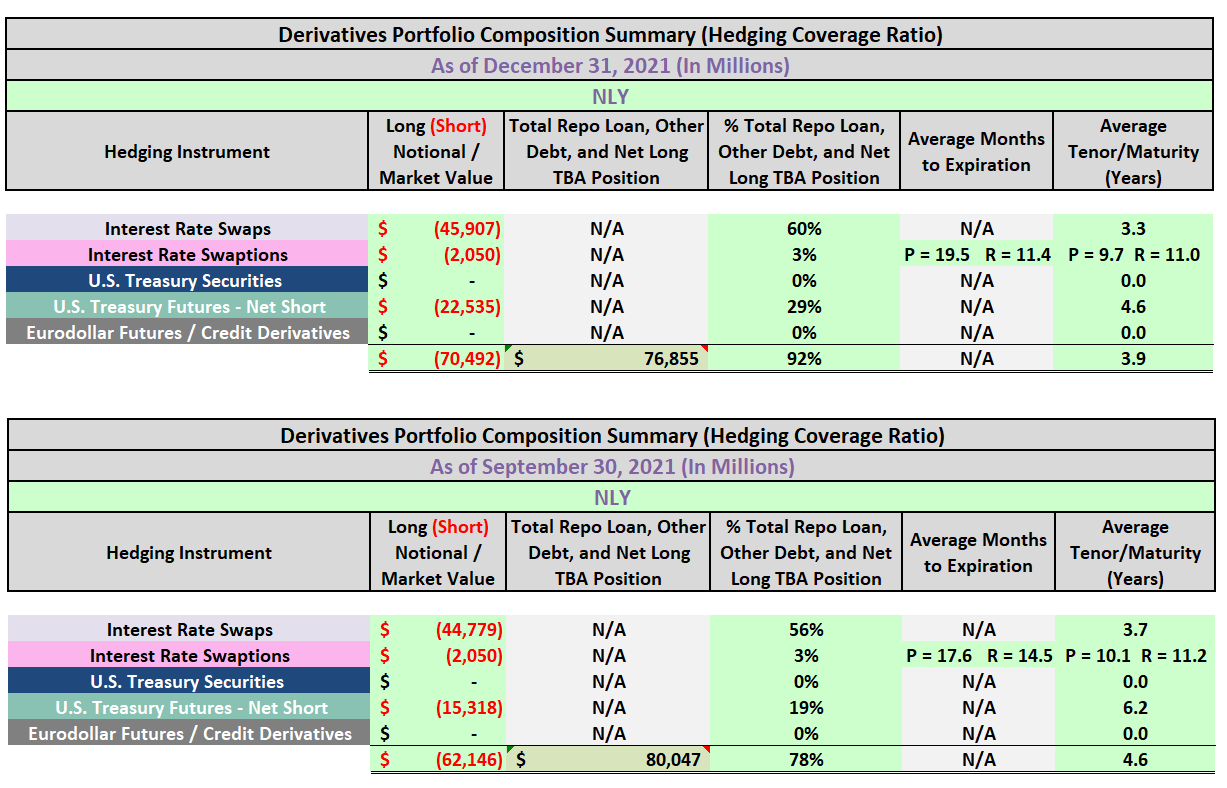
(Source: Table created by me, partially using NLY data obtained from the SEC's EDGAR Database [link provided below Table 1a])
Using Table 3 above as a reference, NLY had a net (short) interest rate swaps and swaptions position of ($44.8) and ($2.1) billion as of 9/30/2021, respectively (based on notional value). NLY also had a net (short) U.S. Treasury futures position of ($15.3) billion. When calculated, NLY had a hedging coverage ratio of 78% as of 9/30/2021. When compared to the 8 other agency mREIT peers within this analysis, this was slightly above the average hedging coverage ratio of 70% as of 9/30/2021.
NLY had a net (short) interest rate swaps and swaptions position of ($45.9) and ($2.1) billion as of 12/31/2021, respectively. NLY also had a net (short) U.S. Treasury futures position of ($22.5) billion. When calculated, NLY's hedging coverage ratio modestly increased to 92% as of 12/31/2021. This was now modestly above the agency mREIT average hedging coverage ratio of 73% as of 12/31/2021.
Once again using Table 1b above as a reference, as of 3/18/2022 NLY's stock price traded at $7.23 per share. When calculated, NLY's stock price was trading at a 5.55% premium to my estimated CURRENT BV (BV as of 3/18/2022). Simply put, NLY's stock price traded at a modest (at or great than a 5% but less than a 10%) premium to my estimated CURRENT BV and at a modestly-notably higher valuation when compared to the average of other agency mREIT peers within Table 1b. When tracking historical trends, NLY typically trades at a higher valuation (less of a discount/more of a premium) to the company's agency mREIT peers. I continue to believe NLY "deserves" to trade at a slightly-modestly higher valuation (which has been explained in various mREIT sector articles and through the REIT Forum discussions). As such, NLY is currently a bit "pricey" in my professional opinion. I believe the 24-month total economic return (loss) metric is a great tool in spotting each mREIT's historical performance. A great tool when also considering future expectations versus peers. As such, as stated later in the article, I currently believe NLY is slightly overvalued from a stock price perspective.
Comparison of NLY's Recent Economic Return (Loss), Leverage, Hedging Coverage Ratio, and Valuation to 19 mREIT Peers (Solely for REIT Forum Subscribers):
Conclusions Drawn (PART 1):
PART 1 of this article has analyzed NLY and 19 mREIT peers in regards to the following metrics: 1) trailing 24-month economic return (loss); 2) leverage as of 12/31/2021; 3) hedging coverage ratio as of 12/31/2021; and 4) premium (discount) to my estimated CURRENT BV.
First, NLY's trailing 24-month economic return was more attractive versus the agency and broader mREIT sector average. NLY outperformed most of the company's agency mREIT peers regarding this metric but modestly underperformed when compared to one of its closest sector peers, AGNC. This was mainly due to the recent composition of NLY's MBS/investment and derivatives portfolio and the net movement of mortgage interest rates/U.S. Treasury yields during this timeframe. Due to NLY's overall size and agency MBS liquidity, this company fared much better versus most mREIT sector peers during the COVID-19 pandemic. I believe this specific metric clearly shows this notion.
Second, NLY's at-risk (total) leverage as of 12/31/2021 was modestly above the mREIT sector average. However, when compared to the company's fixed-rate agency mREIT peers within this analysis, NLY's at-risk leverage ratio was near average. Over the prior several years, NLY typically ran below average leverage versus the company's fixed-rate agency mREIT peers.
Third, NLY's hedging coverage ratio was now modestly above the agency mREIT average as of 12/31/2021. As a whole, most mREIT peers notably decreased their hedging coverage ratios during the first half of 2020. While this is would certainly "ring the alarm bells" if markets experienced a rapid rise in mortgage interest rates/U.S. Treasury yields, this scenario basically did not play out during 2020. As such, most mREITs "got away" with utilizing a lower number of derivative instruments when compared to 2018-2019. That said, mortgage interest rates/medium- to long-term U.S. Treasury yields modestly-notably increased during the first quarter of 2021. However, especially for agency mREITs, these ratios increased during the remainder of 2020-early 2021 as the yield curve, during that timeframe, gradually steepened which was generally a correct strategy (to mitigate MBS valuation losses). However, these higher hedging coverage ratios came back to "bite" most agency mREIT peers during the second quarter of 2021 as the yield curve flattened and spread/basis risk increased. This directly resulted in the varying severities of BV decreases reported by all peers within the agency mREIT sub-sector. This trend generally reversed course during the third and fourth quarters of 2021 as mREIT peers utilizing higher hedging coverage ratios were able to record to attractive derivative net valuation gains to help offset MBS price decreases. That said, spread/basis risk has been heightened during the fourth quarter of 2021-first quarter of 2022 which has led to modest-notable BV losses within the agency mREIT sub-sector (even within companies who have utilized higher hedging coverage ratios).
Finally, NLY's current valuation, when compared to my estimate of each mREIT's CURRENT BV (BV as of 3/18/2022), was now at a modestly-notably higher valuation versus the mREIT peer average within this analysis. Through the metrics provided within this two-part sector comparison article (including factors/metrics not discussed), I believe NLY "deserves" to trade at a slight-modest premium valuation to most mREIT peers (and in some cases a notable premium valuation). As such, this is one of the reasons why I believe NLY is currently slightly overvalued. I would strongly suggest readers consider CURRENT BVs (as opposed to prior period BVs) when assessing whether a stock is attractively valued or not. The REIT Forum subscribers have access to weekly BV projection updates.
When taking a look at the events/trends that have occurred during the first quarter of 2021 (through 3/18/2021), most agency MBS pricing has experienced very notable price decreases while there have been modest-notable valuation increases within most derivative instruments. A very negative-negative relationship between agency MBS pricing and derivative instrument valuations has recently occurred. Generally speaking, option adjusted spreads ("OAS") have notably widened during the first quarter of 2022. Dependent upon the metrics laid out in the tables above, results across the broader mREIT sector will notably vary from peer-to-peer; dependent upon specific asset classifications and risk management strategies.
The relationship between MBS/investment pricing and derivative instrument valuations needs to be constantly monitored (which I continually perform throughout the quarter). If I start to see a more notable positive/negative relationship unfold, I will inform readers through several avenues within Seeking Alpha (through articles, the live chat feature of The REIT Forum, and/or comments). Remember, I/we were already projecting a rise in spread/basis risk towards the end of 2021 and I have personally continued to reiterate this point for the past 6+ months through various avenues (especially through the REIT Forum). I currently anticipate this negative trend/event will begin to dissipate this spring. Again, I/we always try to remain "non-bias" in our investing approach and it has proven to be correct over multiple interest rate/economic cycles.
My BUY, SELL, or HOLD Recommendation:
From the analysis provided above (using Table 1b as a reference), including additional catalysts/factors not discussed within this article, I currently rate NLY as a SELL when I believe the company's stock price is trading at or greater than a 5% premium to my projected CURRENT BV (BV as of 3/18/2022; $6.85 per share), a HOLD when trading at less than a 5% premium through less than a (5%) discount to my projected CURRENT BV, and a BUY when trading at or greater than a (5%) discount to my projected CURRENT BV. These percentage ranges are unchanged when compared to my last public NLY article (approximately 3 months ago).
Therefore, I currently rate NLY as a SELL (however, very close to my/our HOLD range).
As such, I currently believe NLY is slightly overvalued from a stock price perspective. My current price target for NLY is approximately $7.20 per common share. This is currently the price where my recommendation would change to a HOLD. The current price where my recommendation would change to a BUY is approximately $6.50 per common share.
Along with the data presented within this article, this recommendation considers the following mREIT catalysts/factors: 1) projected future MBS/investment price movements; 2) projected future derivative valuations; and 3) projected near-term dividend per share rates. These recommendations also consider the 8 Federal ("Fed") Funds Rate increases by the FOMC during December 2016-2018 (a more hawkish tone/rhetoric when compared to 2014-2016), the three Fed Funds Rate decreases during 2019 due to the more dovish tone/rhetoric regarding overall monetary policy as a result of recent macroeconomic trends/events, and the very quick "plunge" in the Fed Funds Rate to near 0% in March 2020. This also considers the previous wind-down/decrease of the Fed Reserve's balance sheet through gradual runoff/partial non-reinvestment (which began in October 2017 which increased spread/basis risk) and the prior "easing" of this wind-down that started in May 2019 regarding U.S. Treasuries and August 2019 regarding agency MBS (which partially reduced spread/basis risk when volatility remained subdued). This also considers the early Spring 2020 announcement of the start of another round of quantitative easing ("QE") that includes the Fed specifically purchasing agency MBS (and "rolling over" all principal and interest payments into new agency MBS) which bolstered prices while keeping long-term/mortgage interest rates near historical lows (which lowered spread/basis risk for quite some time when volatility remained subdued). This also includes the recent "taper" of the Fed's most recent QE program regarding its monthly purchases of $80 billion of U.S. Treasury securities and $40 billion of agency MBS. This taper began in November 2021 and market speculation around this future event has already caused a rise in spread/basis risk this past summer and during the second half of the fourth quarter of 2021-first quarter of 2022 (as correctly previously anticipated). This includes the FOMC's recent accelerated taper and the continued rise in the Fed Funds Rate which began in March 2022. Spread/Basis risk should begin to abate during the spring of 2022.
mREIT Sector Recommendations as of 2/21/2020, 4/3/2020, 6/21/2021, and 3/18/2022:
Once again using Table 1b above as a reference, I want to highlight to readers what I/we conveyed to readers when it came to sector recommendations as of 2/21/2020 (pre COVID-19 sell-off), 4/3/2020 (post COVID-19 sell-off), 6/21/2021 (post COVID-19 rally), and 3/18/2022 (currently).
As of 2/21/2020, I/we had 0 STRONG BUY or BUY recommendations regarding the mREIT stocks currently covered.
As of 2/21/2020, I/we had a HOLD recommendation on the following mREIT stocks analyzed above (in no particular order): 1) AAIC; 2) ARR; 3) CHMI; 4) MITT; 5) GPMT; 6) NRZ; 7) NYMT; and 8) PMT.
As of 2/21/2020, I/we had a SELL recommendation on the following mREIT stocks analyzed above (in no particular order): 1) AGNC; 2) NLY; 3) ORC; 4) DX; 5) EFC; 6) MFA; 7) IVR; 8) TWO; and 9) WMC.
As of 2/21/2020, I/we had a STRONG SELL recommendation on the following mREIT stocks analyzed above (in no particular order): 1) CIM; and 2) BXMT.
As of 2/21/2020, I did not cover RC.
So, prior to the COVID-19 sell-off, as of 2/21/2020 I/we had 0 mREITs rated as a STRONG BUY or BUY, 8 rated as a HOLD, 9 rated as a SELL (including NLY), and 2 rated as a STRONG SELL. Simply put, at the time, out of my 8+ years of covering this particular sector on Seeking Alpha (2013-2022), this was one of the most "bearish" overall weekly recommendation range classifications I have provided (another one being in the summer of 2021; recommendations provided below). Investors who "heeded" this advice were, at least, able to "lock-in" some notable gains (as sector valuations "ran up" after positive Q4 2019 earnings) which helped offset subsequent sector/market losses. At this general point in time, this was in direct contradiction to most contributors that continually cover the mREIT sector. During February 2020, I sold medium-large sector positions in ARR, IVR, NRZ, and TWO (and disclosed such trades in "real-time"; same day they occurred).
As of 4/3/2020, I/we had a STRONG BUY recommendation on the following mREIT stocks analyzed above (in no particular order): 1) AGNC; 2) AAIC; 3) ARR; 4) CHMI; 5) DX; 6) IVR; 7) NLY; 8) ORC; 9) TWO; 10) CIM; 11) WMC; 12) NRZ; 13) PMT; 14) BXMT; and 15) GPMT.
As of 4/3/2020, I/we had a BUY recommendation on the following mREIT stocks analyzed above (in no particular order): 1) EFC; and 2) NYMT.
As of 4/3/2020, I/we had a HOLD recommendation on the following mREIT stocks analyzed above (in no particular order): 1) MFA; and 2) MITT.
As of 4/3/2020, I did not cover RC.
So, my/our outlook notably reversed course during late March-April 2020 as the market "pummeled" both strong and weak mREIT peers (notable price dislocations; in particular most agency mREIT peers). Our service quickly moved most recommendations to BUYS or STRONG BUYS immediately when this notable price dislocation was occurring. In addition, we quickly added proportionately large positions across several sector peers and "never looked backed" (subscribers to our service can attest to these positions as we disclose our trades in "real time" (the same day we place a place). As disclosed at the end of this article, in late March 2020 I purchased very large positions in AGNC and NLY. I subsequently purchased add-on positions in AAIC, CHMI, and GPMT in March-May 2020, along with several mREIT preferred stock and debt positions. Regarding my personal investing strategy, this was my most "aggressive" purchasing blocks of a particular sector since I began writing on Seeking Alpha in 2013 (where I disclosed my trades as factual support/proof).
As of 6/11/2021, I/we had a BUY recommendation on the following mREIT stock analyzed above (in no particular order): 1) AAIC.
As of 6/11/2021, I/we had a HOLD recommendation on the following mREIT stocks analyzed above (in no particular order): 1) AGNC; 2) DX; 3) NRZ; 4) PMT; and 5) GPMT.
Regarding these HOLD recommendations, I would point out a AGNC actually received a SELL recommendation for the week ending 6/5/2021 and GPMT received a SELL recommendation during the week ending 6/11/2021. This directly coincided with my AGNC and GPMT stock sale on 6/2/2021 and 6/8/2021, respectively.
As of 6/11/2021, I/we had a SELL recommendation on the following mREIT stocks analyzed above (in no particular order): 1) ARR; 2) CHMI; 3) NLY; 4) TWO; 5) EFC; 6) MFA; 7) NYMT; and 8) WMC.
As of 6/11/2021, I/we had a STRONG SELL recommendation on the following mREIT stocks analyzed above (in no particular order): 1) IVR; 2) ORC; 3) CIM; and 4) BXMT.
As of 6/11/2021, I did not cover RC.
So, after the COVID-19 rally but prior to the FOMC's more hawkish stance on monetary policy, as of 6/11/2021 I/we had 0 mREITs rated as a STRONG BUY, only 1 rated as a BUY, 5 rated as a HOLD (and 2 of those stocks had a SELL rating at some point during June 2021), 8 rated as a SELL (including NLY), and 4 rated as a STRONG SELL. Simply put, at the time, out of my 8+ years of covering this particular sector on Seeking Alpha (2013-2022), this was also one of the most "bearish" overall weekly recommendation range classifications I have provided. Investors who "heeded" this advice were, at least, able to "lock-in" some notable gains (as sector valuations "ran up" during the first half of 2021) which helped offset subsequent sector/market losses. At this general point in time, this was in direct contradiction to most contributors that continually cover the mREIT sector. During June 2021, I sold medium-very large sector positions in AGNC, GPMT, and NLY (and disclosed such trades in "real-time"; same day they occurred). At the time these 3 sales occurred, this comprised 81% of my mREIT sector common stock allocation.
Still using Table 1b above as a reference, I want to highlight to readers what I/we are conveying to subscribers when it comes to sector recommendations as of 3/18/2022 (last week's close).
As of 3/18/2022, with most peers reporting a notably lower stock price when compared to the summer of 2021, I/we have a BUY recommendation (undervalued) on the following mREIT stocks analyzed above (in no particular order): 1) AAIC; 2) MITT; 3) WMC; 4) NRZ; 5) PMT; and 6) GPMT.
As of 3/18/2022, I/we currently have a HOLD recommendation (appropriately valued) on the following mREIT stocks analyzed above (in no particular order): 1) AGNC; 2) ARR; 3) DX; 4) EFC; 5) MFA; 6) NYMT; and 7) RC.
As of 3/18/2022, I/we currently have a SELL recommendation (overvalued) on the following mREIT stock analyzed above (in no particular order): 1) IVR; 2) NLY; 3) ORC; 4) TWO; 5) CIM; and 6) BXMT.
As of 3/18/2022, I/we currently have a STRONG SELL recommendation (notably overvalued) on the following mREIT stocks analyzed above: 1) CHMI.
So, as of 3/18/2022 I/we now have 0 mREITs rated as a STRONG BUY, 6 rated as a BUY, 7 rated as a HOLD, 6 rated as a SELL, and 1 rated as a STRONG SELL. Simply put, a notable difference (much more bearish) in value/outlook when compared to late March-April 2020. However, a bit more bullish when compared to the summer of 2021 with the recent notable sell-off in a majority of names. There are currently a handful of attractively-valued stocks in the mREIT sector (just not nearly as attractive as the spring of 2020). As such, generally speaking, a bit of caution should be the main takeaway when it comes to this sector regarding current valuations. Still, valuations have started becoming a bit more attractive as a whole; just not with NLY yet.
PART 2 of this article will cover dividend metrics and projections for the second quarter of 2022.
Readers looking for my/our dividend projections for the first quarter of 2021 can look in the following article:
REIT Forum Version:
Public Version:
Current Sector/Recent NLY/AGNC Stock Disclosures:
On 3/18/2020, I initiated a position in NLY at a weighted average purchase price of $5.05 per share (large purchase). This weighted average per share price excluded all dividends received/reinvested. On 6/9/2021, I sold my entire NLY position at a weighted average sales price of $9.574 per share as my price target, at the time, of $9.55 per share was surpassed. This calculates to a weighted average realized gain and total return of 89.6% and 112.0%, respectively. I held this position for approximately 15 months.
On 3/18/2020, I once again initiated a position in AGNC at a weighted average purchase price of $7.115 per share (large purchase). This weighted average per share price excludes all dividends received/reinvested. On 6/2/2021, I sold my entire AGNC position at a weighted average sales price of $18.692 per share as my price target, at the time, of $18.65 per share was surpassed. This calculates to a weighted average realized gain and total return of 162.7% and 188.6%, respectively. I held this position for approximately 14.5 months.
On 1/31/2017, I initiated a position in NRZ at a weighted average purchase price of $15.10 per share. On 6/29/2017, 7/7/2017, and 12/21/2018, I increased my position in NRZ at a weighted average purchase price of $15.775, $15.18, and $14.475 per share, respectively. When combined, my NRZ position had a weighted average purchase price of $14.912 per share. This weighted average per share price excluded all dividends received/reinvested. On 2/6/2020, I sold my entire NRZ position at a weighted average sales price of $17.555 per share as my price target, at the time, of $17.50 per share was surpassed. This calculates to a weighted average realized gain and total return of 17.7% and 41.2%, respectively. I held this position, on a weighted average basis, for approximately 20 months.
On 9/22/2020, I once again initiated a position in NRZ at a weighted average purchase price of $7.645 per share. On 1/28/2021, 7/16/2021, and 8/20/2021, I increased my position in NRZ at a weighted average purchase price of $9.415, $9.525, and $9.485 per share, respectively. When combined, my NRZ position has a weighted average purchase price of $8.918 per share. This weighted average per share price excludes all dividends received/reinvested.
On 1/2/2020, I initiated a position in AAIC at a weighted average purchase price of $5.57 per share. On 1/9/2020, 3/16/2020, 9/24/2020, 5/6/2021, 9/2/2021, 9/10/2021, 11/10/2021, 11/24/2021, and 3/3/2022, I increased my position in AI at a weighted average purchase price of $5.59, $3.25, $2.53, $3.875, $3.748, $3.75, $3.752, $3.70, and $3.39 per share, respectively. When combined, my AAIC position has a weighted average purchase price of $3.456 per share. This weighted average per share price excludes all dividends received/reinvested.
On 10/19/2020, I initiated a position in PMT at a weighted average purchase price of $16.275 per share. On 10/29/2020, 8/12/2021, 8/20/2021, 11/18/2021, and 2/4/2022, I increased my position in PMT at a weighted average purchase price of $14.90, $18.693, $18.407, $18.180, and $16.024 per common share, respectively. When combined, my PMT position has a weighted average purchase price of $16.349 per share. This weighted average per share price excludes all dividends received/reinvested.
On 12/1/2020, I initiated a position in DX at a weighted average purchase price of $16.59 per share. On 12/20/2021, I increased my position in DX at a weighted average purchase price of $15.35 per share. When combined, my DX position has a weighted average purchase price of $15.66 per share. This weighted average per share price excludes all dividends received/reinvested.
On 10/12/2018, I initiated a position in GPMT at a weighted average purchase price of $18.155 per share. On 5/12/2020, 5/27/2020, 5/28/2020, 8/26/2020, 9/10/2020, and 9/11/2020, I increased my position in GPMT at a weighted average purchase price of $4.745, $5.144, $5.086, $6.70, $6.19, and $6.045 per share, respectively. My last two purchases made up approximately 50% of my total position (to put things in better perspective). When combined, my GPMT position had a weighted average purchase price of $6.234 per share. This weighted average per share price excluded all dividends received/reinvested. On 6/8/2021, I sold my entire GPMT position at a weighted average sales price of $15.783 per share as my price target, at the time, of $15.75 per share was surpassed. This calculates to a weighted average realized gain and total return of 153.2% and 168.7%, respectively. I held this position, on a weighted average basis, for approximately 11 months.
On 12/10/2021, I once again initiated a position in GPMT at a weighted average purchase price of $11.817 per share. On 12/15/2021, I increased my position in GPMT at a weighted average purchase price of $11.318 per share. When combined, my GPMT position has a weighted average purchase price of $11.484 per share. This weighted average per share price excludes all dividends received/reinvested.
On 1/24/2022, I initiated a position in RC at a weighted average purchase price of $13.39 per share. This weighted average per share price excludes all dividends received/reinvested.
Final Note: All trades/investments I have performed over the past several years have been disclosed to readers in "real time" (that day at the latest) via either the StockTalks feature of Seeking Alpha or, more recently, the "live chat" feature of the Marketplace Service the REIT Forum (which cannot be changed/altered). Through these resources, readers can look up all my prior disclosures (buys/sells) regarding all companies I cover here at Seeking Alpha (see my profile page for a list of all stocks covered). Through StockTalk disclosures and/or the live chat feature of the REIT Forum, at the end of February 2022 I had an unrealized/realized gain "success rate" of 86.7% and a total return (includes dividends received) success rate of 91.7% out of 60 total past and present mREIT and business development company ("BDC") positions (updated monthly; multiple purchases/sales in one stock count as one overall position until fully closed out). I encourage other Seeking Alpha contributors to provide real time buy and sell updates for their readers/subscribers which would ultimately lead to greater transparency/credibility. Starting in January 2020, I have transitioned all my real-time purchase and sale disclosures solely to members of the REIT Forum. All applicable public articles will still have my "main ticker" purchase and sale disclosures (just not in real time). Please disregard any minor "cosmetic" typos if/when applicable.
Table 4a - AGNC + NLY Seeking Alpha Recommendations (July 2020 - November 2021 Timeframe)
Seeking Alpha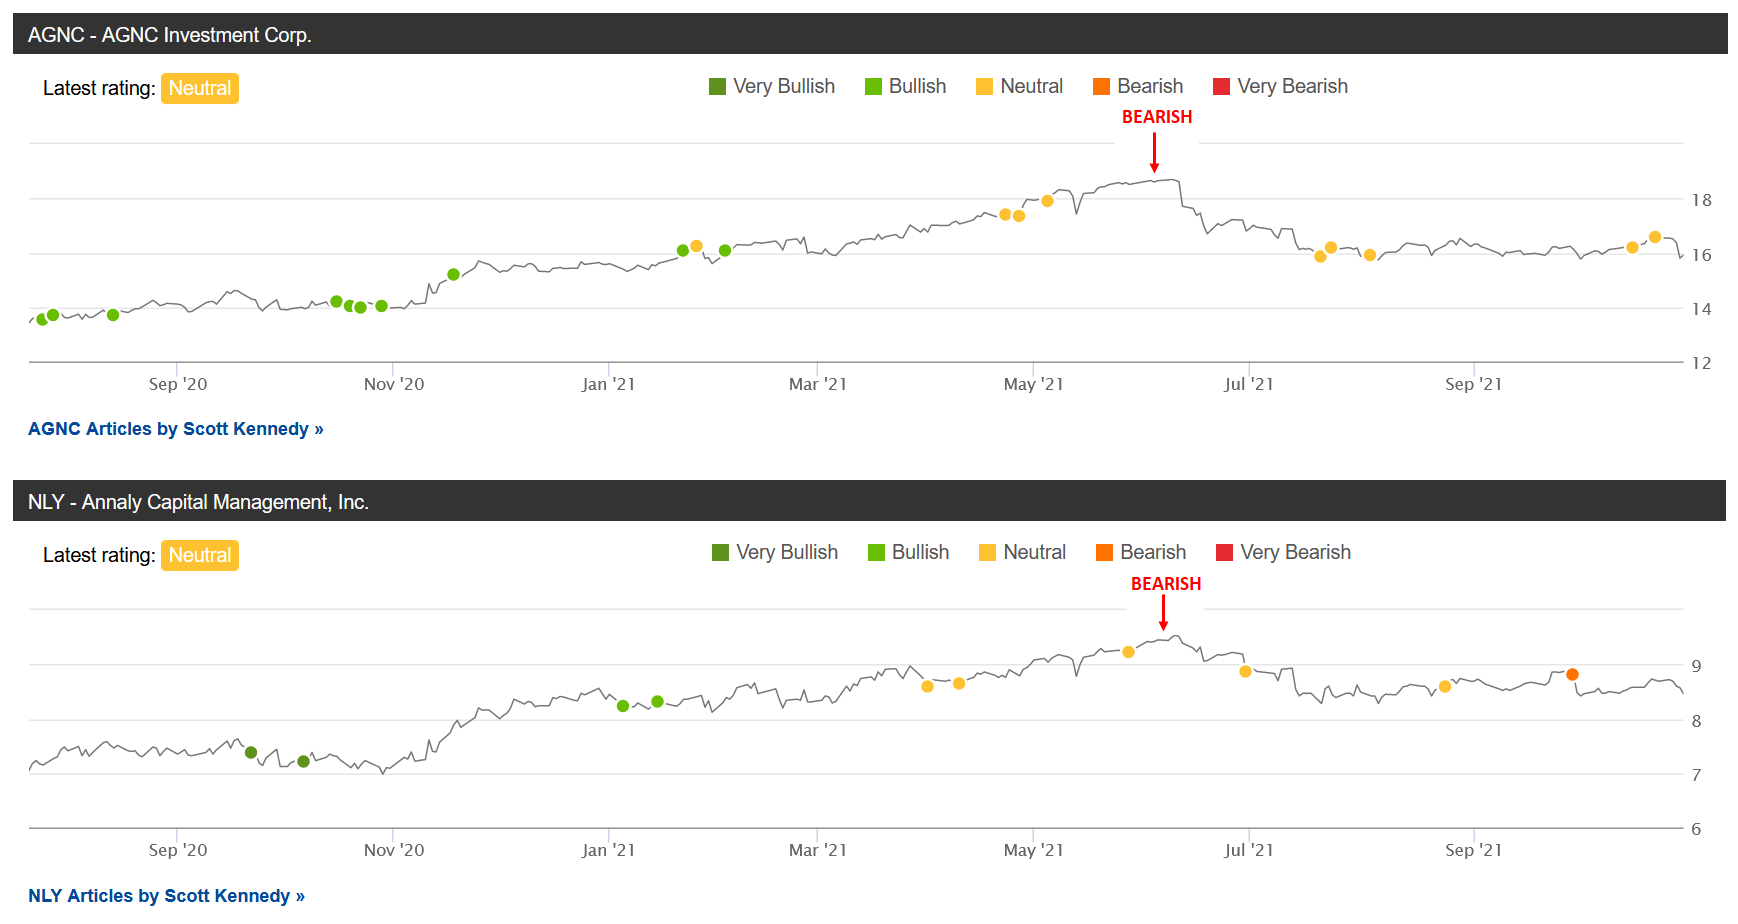
Table 4b - AGNC + NLY Seeking Alpha Recommendations (March 2021 - March 2022 Timeframe)
Seeking Alpha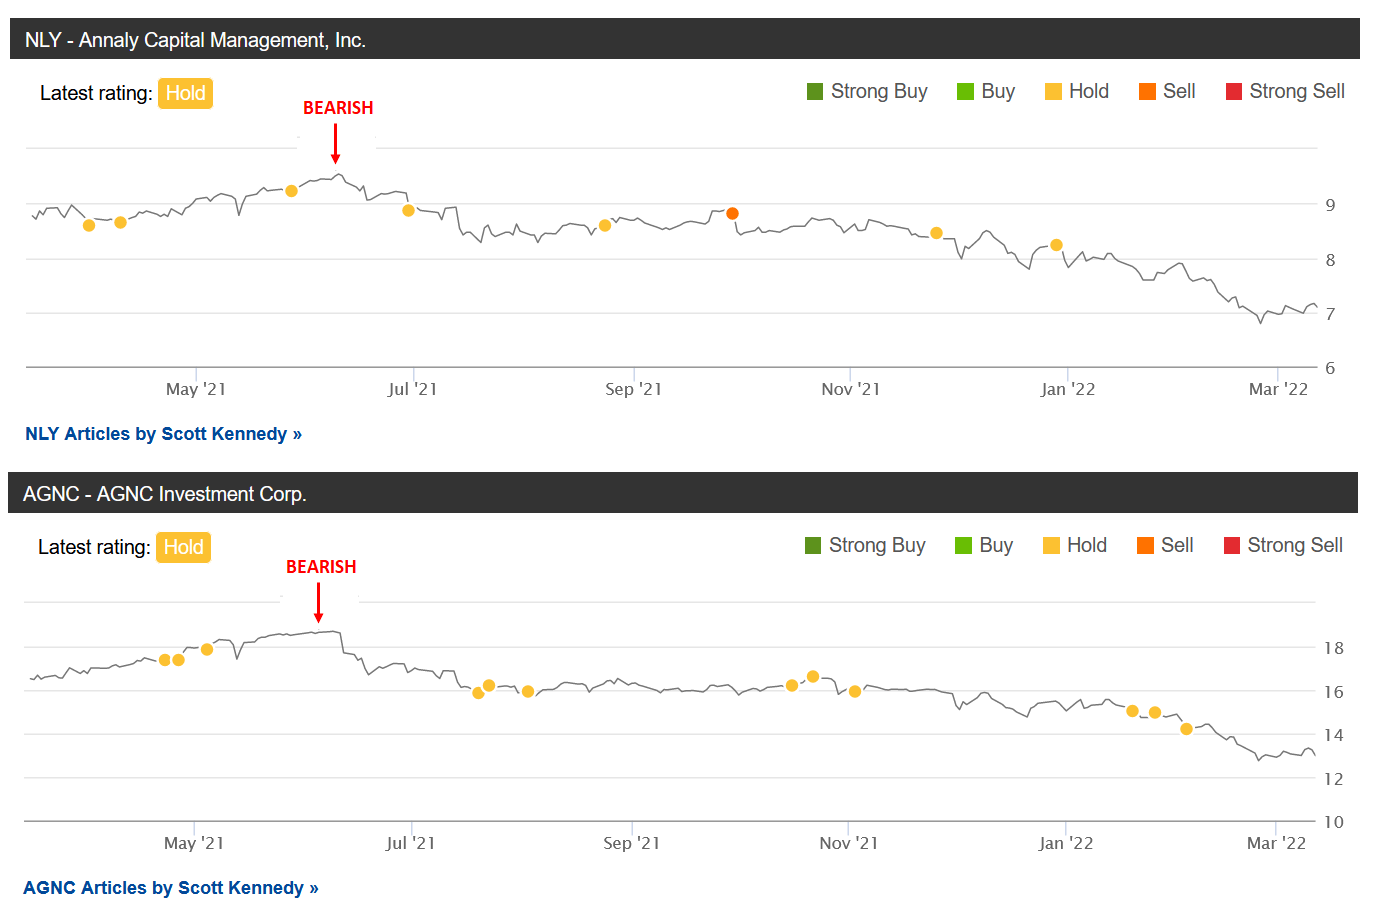
(Source: Tables sourced from Seeking Alpha [some overlap of time periods between the 2 images]; "Bearish" indicator included by me directly from the REIT Forum's weekly subscriber recommendation article series; week of 6/4/2021 for AGNC and week of 6/11/2021 for NLY)
Lastly, I just want to quickly highlight my/our AGNC and NLY Seeking Alpha recommendation ranges over the past 1.5 years or so. In my personal opinion, a stock with a BUY recommendation should increase in price over time, a SELL recommendation should decrease in price over time, and a HOLD recommendation should remain relatively unchanged in price over time (pretty logical). Simply put, my/our "valuation methodology" has correctly timed when both AGNC and NLY have been undervalued (a BUY recommendation; bullish), overvalued (a SELL recommendation; bearish), and appropriately valued (a HOLD recommendation; neutral).
Using Tables 4a and 4b above as a reference, I believe I/we have done a pretty good job in my/our AGNC and NLY recommendation ratings. Not only do I/we want to provide guidance that enhances total returns for subscribers, I/we also want to protect these generated returns by directly minimizing total losses. I personally believe this methodology/strategy is very important. In other words, correctly spotting both positive catalysts/trends and negative factors/trends.
The same general methodology/strategy holds true when going back to 2019 and 2020 (both pre-COVID-19 where I/we had a SELL recommendation on both AGNC and NLY and post the initial onset of COVID-19 where I/we had a STRONG BUY recommendation on both AGNC and NLY). A contributor's/team's recommendation track record should "count for something" and should always be considered when it comes to credibility/successful investing.
Each investor's BUY, SELL, or HOLD decision is based on one's risk tolerance, time horizon, and dividend income goals. My personal recommendation will not fit each reader's current investing strategy. The factual information provided within this article is intended to help assist readers when it comes to investing strategies/decisions. Please disregard any minor "cosmetic" typos if/when applicable.
Understanding My Valuation Methodology Regarding mREIT Common and BDC Stocks:
The basic "premise" around my recommendations in the mREIT common and BDC sectors is value. Regarding operational performance over the long-term, there are above average, average, and below average mREIT and BDC stocks. That said, better-performing mREIT and BDC peers can be expensive to own, as well as being cheap. Just because a well-performing stock outperforms the company's sector peers over the long-term, this does not mean this stock should be owned at any price. As with any stock, there is a price range where the valuation is cheap, a price where the valuation is expensive, and a price where the valuation is appropriate. The same holds true with all mREIT common and BDC peers. As such, regarding my investing methodology, each mREIT common and BDC peer has their own unique BUY, SELL, or HOLD recommendation range (relative to estimated CURRENT BV/NAV). The better-performing mREITs and BDCs typically have a recommendation range at a premium to BV/NAV (varying percentages based on overall outperformance) and vice versa with the average/underperforming mREITs and BDCs (typically at a discount to estimated CURRENT BV/NAV).
Each company's recommendation range is "pegged" to estimated CURRENT BV/NAV because this way subscribers/readers can track when each mREIT and BDC peer moves within the assigned recommendation ranges (daily if desired). That said, the underlying reasoning why I/we place each mREIT and BDC recommendation range at a different premium or (discount) to estimated CURRENT BV/NAV are based on roughly 15-20 catalysts which include both macroeconomic catalysts/factors and company-specific catalysts/factors (both positive and negative). This investing strategy is not for all market participants. For instance, not likely a "good fit" for extremely passive investors. For example, investors holding a position in a particular stock, no matter the price, for say a period of 5+ years. However, as shown throughout my articles written here at Seeking Alpha since 2013, in the vast majority of instances I have been able to enhance my personal total returns and/or minimize my personal total losses from specifically implementing this particular investing valuation methodology. I hope this provides some added clarity/understanding for new subscribers/readers regarding my valuation methodology utilized in the mREIT common and BDC sectors. Please disregard any minor "cosmetic" typos if/when applicable.
I am currently "teaming up" with Colorado Wealth Management to provide intra-quarter CURRENT BV and NAV per share projections on all 20 mREIT and 16 BDC stocks I currently cover. These very informative (and “premium”) projections are provided through Colorado's S.A. Marketplace service. In addition, this includes additional data/analytics, weekly sector recommendations (including ranges), and exclusive "rapid fire" mREIT and BDC chat notes/articles after earnings. For a full list of benefits I provide to the REIT Forum subscribers, please see my profile page.