onurdongel/E+ via Getty Images
The Buy Thesis
First Industrial (NYSE:FR) is my top pick among the Tier 1 location industrial REITs. Its valuation and level-headed management make it a superior investment to peers. As land scarcity sets in for high population density areas, FR's land bank will allow it to profitably develop where others cannot. The combination of its locations and price point position it well for continued growth.
The Amazon Announcement - A Blessing in Disguise
As we have previously discussed, Amazon has decided to pull back a bit on its logistics infrastructure investment and is even subleasing some of its warehouses. This seems to have been interpreted as the end of the logistics bull market and a primary cause of the sector falling nearly 25% year to date.
S&P Global Market Intelligence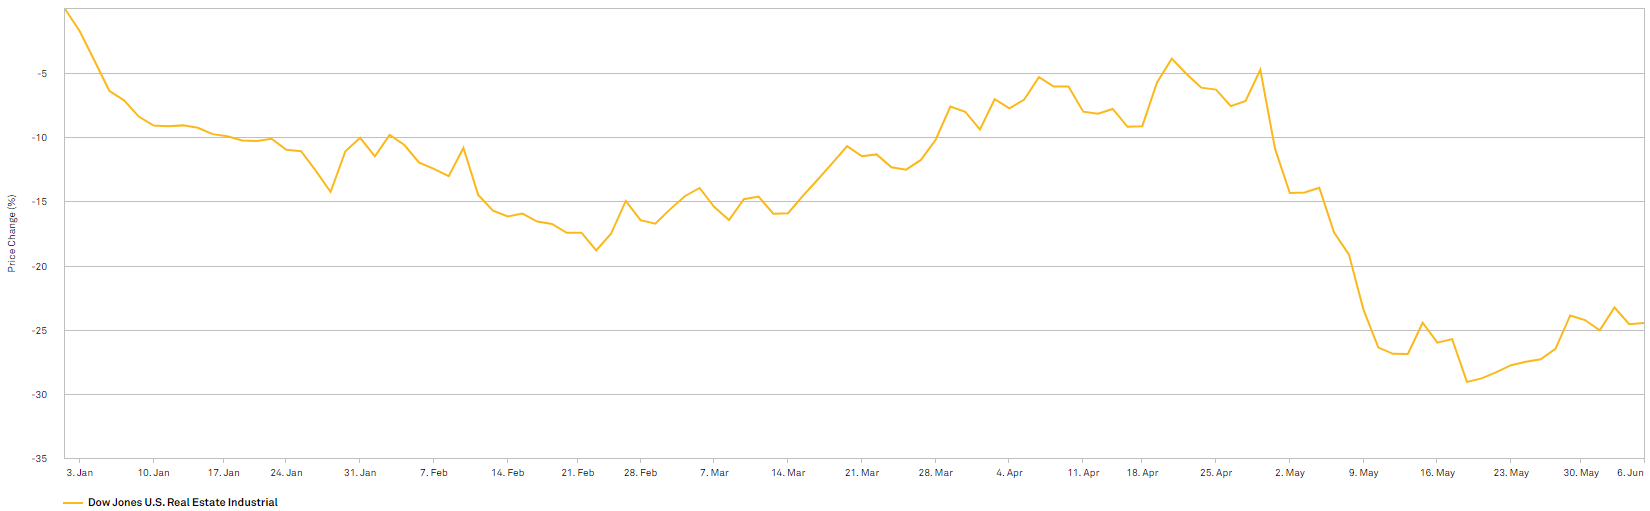
This had 2 effects:
1) It brought valuations down substantially with forward P/FFO in the sector now in the 20s rather than the 30s.
S&P Global Market Intelligence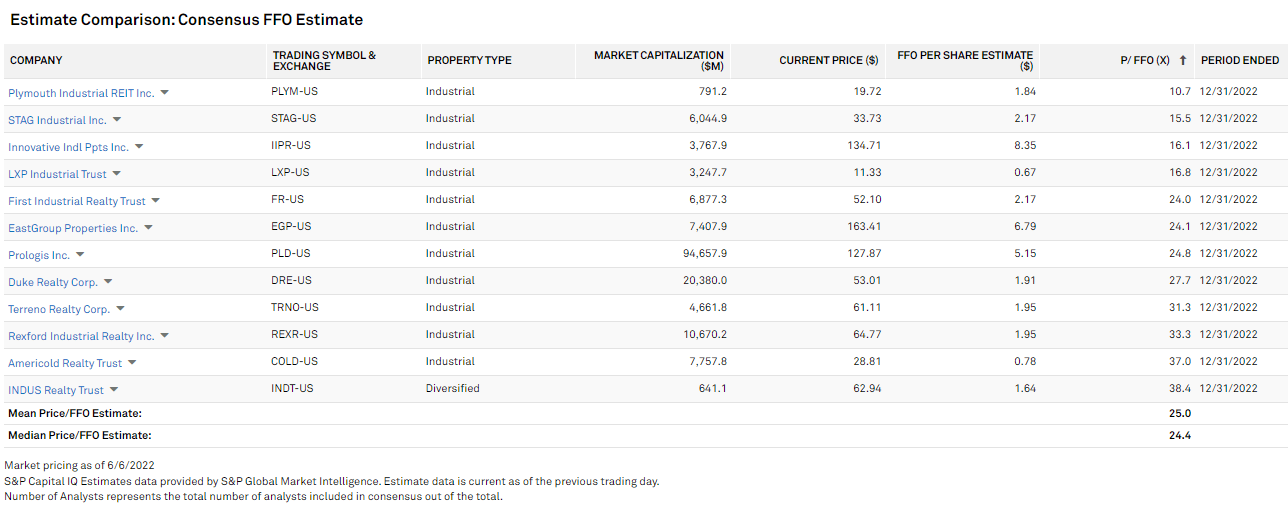
2) It put some fear in developers, going a long way toward curbing aggressive speculative builds.
As an investor, both of these increase the forward returns. The lower valuation directly raises forward expected returns, and the reduced development volume extends the duration in which the industrial REITs can continue to pump rent.
Whether this is a net positive or net negative depends on whether the Amazon announcement is Amazon-specific or more systemic.
At REITweek, Peter Baccile (CEO of FR) had some interesting commentary on the matter.
"In 2020 Amazon took 80 million square feet [ ]. in 2021 they took another 80 million square feet"'
He went on to say:
"We have long expected them to rationalize their space"
His idea is that Amazon was intentionally buying up too much space in an effort to stomp out competitors when they were at their weakest during the pandemic.
This reasoning makes quite a bit of sense to me. Amazon's buying up of space was outsized, substantially outpacing Amazon's revenue growth. That sort of pace is clearly not sustainable, so it is unsurprising to see them pulling back a bit.
It also leads me to believe that it is an Amazon-specific problem. Demand from other tenants remains strong with occupancy rates across the industrial industry at historic highs. National vacancy is just 3% and FR's vacancy is only 2%.
In fact, lease-up of FR's developments is coming in significantly faster than underwriting, so it would appear as though the fundamentals are as strong as ever.
The main thing that has changed is the valuation, which provides an opportunity to get in at a great price.
Valuation
At 24X FFO, FR is trading at about the middle of the pack among industrial REITs. However, this multiple is unusually low among the group of industrial REITs with substantial exposure to tier 1 markets.
Terreno (TRNO) trades at 31.3X and Rexford (REXR) trades at 33.3X.
24X is also an unusually low multiple for a company with a growth trajectory as rapid as that of FR.
Shown below is the consensus estimated FFO/share and AFFO/share for FR going out to 2027.
S&P Global Market Intelligence
If the consensus estimates are even close to correct, FR is undervalued.
5 years out is a long way to estimate, so there is clearly a large margin for error here, but I do think this level of growth is quite plausible given where FR is positioned today.
Let me take a step back for a second to discuss the continuum of logistics warehouses and where FR fits on it.
The Warehouse Continuum
Every industrial REIT likes to discuss why their style of warehouses is the best. They are able to do this because any given type of warehouse really can be the best positioned depending on where we are in the cycle and what sort of demand drivers there are.
It is essentially a series of tradeoffs in which tenants must pick between location convenience and cost. I have created the below illustration to summarize the tradeoffs.
Author generated
Class A warehouses in the Inland Empire are unequivocally better than infill warehouses on an absolute basis. If a tenant were offered either at the same price point, they will pick the Inland Empire every time.
However, the actual decision facing the tenant is far more interesting because it is a choice between the Inland Empire at $22 per foot or Tier 1 city infill at $8 per foot or even Tier 2 city infill at $3.50 per foot.
Now that is a tough choice and what the tenant demands is in constant flux depending on relative price points and relative convenience for reaching as many of their end customers as possible.
This also makes it mixed as to which caliber of asset performs better in certain scenarios. When times get tough, perhaps companies tighten their purse strings and downgrade to the cheaper warehouse. On the flip side, lower population density warehouses are more susceptible to supply growth because there is an abundance of land on which to build competing supply, whereas in the truly land-locked areas, supply is largely capped by land scarcity.
One caveat on this is multi-story. If demand gets sufficiently large and land shortage becomes sufficiently severe, supply can still be increased by building multi-story warehouses. I think we are a long way off from this in the U.S. because, compared to just about any other developed nation, the U.S. has a massive amount of land per capita.
Living in Wisconsin, areas like LA and NYC seem to me like they have extreme population density, but if one compares them to the rest of the world, it really is just medium density. China is about the same size as the U.S. yet it has more than 4X as many people.
As such, I don't think multi-story will gain significant scale in the U.S. for a long time which means the big city locations are largely supply capped by land scarcity.
Given this series of tradeoffs, I don't see a clear winner or loser between Tier 1 and Tier 2 locations. As such, I trade the industrial REITs on relative value which is why I own STAG. I mildly prefer to own Tier 1 locations, but when the FFO multiple gap is so large that Tier 2 is just about half price, I think it is a much better deal to go cheap.
FR is uniquely positioned within this continuum because they have a sizable land bank which gives them the opportunity to build in Tier 1 cities but at a much lower cost. Land cost for development in premier locations is roughly 50% of total development cost. Since FR already owns the land, they functionally get to develop at double the normal cap rate.
Developing at a 5% cap rate, in my opinion, has a net present value NPV of $0, so it's fine for companies already involved in it or that have a slight edge through cost of capital advantage but nothing that I am willing to pay a high multiple for as an investor.
Developing at a 10% cap rate, however, is special. FR's land bank allows them to create an enormous amount of value just by cashing in on an asset they already have. The beauty of it is that the land is not cash flowing today, so the value of it is not even showing up in their 24X FFO multiple.
FR's land bank is quite sizable and affords FR over $2B in fresh development. I believe it will move the needle quite substantially over the next few years.
NAV Valuation
Industrial property values have shot up over recent years due to a combination of significantly higher NOI generation and cap rate compression. FR's land bank has appreciated even more, approximately doubling in value since purchase.
When the asset value accretion is combined with the recent market price drop, FR is now trading at a huge discount to NAV.
S&P Global Market Intelligence
The 80% of NAV price tag is quite unusual for a premium location industrial REIT as historically this category has traded above NAV.
The only other recent time FR could be bought at such a discount was in the depths of the COVID crash when the future was murky and pessimism reigned.
S&P Global Market Intelligence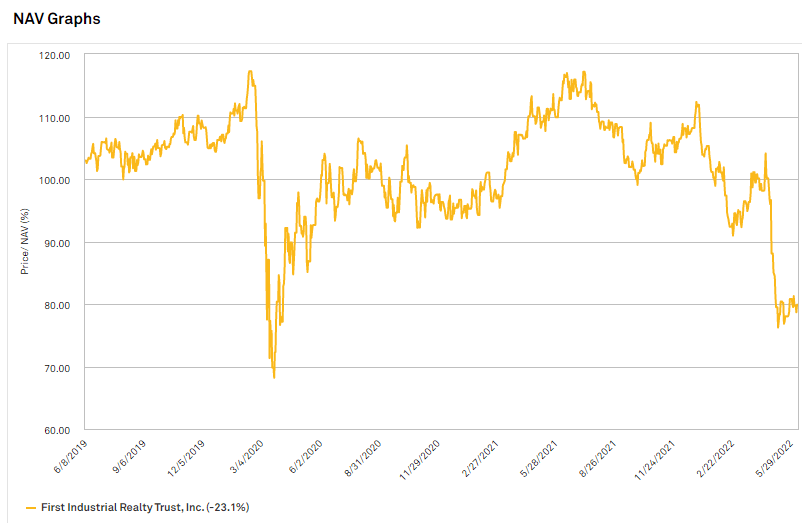
The fact that the current discount is as big as that of a black swan event strikes me as a great buying opportunity.
This whole Amazon pulling back on warehouses thing has been blown entirely out of proportion.
At REITweek, I have focused much of my time on attending the industrial REIT meetings to get a sense for where the sector is headed. Unanimously, they are reporting strong leasing demand from the Tier 2 market REITs like Plymouth (PLYM) to the premier location REITs like FR.
I was never a fan of paying 30X for industrial because eventually the 30%+ positive lease rolls will come to a close, but this price dip has made the whole sector look quite attractive.
I think FR offers the highest forward total return potential of the Tier 1s while STAG and PLYM look the most attractive of the Tier 2s.
Make your money work for you
At Portfolio Income Solutions we do the rigorous analysis to determine which stocks will work and which won’t. We then curate a portfolio of the most opportunistic individual stocks and provide members with continuous analysis to help keep their investments in shape. We constantly watch the market in order to buy and sell the right stocks at the right times.
Start investing with the aid of dedicated research by joining Portfolio Income Solutions.
Not sure yet? Grab a free trial. Canceling is easy and there are no obligations.