Marko Geber/DigitalVision via Getty Images
Plymouth Industrial (NYSE:PLYM) has consistently traded at a substantial discount to peers as there were impediments to ownership that made it either risky or difficult to understand. Today, however, PLYM is looking eerily similar to the standard industrial REIT and yet it still trades at about half the earnings multiple, which I believe makes it opportunistic.
Reason for update
I wrote about PLYM quite recently in mid-May so I wouldn’t normally do a follow-on article this soon, but there have been 2 major changes that I think warrant an update:
- Properties have materially outperformed expectations
- The Preferred B has been eliminated, but at a more expensive cost of equity due to low share price.
I had previously calculated a clean (post preferred dilution) AFFO runrate of $1.57. Today it looks more like $1.60 with the dilutive aspects of the low priced equity issued being more than offset by property level NOI outperformance.
Calculation of runrate FFO and AFFO
In closing out the second half of the Preferred B, 2.61 million shares will be issued for second half - 1.915 million directly to Madison and another 702K to private investor at $21.35/share for the remaining $15 million.
This results in a post-conversion share count of 43.23 million shares.
PLYM’s 2Q22 core FFO of $18.6 million would be $375K higher without the cash expense of the preferred B resulting in an annual core FFO runrate of $75.9 million. I like to net out maintenance costs such as TI and LC (tenant improvement and leasing commissions) because these are recurring costs.
Annual maintenance capex of $6.91 million takes PLYM to $68.99 million annual AFFO. The net result is an AFFO runrate of $1.60 per share and FFO runrate of $1.76 per share.
The numbers are summarized in the table below.
Author generated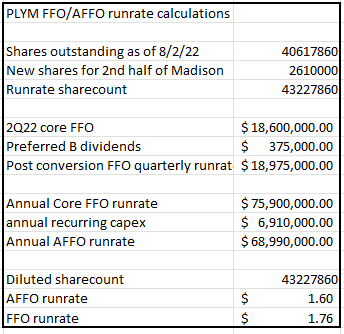
Calculations by author using data from company filings
In the press release detailing the 2nd half of the preferred B conversion, PLYM states that despite the dilution of the offering they still think they will hit their previous 2022 guidance of $1.80-$1.85 core FFO.
How does this work if the core FFO runrate is now $1.76?
Well, in the first half of the year, PLYM significantly outperformed guidance with $0.47 Core FFO in each of Q1 and Q2. This $0.94 in the first half means they only need $0.86 or $0.91 in the second half to hit the low end and high end of guidance, respectively.
Half of the $1.76 annual runrate is $0.88, placing Plymouth nicely in the middle of guidance.
I do think this puts the stock at a slight bit of risk when 2023 guidance is issued because I don’t think the market realizes that runrate is only $1.76 of FFO and $1.60 AFFO, given that guidance is $1.80-$1.85 and PLYM is likely to successfully hit that guidance.
Differentiated property type
PLYM’s portfolio has a different focus than that of peers and I think the market is mistakenly viewing it as worse by way of double accounting.
Let me dig into what I mean by double accounting here.
Consider a class A industrial warehouse in a prime location and a class B warehouse in a secondary location.
If you could have one or the other, it would of course be wise to choose the class A.
It is a tougher question when looking at equal net operating income. For equal NOI, you would need just over 3 class B warehouses of equal square footage. At equal NOI it becomes a question of future NOI growth rates and this is less clear which is better.
The private market still leans toward class A with cap rates on the types of assets PLYM is buying are much higher than on the in-demand class A. PLYM is getting $7 of NOI for every $4 of NOI they would have gotten if they invested in class A.
So really PLYM’s acquisition strategy is not relying on a class B warehouse outperforming class A, it is relying on 5.5 class B warehousing outearning a single class A asset.
The market goes a step further and this is where the double accounting comes in. The market thinks class A is better so they are trading PLYM at a significant discount to its NAV.
Well, the private market’s preference for class A is already reflected in PLYM’s NAV so by putting in another layer of preference for class A, the market is double accounting the discount.
Since PLYM is trading at 75% of NAV, in buying PLYM at this price you are not getting 5.5 class B warehouses per 1 class A, you are getting 7.3 class B warehouses (5.5/0.75 = 7.3).
It is just such an astronomical difference in going-in NOI yield that class A would not just have to outgrow the class B but outgrow it by substantially more than the private market thinks it will.
Valuation matters at a stock level and it matters at a property level. With PLYM you are getting discounted valuation at both levels. PLYM is buying at somewhere around $40 to $60 per square foot with replacement cost closer to $70+ per square foot.
These class B properties are less exposed to new supply as nearly all supply being built today is class A. The price point at which PLYM’s properties are rented does not compete with these massive 500K+ square foot warehouses with 30 foot clear heights. It is a different tenant base and based on recent leasing results in which rents are rolling up 20%+ it seems there is demand for the class B smaller footprint product.
I also like the location of PLYM’s portfolio.
S&P Global Market Intelligence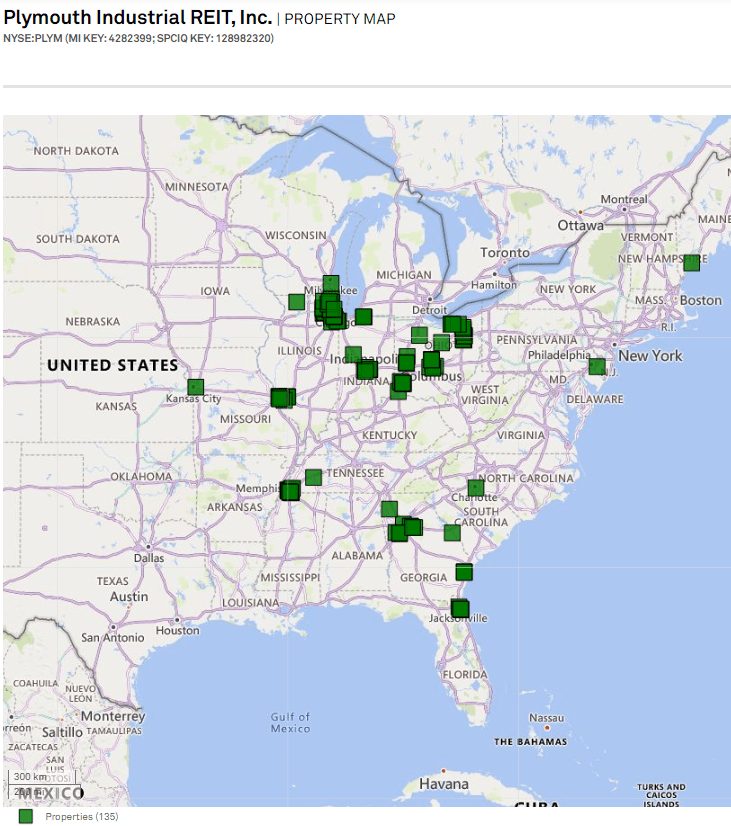
The rust belt isn’t as glamorous as the coastal cities, but with the on-shoring of manufacturing it is growing quite nicely. Cincinnati was the top market for apartment rent growth in July and industrial rents tend to correlate with multifamily rents. Both are driven by job and population growth.
Valuation
As per my calculations, PLYM is trading at 11.8X runrate FFO and 13X runrate AFFO. The numbers in the tables below will be slightly different because those are using consensus FFO and AFFO. It is the cheapest industrial REIT on FFO.
S&P Global Market Intelligence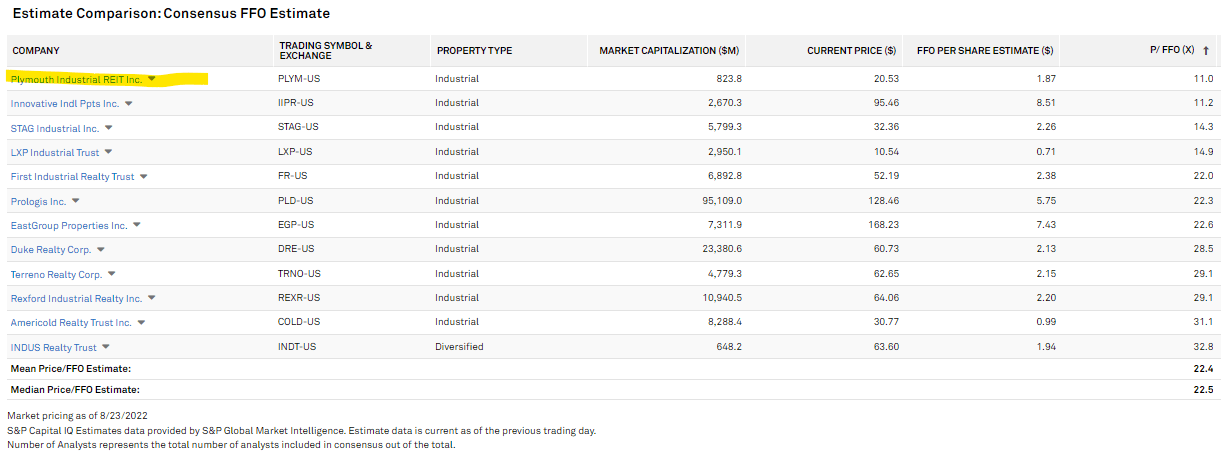
And close to the cheapest on AFFO.
S&P Global Market Intelligence
At 13X, it is half the multiple of the median industrial REIT.
That is quite the discount for a company with strong organic growth. Historically, much of the discount was related to a series of risks and impediments to investor pool.
Recent events have removed most of these impediments.
Simplification of the Plymouth story could cause multiple expansion
Over the past few years, PLYM has matured as a public company.
- Achieved sufficient scale
- Reduced leverage
- Cleared up preferred overhang
With the preferred B fully converted to common, it removes that curtain of opacity that made it so difficult to anticipate future earnings per share.
It makes the deep discount at which PLYM is trading feel more real and over time, I think the multiple will expand closer to that of peers.
Due to its class B focus and somewhat high leverage I don’t think PLYM will trade in-line with peers any time soon, but I do think 70% of peer multiple is appropriate as opposed to the current 50%.
70% of peer multiple would be 18X AFFO, which implies a price approaching $29 per share.
Risks
I see both a market price risk and a fundamental risk on the horizon.
Market price risk: Most investors probably think the runrate of FFO is $1.80-$1.85 (based on 2022 guidance) while actual runrate due to conversion of Preferred B is closer to $1.76 FFO and $1.60 AFFO. Thus 2023 guidance might be disappointing and make it seem like there is much less growth than there really is.
Fundamental risk: St. Louis is a rough market and PLYM has significant exposure at 10% of annual base rent. It was one of just a couple markets in the U.S. to have negative rent growth in recent months.
At current valuation I think these risks are more than priced in, but I am keeping an eye on how it plays out.
Opportunistic Market Sale: 20% off for a limited time!
Right now there are abnormally great investment opportunities. With the market crash, some fundamentally strong stocks have gotten outrageously cheap and I want to show you how to take advantage and slingshot out of the dip.
To encourage readers to get in at this time of enhanced opportunity we are offering a limited time 20% discount to Portfolio Income Solutions. Our portfolio is freshly updated and chock full of babies that were thrown out with the market bathwater.
Grab your free trial today while these stocks are still cheap!