Bet_Noire
Introduction
The last few years have been quite painful for the shareholders of U.S. Silica (NYSE:SLCA), who have endured years of not only a volatile share price but also no shareholder returns, as their dividends remain suspended. Whilst the strong economic recovery during 2021 and subsequent triple-digit oil prices during 2022 would have raised hopes for an end in sight, disappointingly, they are still not out of the woods, proverbially speaking.
Executive Summary & Ratings
Since many readers are likely short on time, the table below provides a very brief executive summary and ratings for the primary criteria that were assessed. This Google Document provides a list of all my equivalent ratings as well as more information regarding my rating system. The following section provides a detailed analysis for those readers who are wishing to dig deeper into their situation.
Author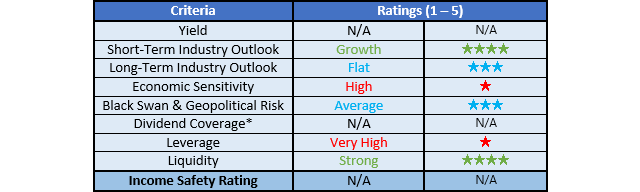
*Instead of simply assessing dividend coverage through earnings per share cash flow, I prefer to utilize free cash flow since it provides the toughest criteria and also best captures the true impact upon their financial position.
Detailed Analysis
Author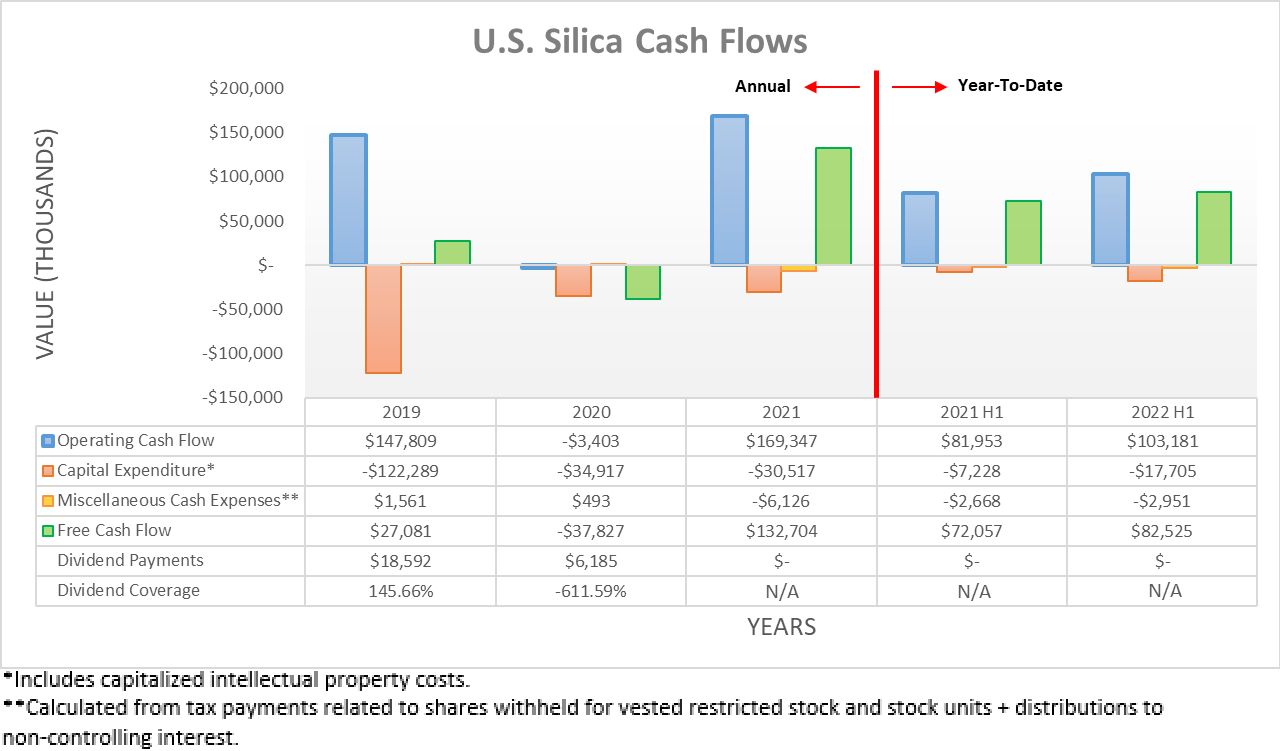
After enduring a very tough ride during the severe downturn of 2020 that demolished their operating cash flow to negative $3.4m, thankfully they saw a recovery during 2021 with their result landing at $169.3m. Despite now being back around its level from 2019 of $147.8m, it was nevertheless a shadow of its former self from earlier years with their cash flow history showing heights of $222m and $310.7m during 2017 and 2018 respectively. This obviously leaves significant scope for further improvements, which many investors were likely hoping to be forthcoming during 2022 given not only the strong economic recovery during the latter half of 2021, but also the booming oil and gas prices during 2022 driving demand for their frac sand.
Whilst these were reasonable hopes, the first half of 2022 was not nearly as strong as wanted once digging into their results, despite their surface-level operating cash flow increasing to $103.2m versus its previous result of $82m during the first half of 2021. If removing the impacts of their temporary working capital movements, their underlying results for the first half of 2022 was actually slightly lower at $99.6m and meanwhile, their previous equivalent result for the first half of 2021 was materially higher at $115.8m. In fact, when viewing this at the per-quarter level, it shows that both the first and second quarters of 2022 saw lower underlying results year-on-year versus 2021, as the graph included below displays.
Author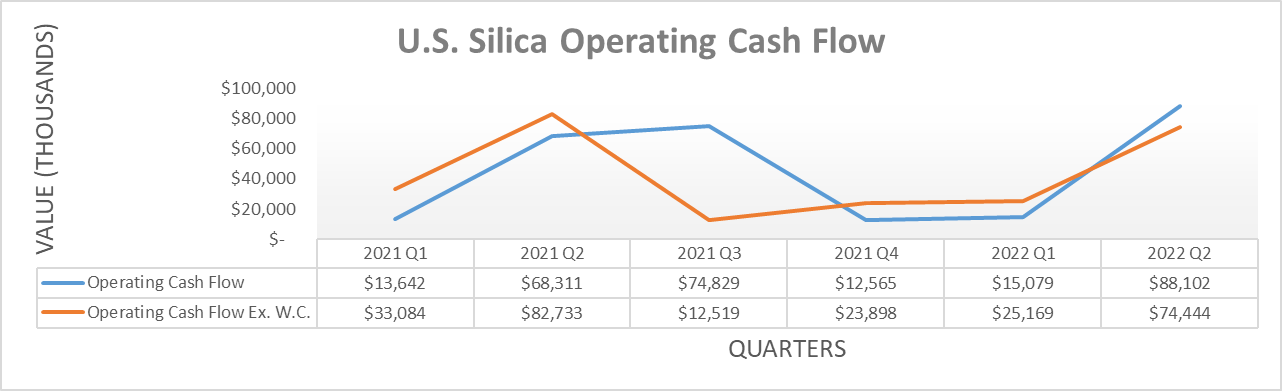
This is quite disappointing and whilst hope remains that the second half of 2022 will see a material improvement, this remains a wait-and-see situation given the risk of a recession on the horizon, not to mention the recent slowdown and recent fall in the oil rig count in the United States that could see demand for frac sand slowdown. Despite the disappointing lack of improvements versus 2021, at least the first half of 2022 still saw $82.5m of free cash flow, which annualizes to circa $160m. Even if this only ends up being around $133m, as during 2021, it still sees a very high circa 13% free cash flow yield given their current market capitalization of approximately $1b. This means that there is potential for a deep value opportunity, even without their financial performance improving, although to see this value realized by the market and thus reflected in their share price, their financial position requires addressing.
Author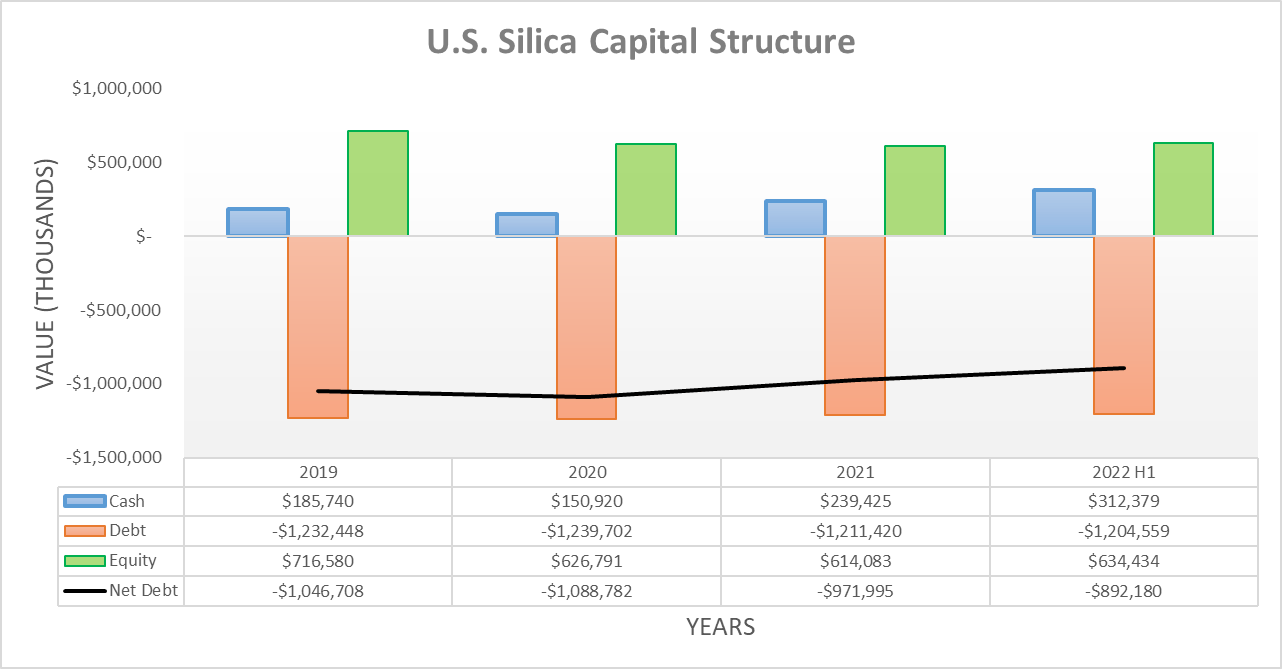
Even though their cash flow performance did not see tangible improvements thus far into 2022, at least their routine free cash flow still managed to help push their net debt lower following the first half. It now sits at $892.2m and thus makes for a decrease of 8.21% from its previous level of $972m at the end of 2021. Whilst this $79.8m decrease is a decent improvement for only half a year, even if annualized to circa $160m, it would still take around five and half years to repay the remainder of their debt. Normally, this would be considered reasonably timely but alas, it is still problematic given their debt maturities, as subsequently explained.
Author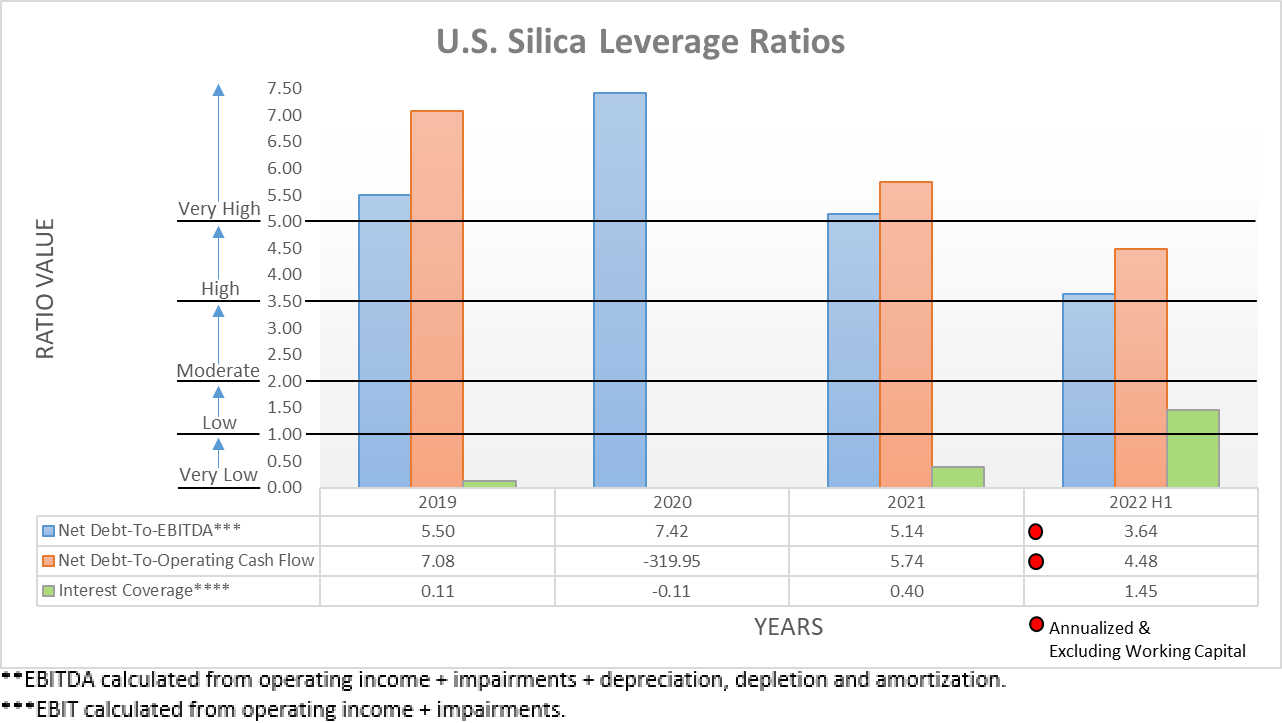
On the surface, their leverage appears to have seen a sizeable improvement following the first half of 2022 but beneath the surface, there are more variables to consider. Whilst yes, their lower net debt helps, it alone is not responsible for pushing their respective net debt-to-EBITDA and net debt-to-operating cash flow down to 3.64 and 4.48 versus their previous respective results of 5.14 and 5.74 at the end of 2021. If this were the case, their leverage would have dropped below the threshold of 5.01 for the very high territory and thus back into the safer, albeit still somewhat concerning high territory of between 3.51 and 5.00.
In reality, the first half of the year appears to enjoy a disproportionately higher weighting of their financial performance because if utilizing their results for the first half of 2021 against their current net debt, it produces a net debt-to-EBITDA and net debt-to-operating cash flow of 3.48 and 3.85 respectively. These are both lower than their present results and their full-year results for 2021, which indicates that their leverage should divert higher as 2022 ends, barring a sudden improvement to their financial performance. Since their underlying cash flow performance during the first half of 2022 is still tracking below their previous results for the first half of 2021, their leverage appears to remain very high.
Author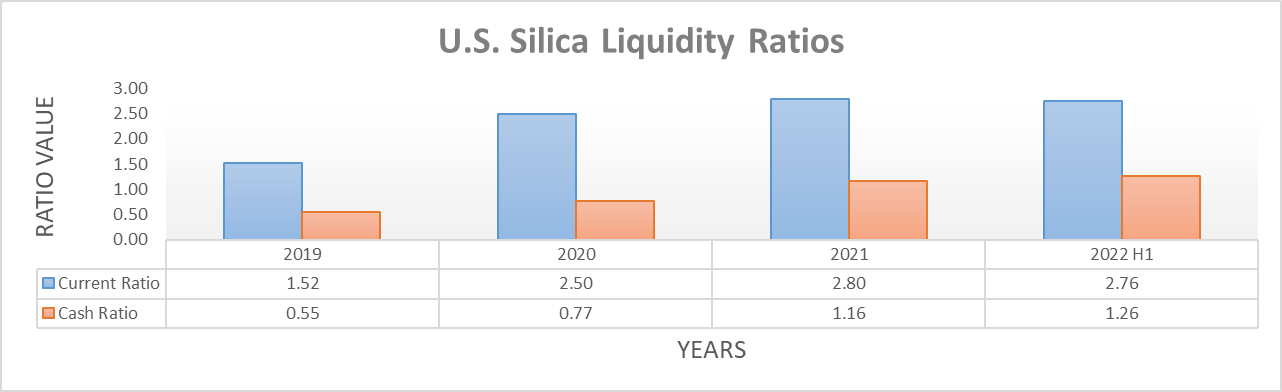
Thankfully their very high leverage is matched with strong liquidity, thereby helping ease the risks whilst they deleverage, as primarily evidenced by their current ratio of 2.76 and cash ratio of 1.26. It is particularly important they retain this sizeable cash ratio because their leverage ratio as defined under their credit facility is 5.26 and thus above its covenant limit of 3.75, which limits their credit facility availability to only $30m, as per their Q2 2022 10-Q. Even though their strong liquidity provides support in the short-term, this may change when looking ahead into the medium-term as May 2025 sees the vast majority of their debt maturing when their term loan comes due, as the table included below displays. This creates a massive and frankly speaking, scary hurdle for the company to jump as they seem incapable of repaying this debt within only three years and refinancing the entirety of their debt at once can be problematic and leaves them at the mercy of financial institutions.
U.S. Silica Q2 2022 10-Q
Conclusion
Until their term loan is addressed, shareholders are unlikely to see anything sent their way, regardless of whether their financial performance improves later in the second half of 2022. It remains too early to ascertain whether either of these variables will transpire and thus I believe that a hold rating is appropriate, especially given the possibility of a recession on the horizon.
Notes: Unless specified otherwise, all figures in this article were taken from U.S. Silica’s SEC Filings, all calculated figures were performed by the author.