Dramatic discounts to net asset value. Price to NAV range: .36 to .86.
Recent plunge created new opportunities. We just bought more in one of these picks.
The REIT Forum members get exclusive access to our real-world portfolio. See all our investments here »
Olivier Le Moal
Get ready for charts, images, and tables because they are better than words. The ratings and outlooks we highlight here come after Scott Kennedy’s weekly updates in the REIT Forum. Your continued feedback is greatly appreciated, so please leave a comment with suggestions.
We’ve seen a surge of opportunities in mortgage REITs over the last few weeks. Opportunities opened up in the common shares and the preferred shares. I want to share a few that stand out to us.
Let’s start with some of the low-risk preferred shares.
I like AGNCO (AGNCO) and AGNCP (AGNCP) here. Both offer a respectable yield today in the range of 7.8% to 8.1% and they're positioned to see a significant increase in the dividend rates when floating rates kick in. That’s 10/15/2024 for AGNCO and 4/15/2025 for AGNCP.
In my opinion, these are better deals than AGNCN (AGNCN), NLY-F (NLY.PF), or NLY-G (NLY.PG).
What do those shares have in common? AGNCN and NLY-F already are floating-rate shares. NLY-G will switch over to a floating rate starting 3/31/2023.
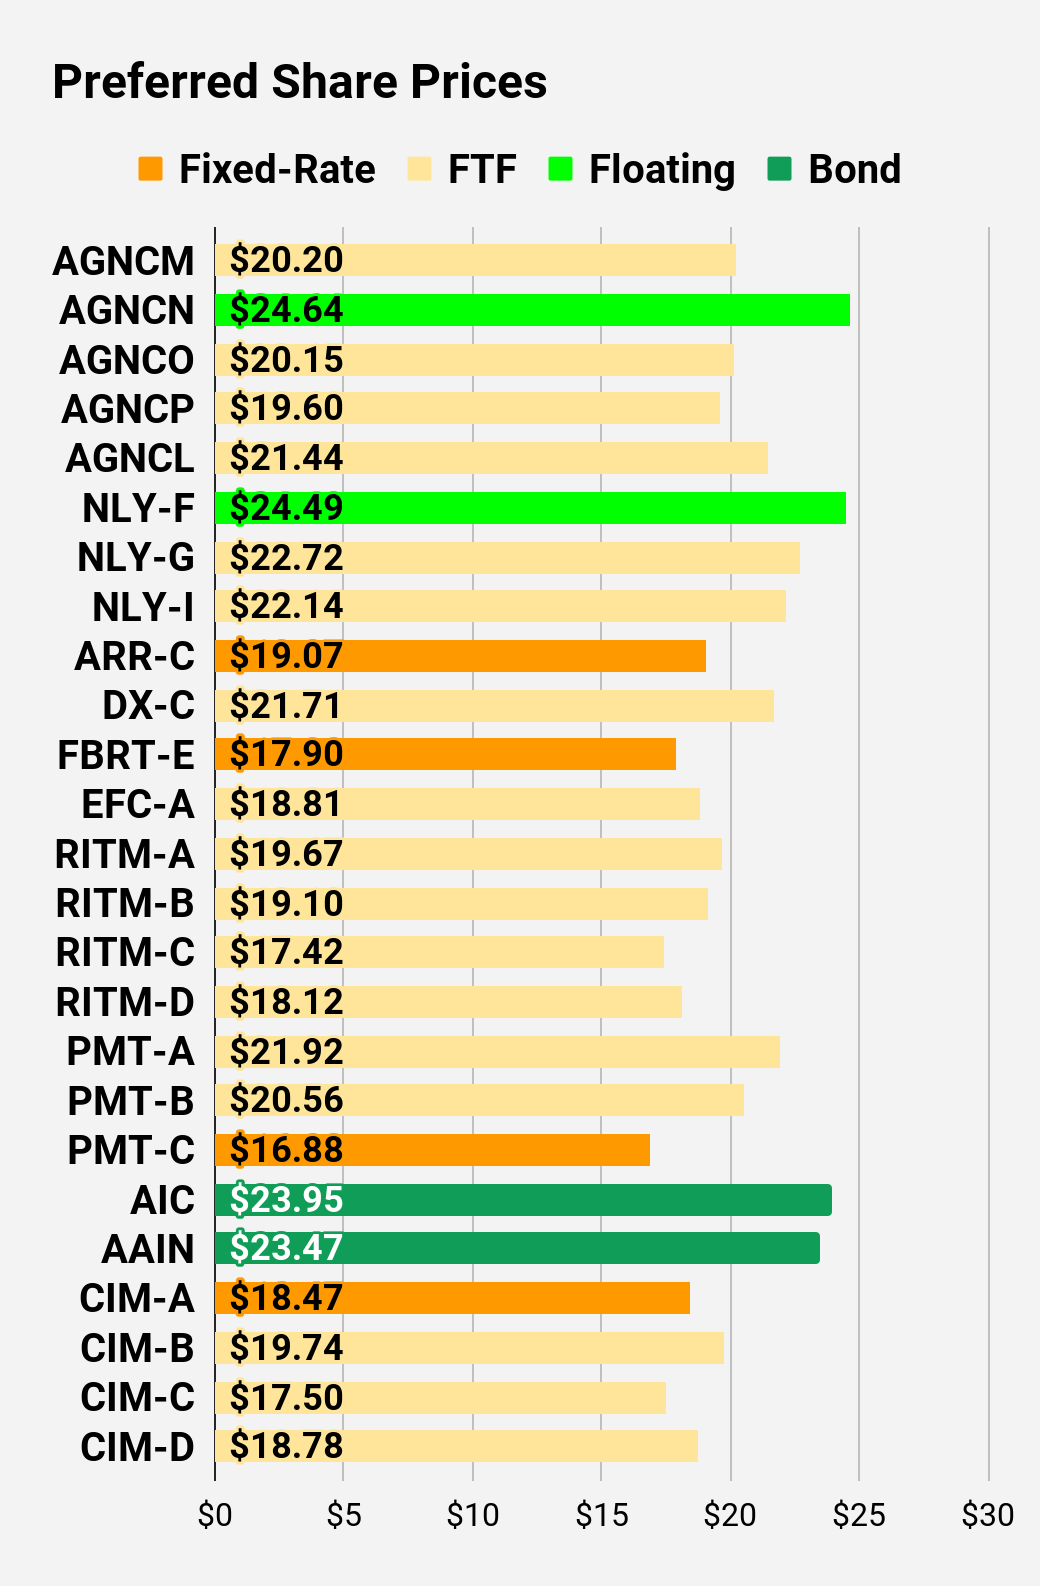
Likewise, AGNCN and NLY-F are also callable, but I don’t expect the REITs to call those shares when they could get a better deal on repurchasing their other preferred shares. It wouldn’t make sense to spend $25.00 per share to call AGNCN when they can buy AGNCO at $20.17 or AGNCP at $19.57. They don’t need to save a bit more on dividends today when they could save so much more on the purchase price.
Another Swapping Opportunity
CHMI-B (CHMI.PB) looks much better than CHMI-A (CHMI.PA).
The REIT Forum
We’re not invested in either of these shares, but the disparity is wide enough to call out.
Compared to CHMI-A, investors in CHMI-B get:
A significantly larger discount to call value.
A higher yield from day 1.
A significant increase in the dividend rate if short-term rates remain remotely close to today’s level.
That’s enough that this should be a pretty easy choice.
Moving on to common shares.
Common Shares
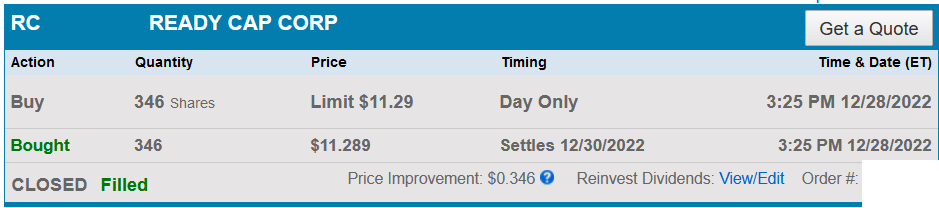
Ready Capital (RC) is a good deal. We bought more shares yesterday. We paid a slightly higher price, but we also qualified for the ex-dividend so that was nice.
Here's our trade alert for RC:
Trades Placed
Purchased 346 shares of Ready Capital (RC) for $11.289 per share.
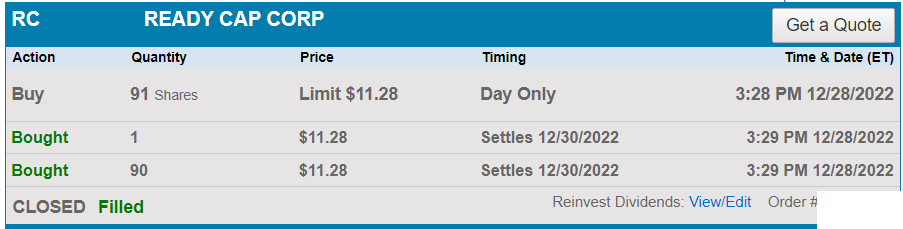
Purchased another 91 shares of RC for $11.28 per share.
Note: I would've just combined them, but they are in separate accounts due to the low cash balance.
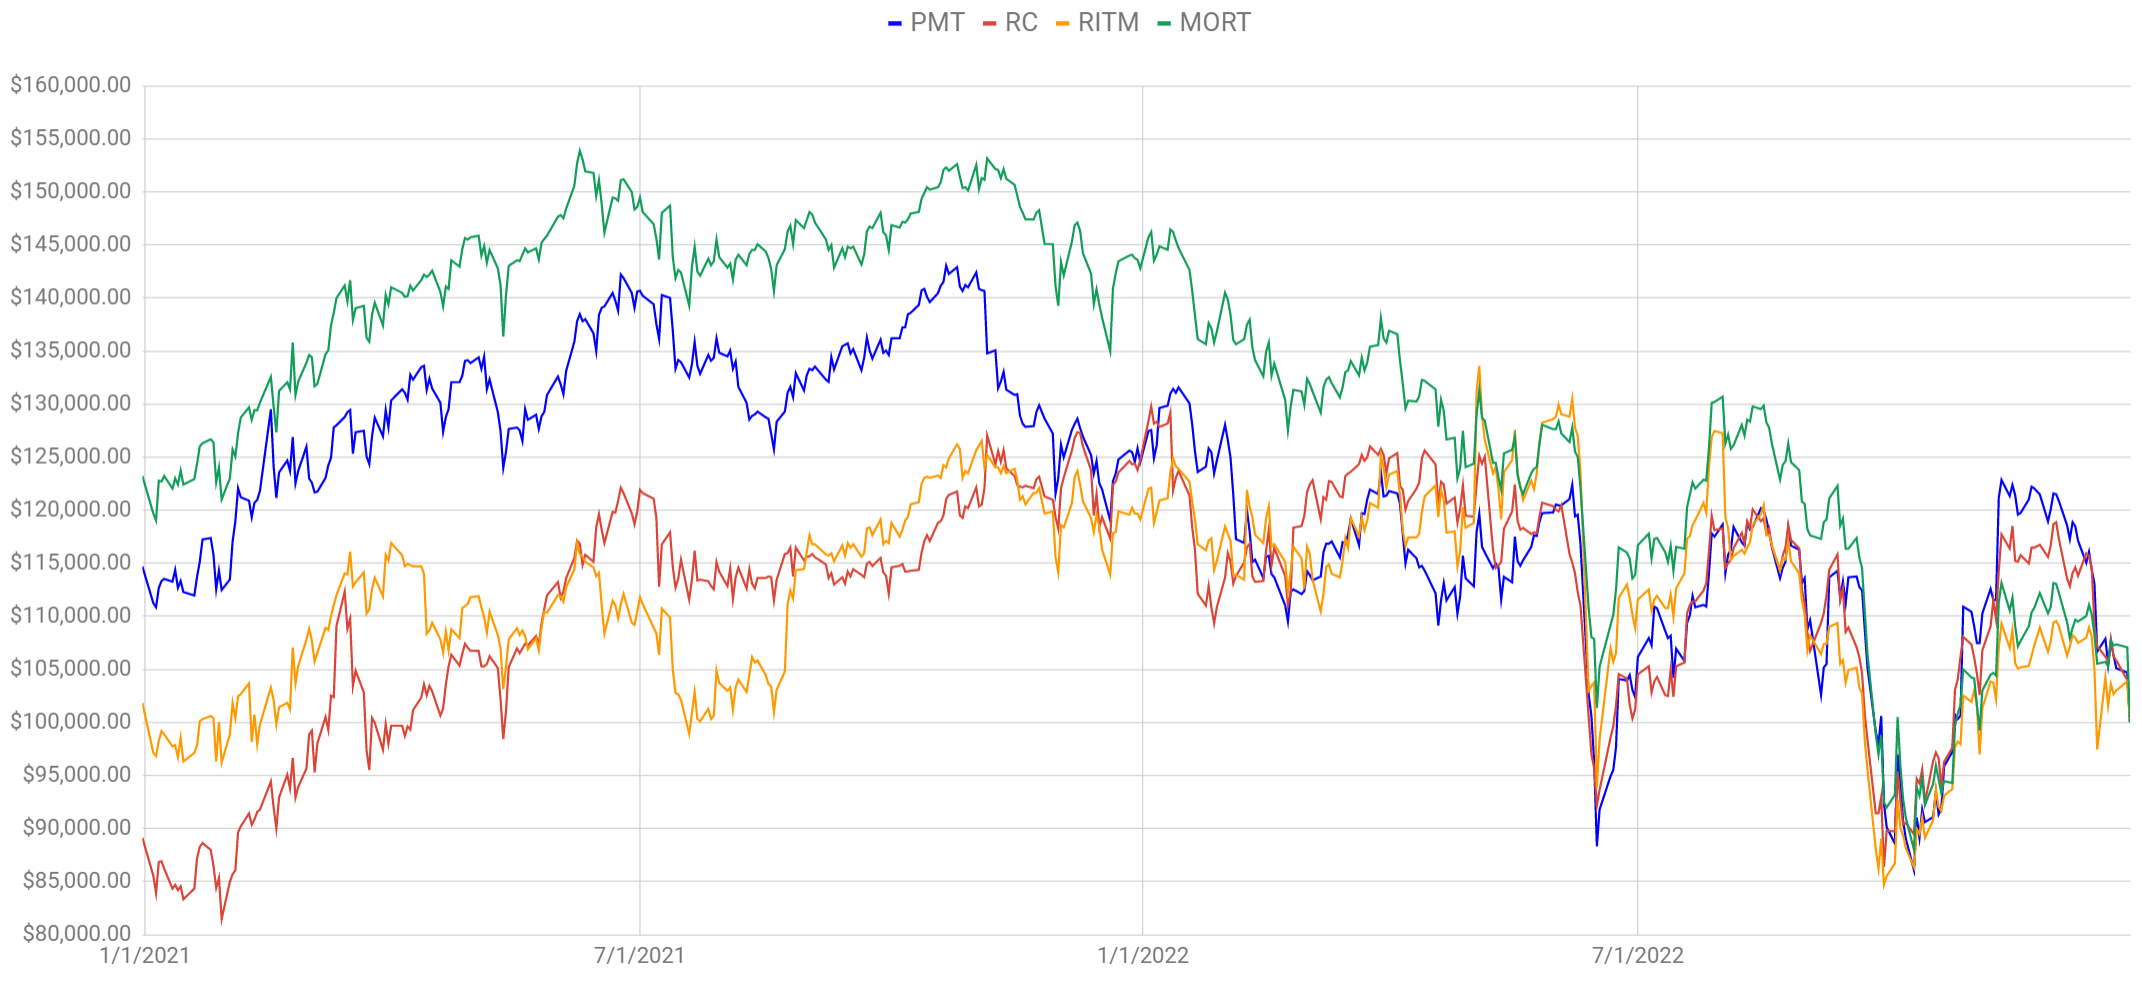
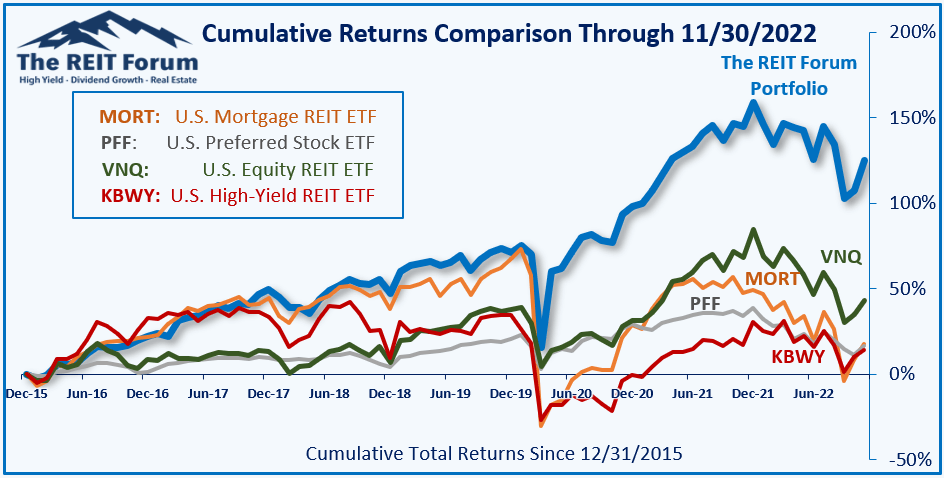
The Chart
The $100k chart contrasts performance for a few mortgage REITs and one mortgage REIT ETF:
The REIT Forum
Despite RC outperforming most mortgage REITs since the start of 2021 and since the start of 2022, shares recently got hammered. That outperformance makes sense when you consider that the actual results for RC have been pretty good.
Book value per share at the end of Q3 2022 was actually up relative to the end of 2020. It's no wonder RC outperformed the index over that period.
Account
This trade was placed in a tax-advantaged account. It is intended as a trading position. It should generate some income, but I'm more interested in the potential for a capital gain as the price-to-book ratio changes over time.
RC has been a solid performer overall. The mortgage REIT has done quite well. Yet shares were caught up in the recent dip and fell quite hard. This looks like a nice opportunity to increase our position, so we picked up some more shares.
I would expect shares to dip tomorrow since they go ex-dividend for $.40. However, I still like the price. $11.29 today is like $10.89 tomorrow. So while prices will probably be down tomorrow, that's just fine.
This is in our tax-advantaged accounts as we are intending to use the position for trading. We expect the price-to-book ratio to increase, which would give us the opportunity for a gain. Meanwhile, we're collecting a nice dividend.
Pretty clear? We're moving on to a few more picks.
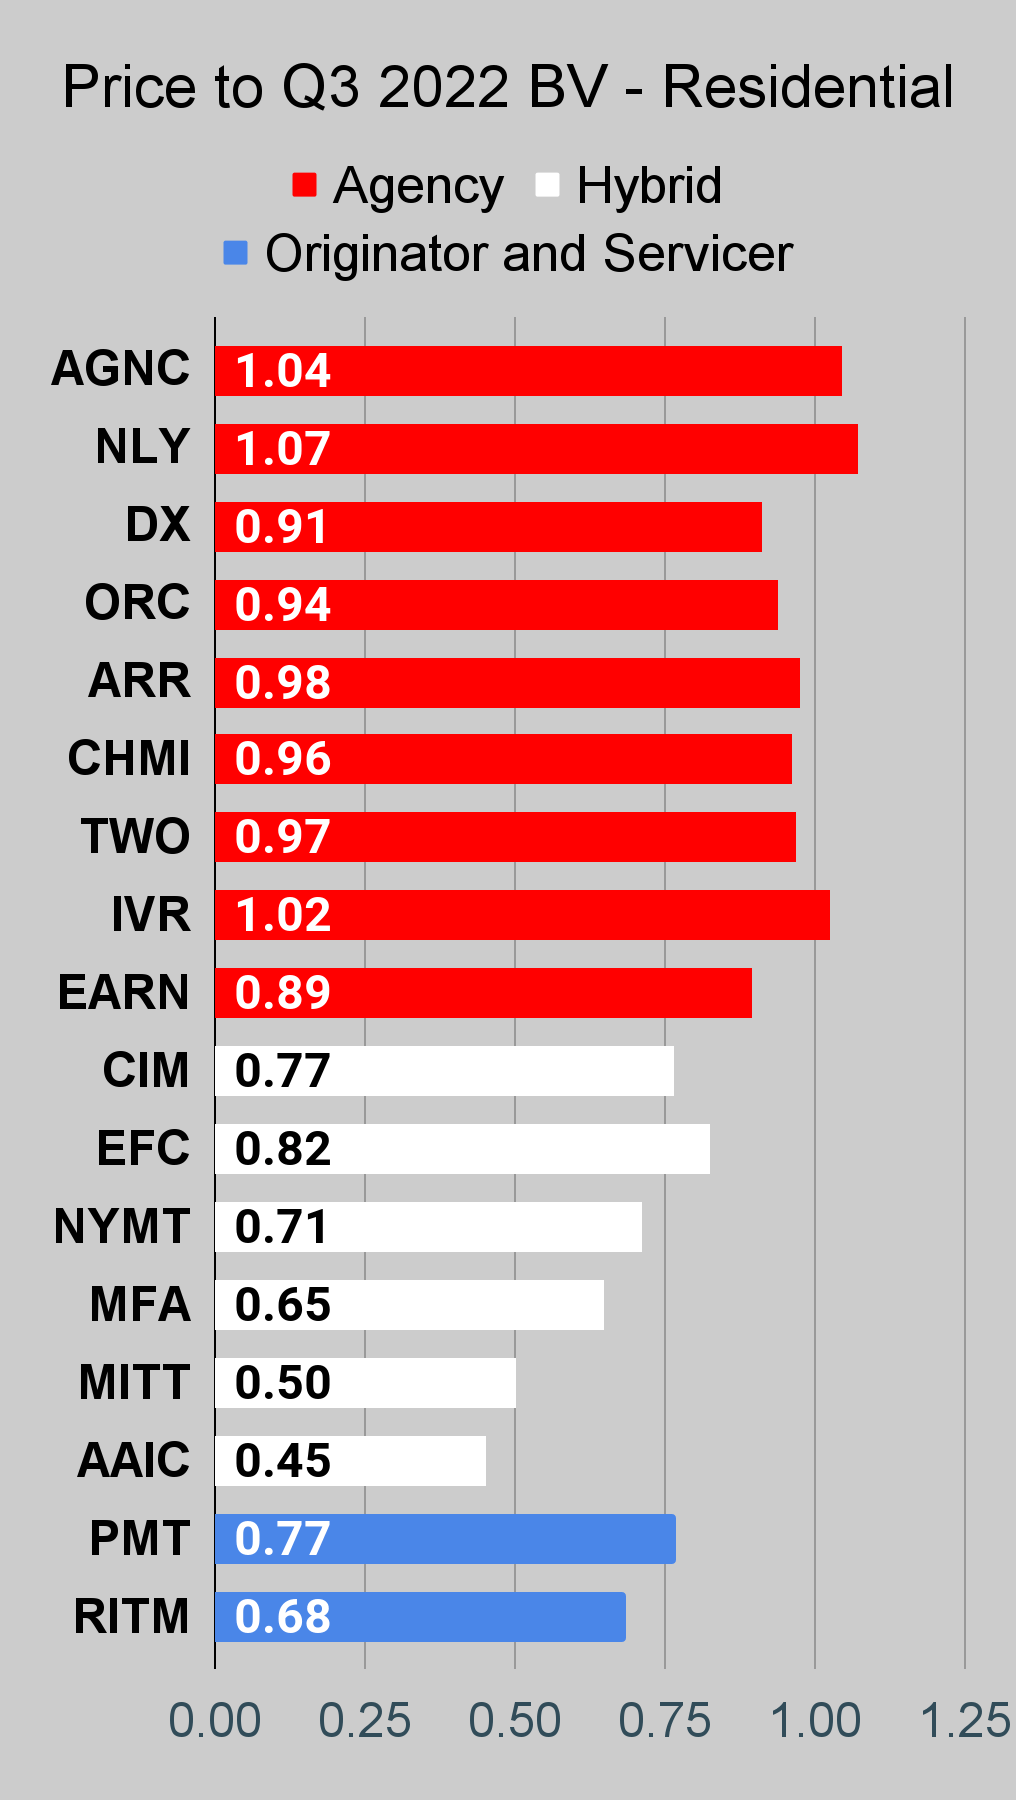
Looking over to the agency mortgage REITs, I think Dynex Capital (DX) continues to stand out. The discount to projected book value for DX is materially better than the discount on peers. Investors are concerned about DX due to the lower core earnings reported in the prior quarter, but investors are focusing too much on core earnings. The bigger story continues to be book value. When you see two similar mortgage REITs producing dramatically different levels of core earnings, you should look a bit deeper. The earnings for DX don’t tell the full story, while peers have their positions designed to enhance core earnings.
The DX strategy worked much better, resulting in a far smaller decline in book value per share this year, but investors are focusing on the quarterly net interest income rather than the underlying portfolio. DX is one of the best mortgage REITs and deserves some credit, but the current valuation (around 14% below book value) is large compared to many of their agency mortgage REIT peers. DX should have one of the highest price-to-book ratios among the agency mortgage REITs, rather than the lowest ratio.
I’m going to toss in a really high-risk pick. AG Mortgage Investment Trust (MITT) trades at a massive discount to book value. It wasn’t that long ago that we were telling investors they were crazy for paying high price-to-book ratios on MITT. Many didn’t listen and saw their investment get slaughtered. While MITT had a rough year with book value down around 25%, the share price is down 48% year-to-date. This is absolutely a higher-risk position. However, MITT could still generate quite a bit of value for shareholders through repurchasing shares at less than half of book value of buying back preferred shares in the $15.00 to $18.00 range. That’s still a viable way to improve cash flows to common shareholders. This is a higher-risk position, but the discount to book generates dramatic upside.
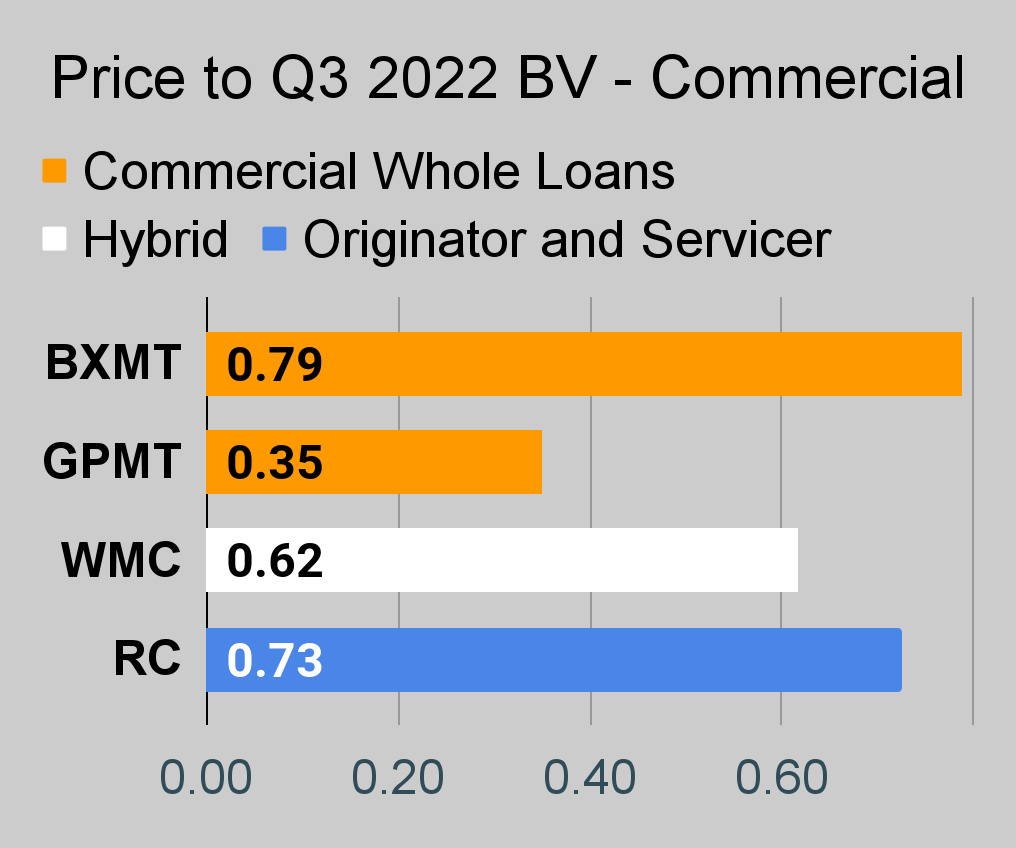
I also think Granite Point Mortgage Trust (GPMT) is another great choice for investors willing to take on higher risk levels. GPMT certainly has some flaws but shares trade at a .36 price-to-NAV ratio. All the REIT really needs to do to drive value to shareholders is use principal repayments from their loan portfolio (net of repaying their own financing) to repurchase shares. What they don’t need is to originate new loans. New loans may seem attractive for better credit spreads, but buying back shares is a vastly better path to value creation.
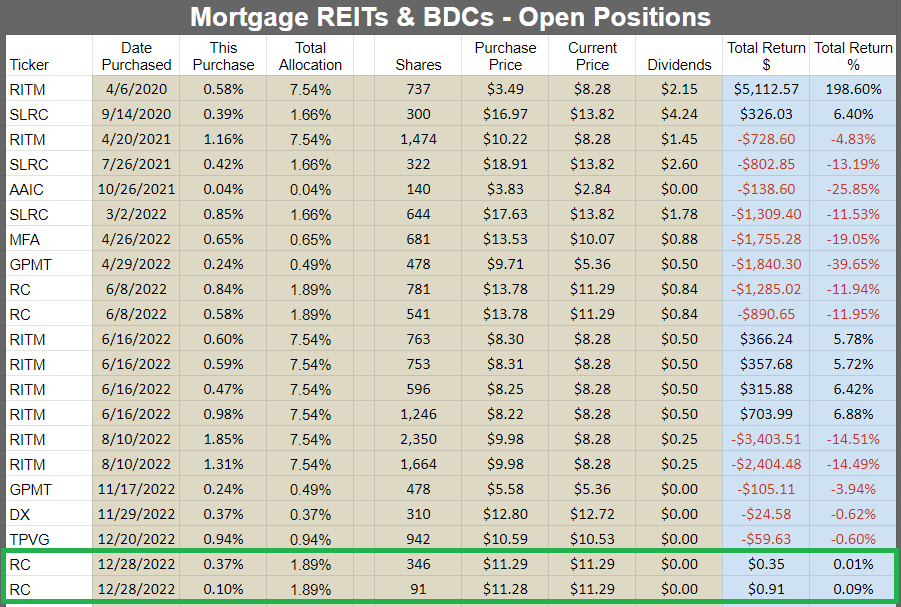
Stock Table
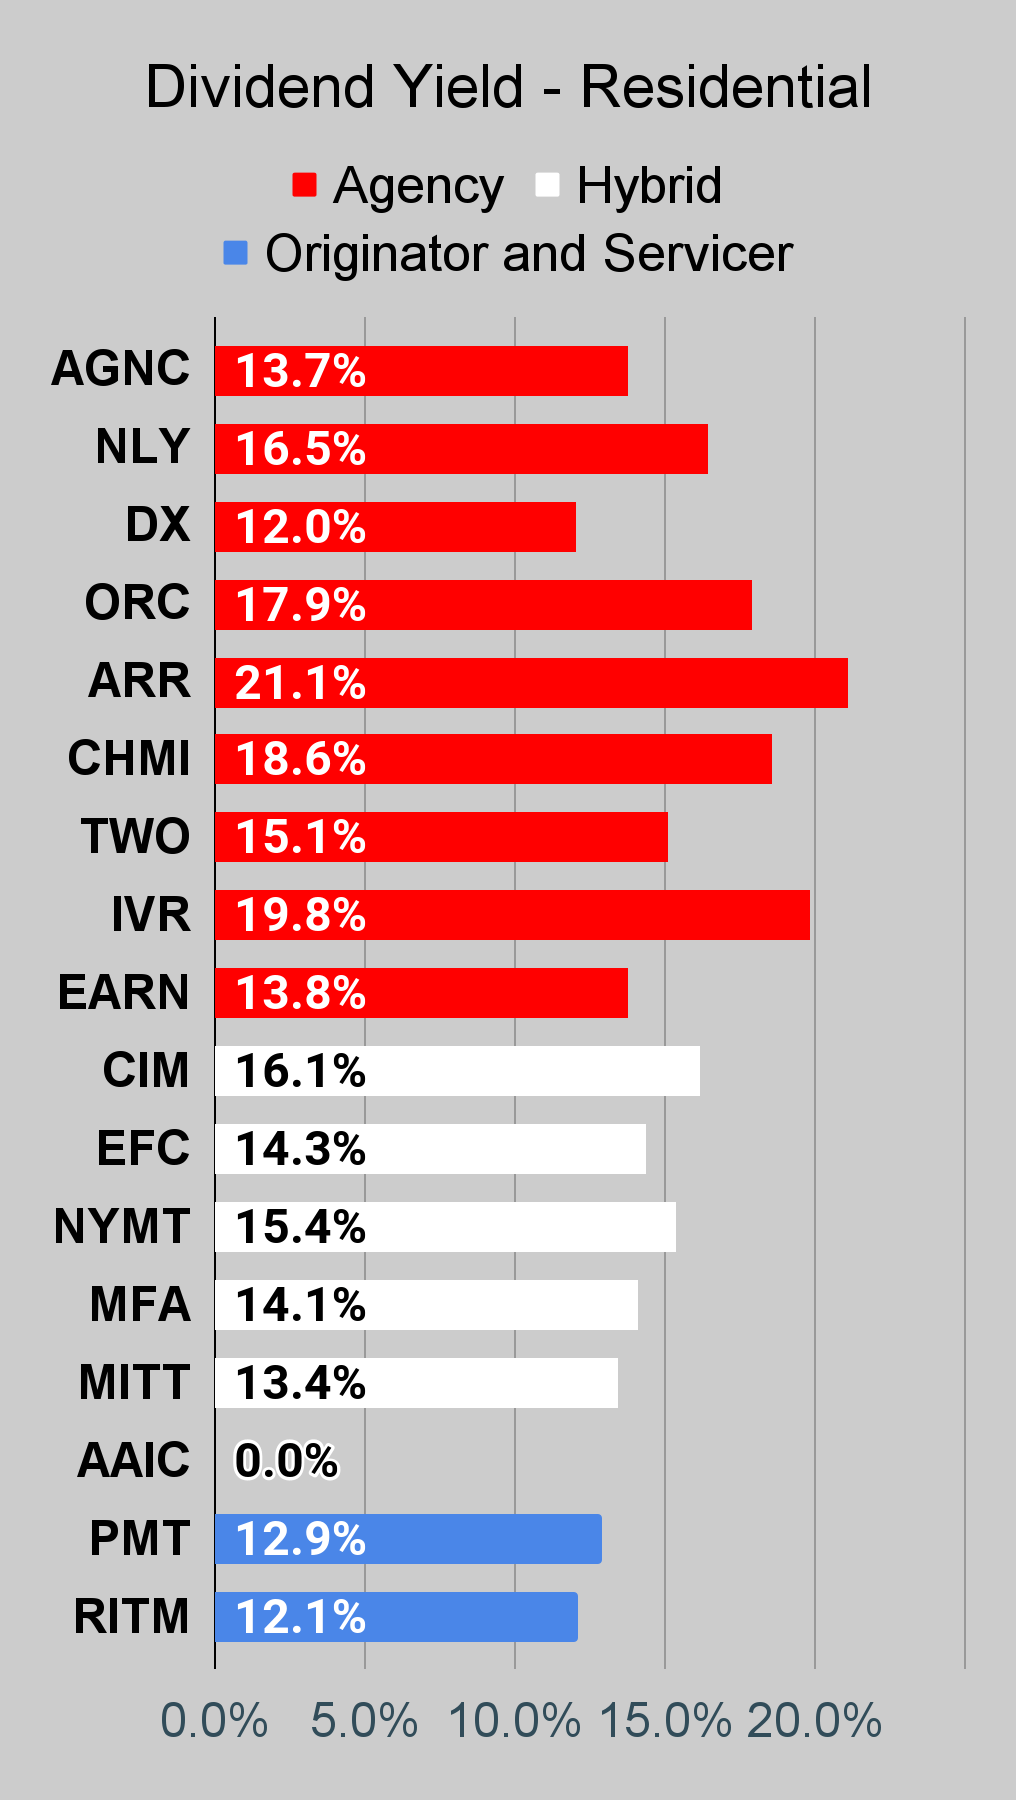
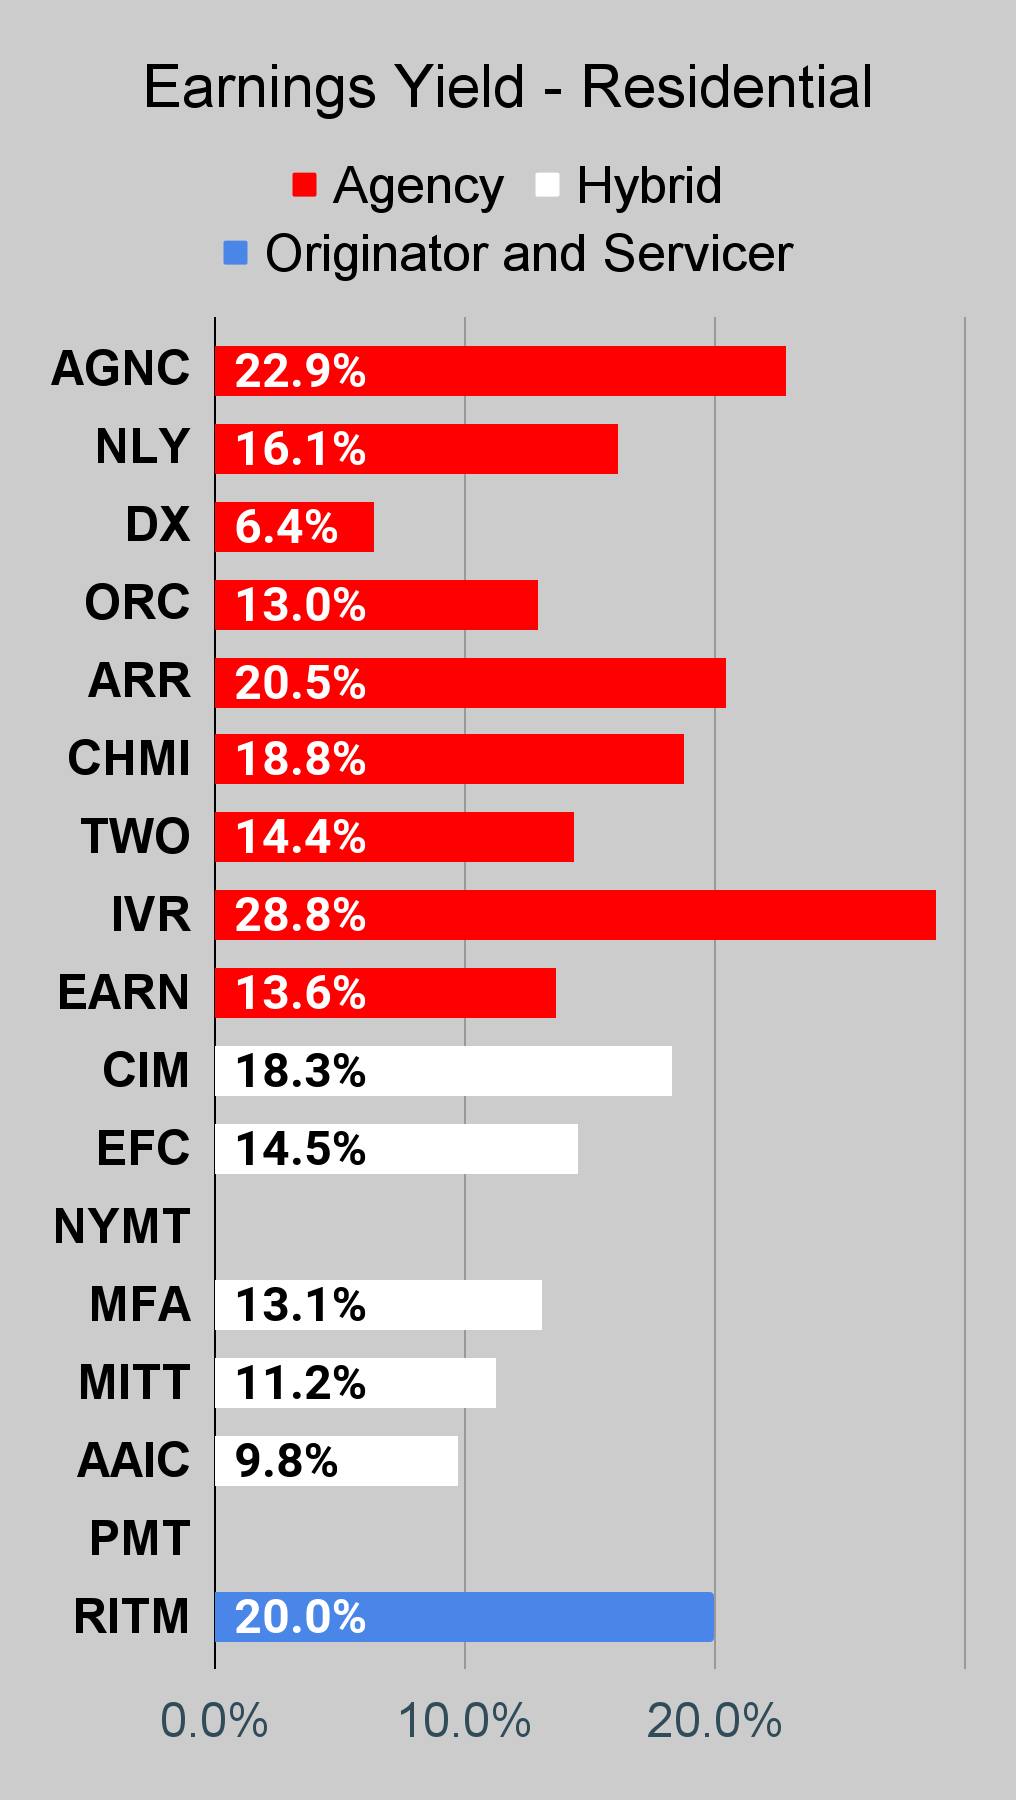
We will close out the rest of the article with the tables and charts we provide for readers to help them track the sector for both common shares and preferred shares.
We’re including a quick table for the common shares that will be shown in our tables:
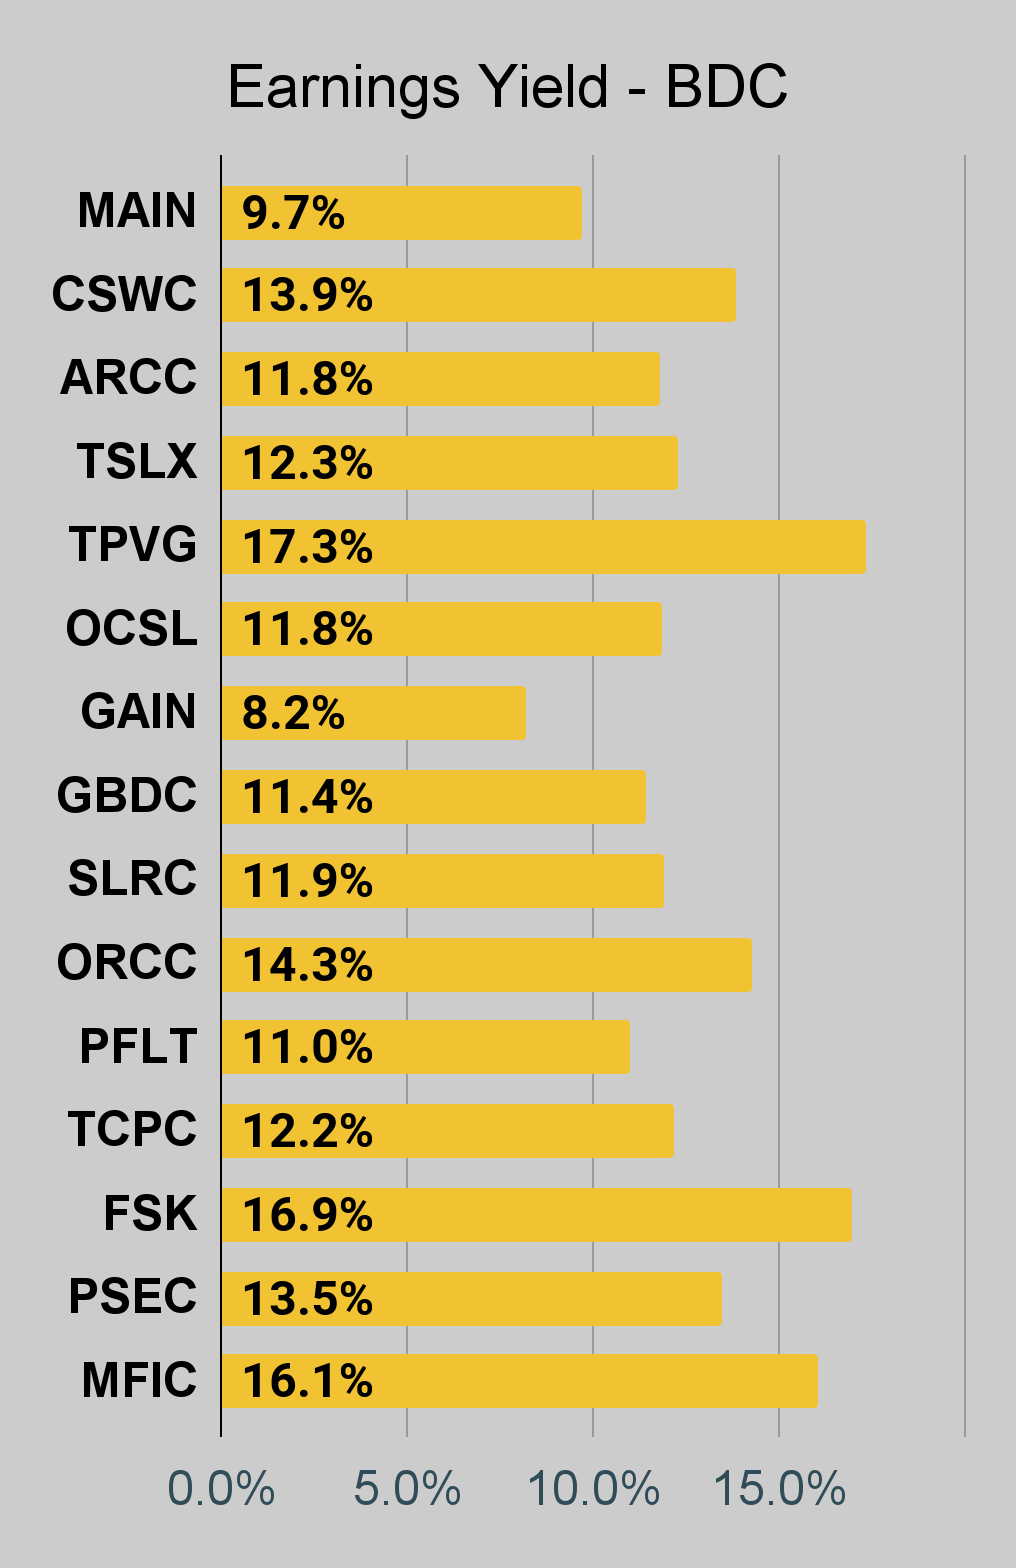
Note: The chart for our public articles uses the book value per share from the latest earnings release. Current estimated book value per share is used in reaching our targets and trading decisions. It's available in our service, but those estimates are not included in the charts below. PMT and NYMT are not showing an earnings yield metric as neither REIT provides a quarterly “Core EPS” metric.
The REIT Forum
The REIT Forum
The REIT Forum
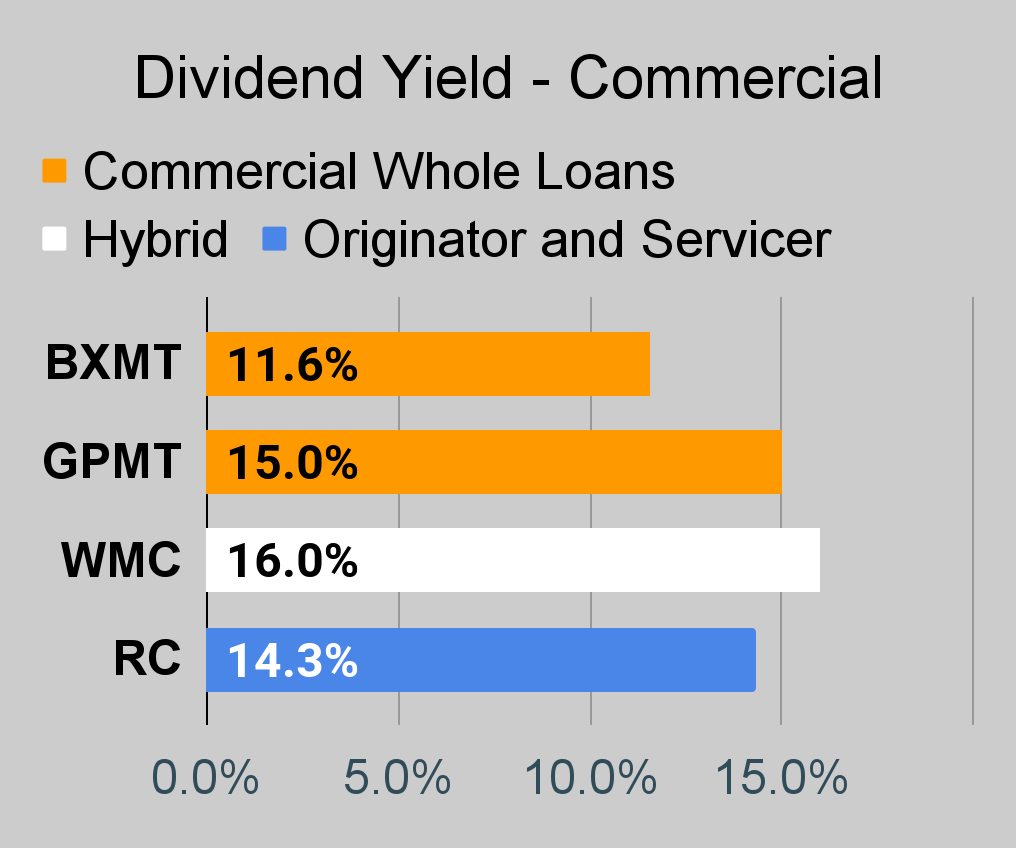
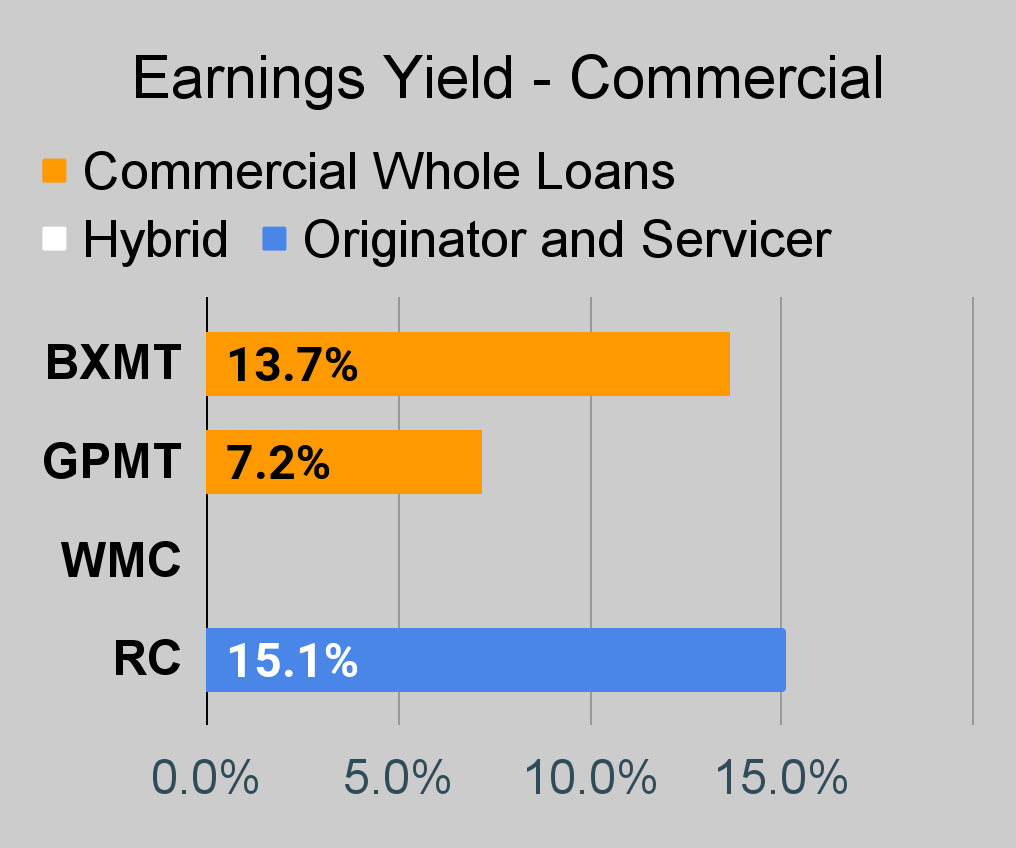
Commercial Mortgage REIT Charts
The REIT Forum
The REIT Forum
The REIT Forum
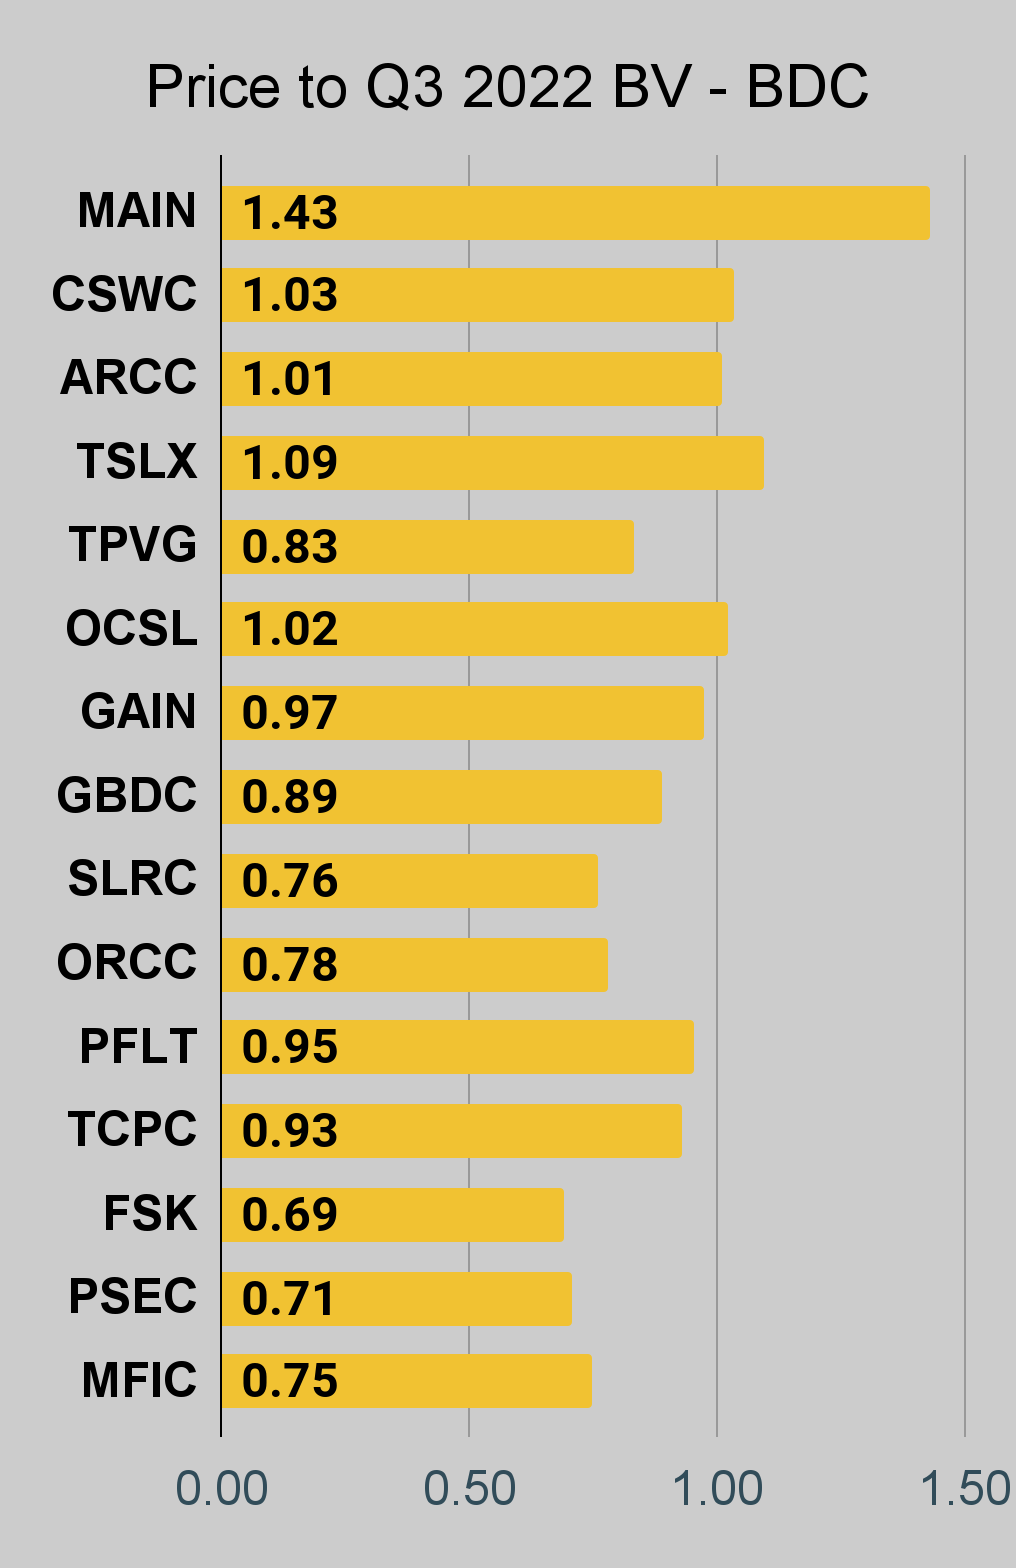
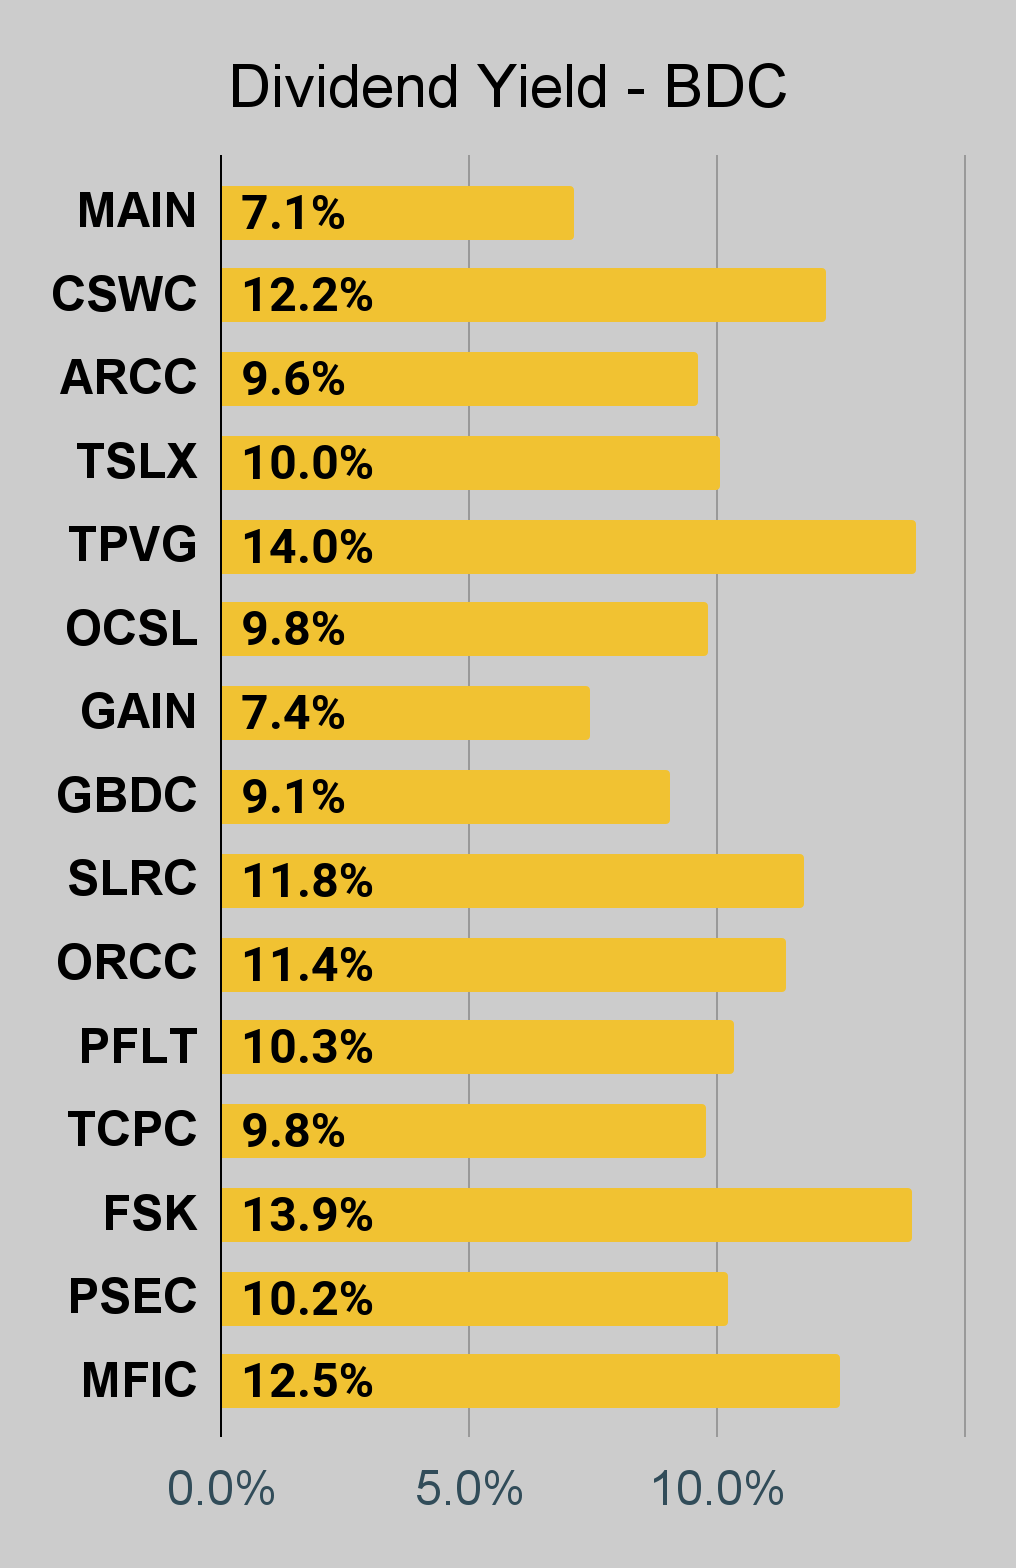
BDC Charts
The REIT Forum
The REIT Forum
The REIT Forum
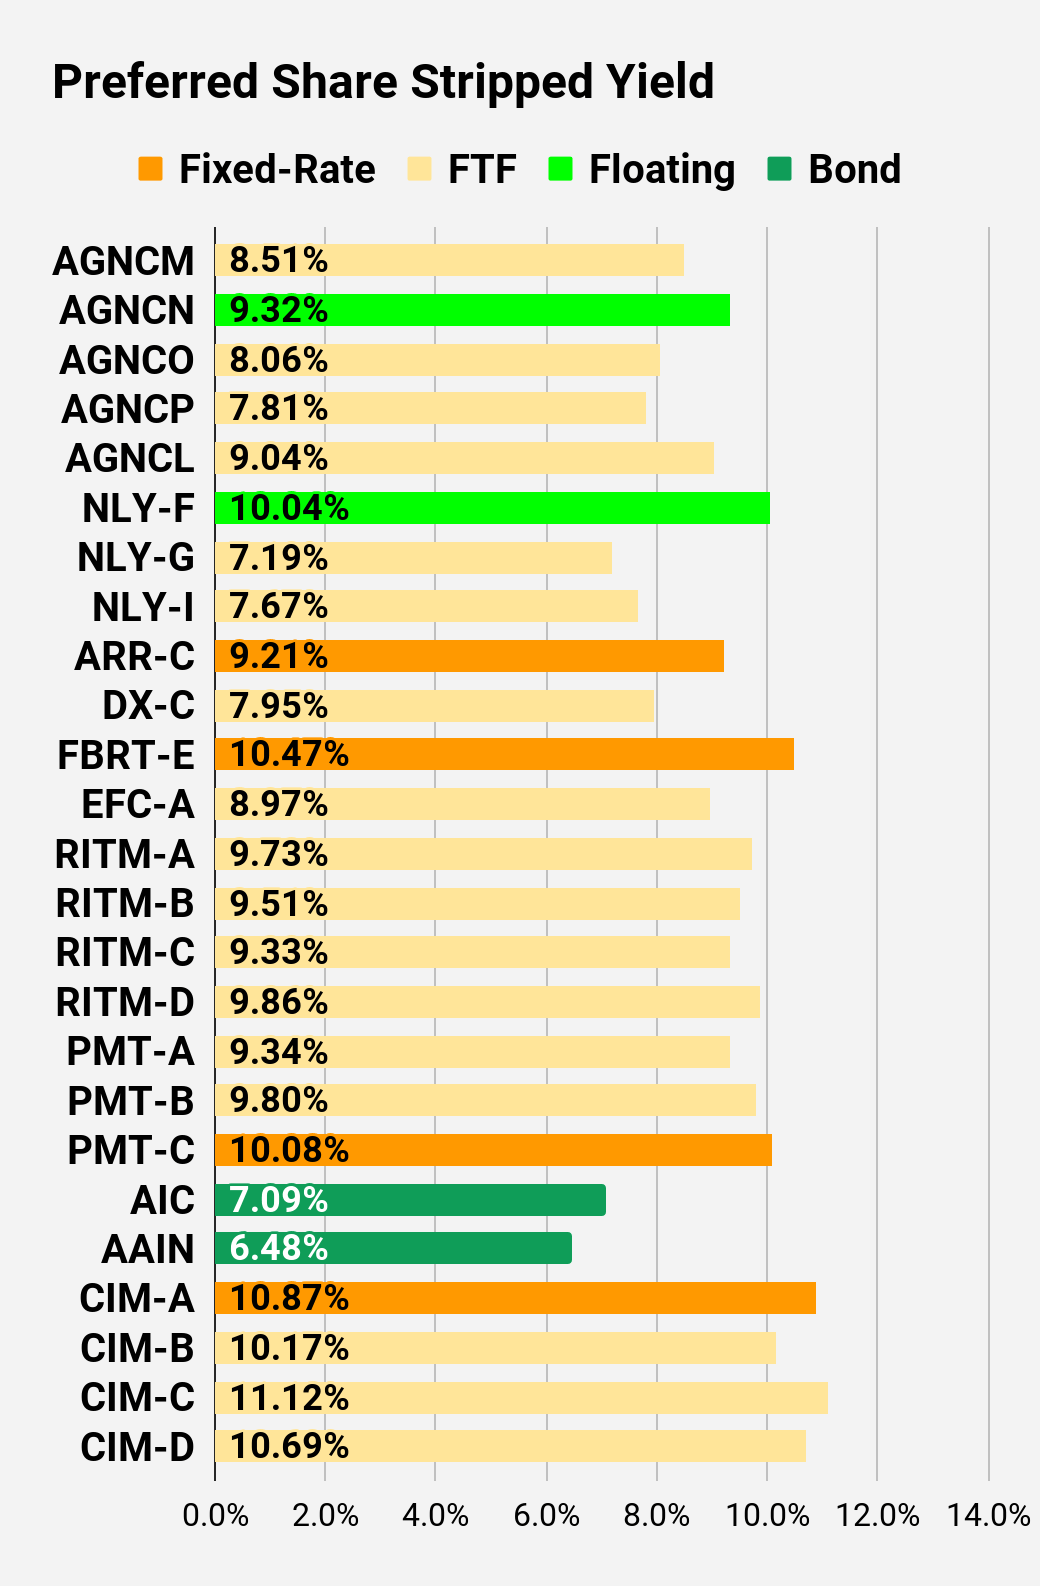
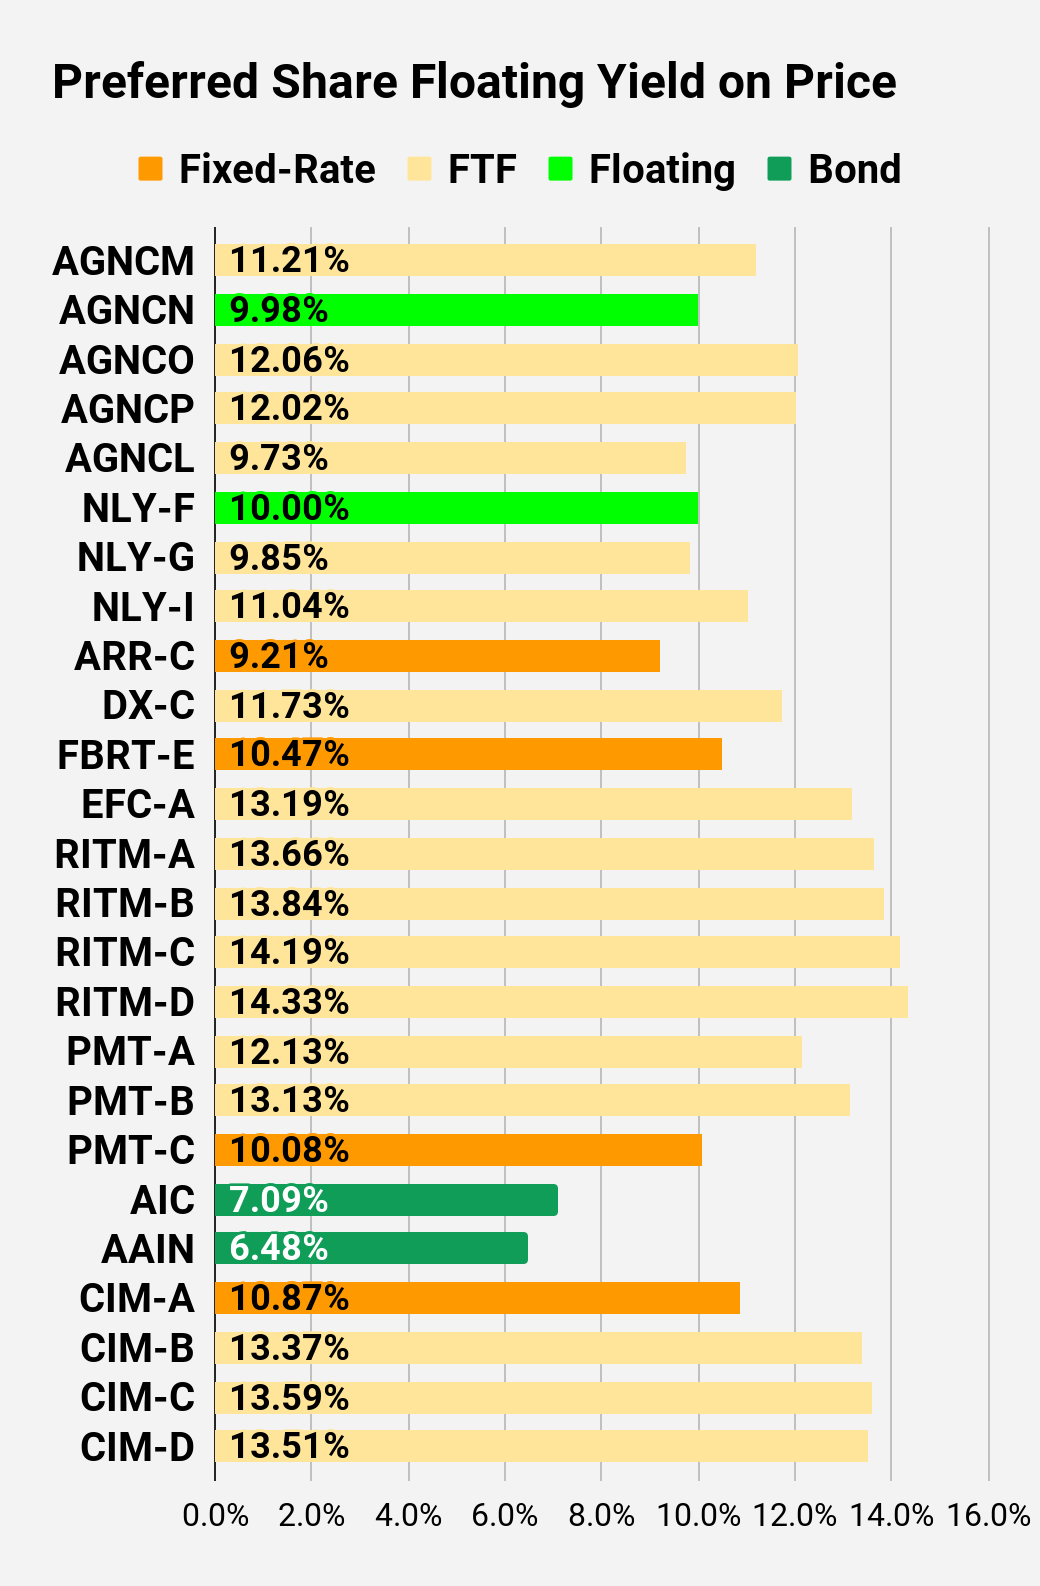
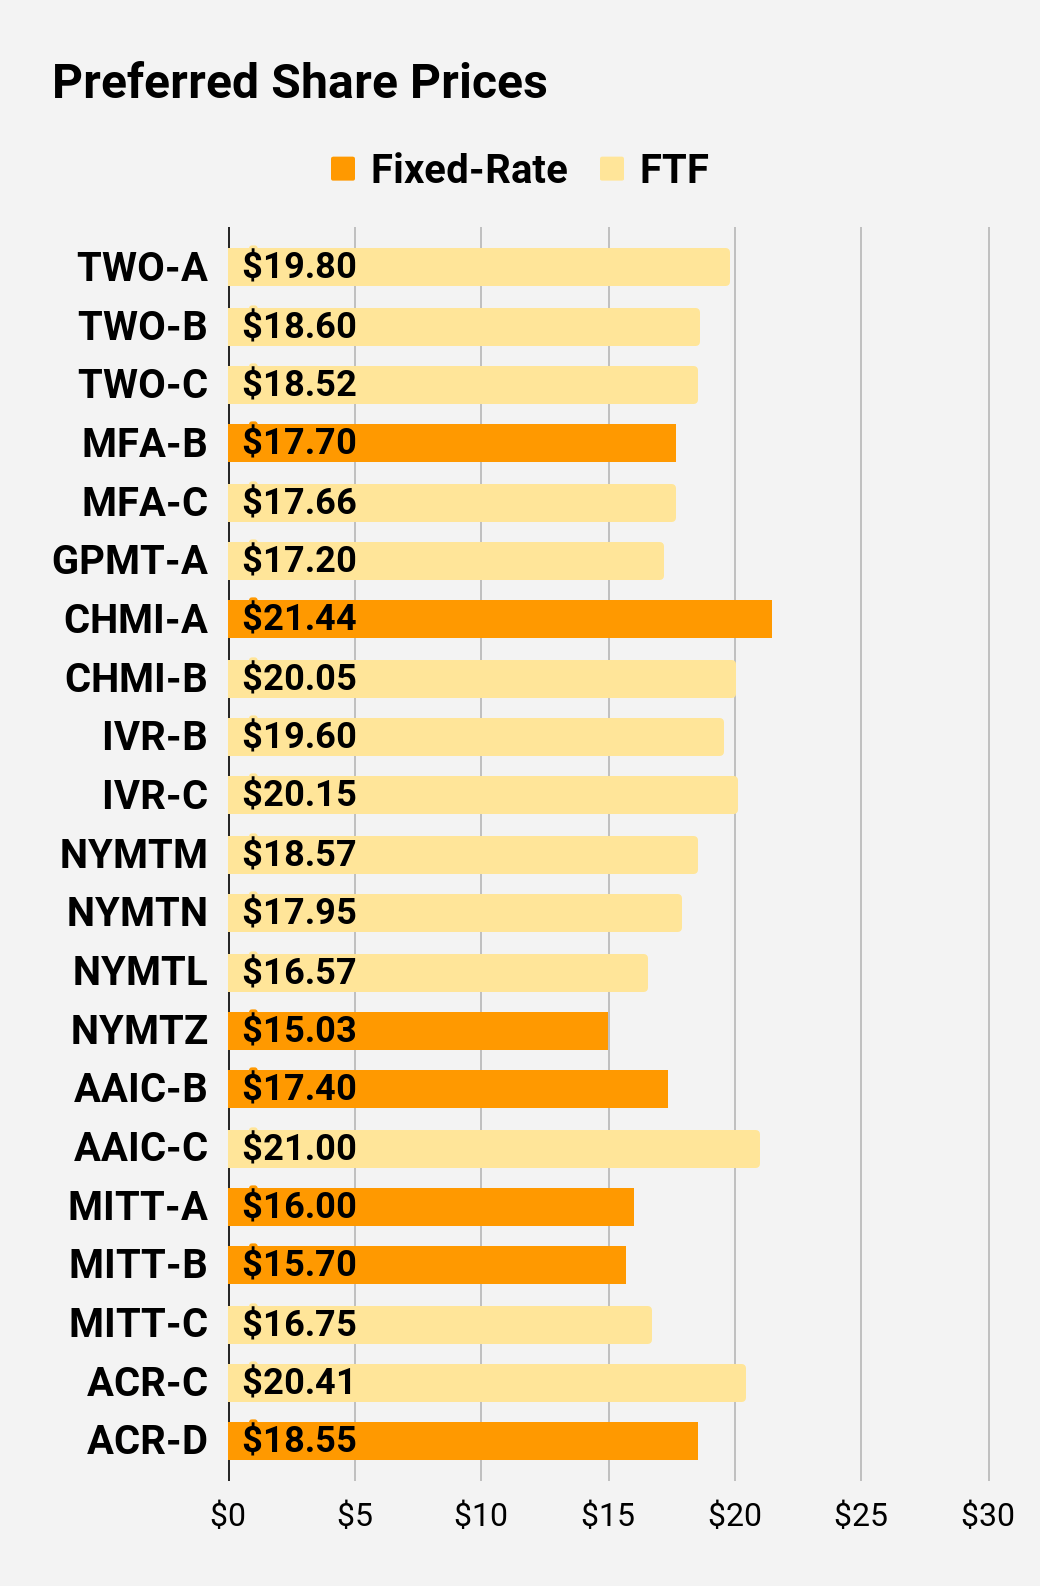
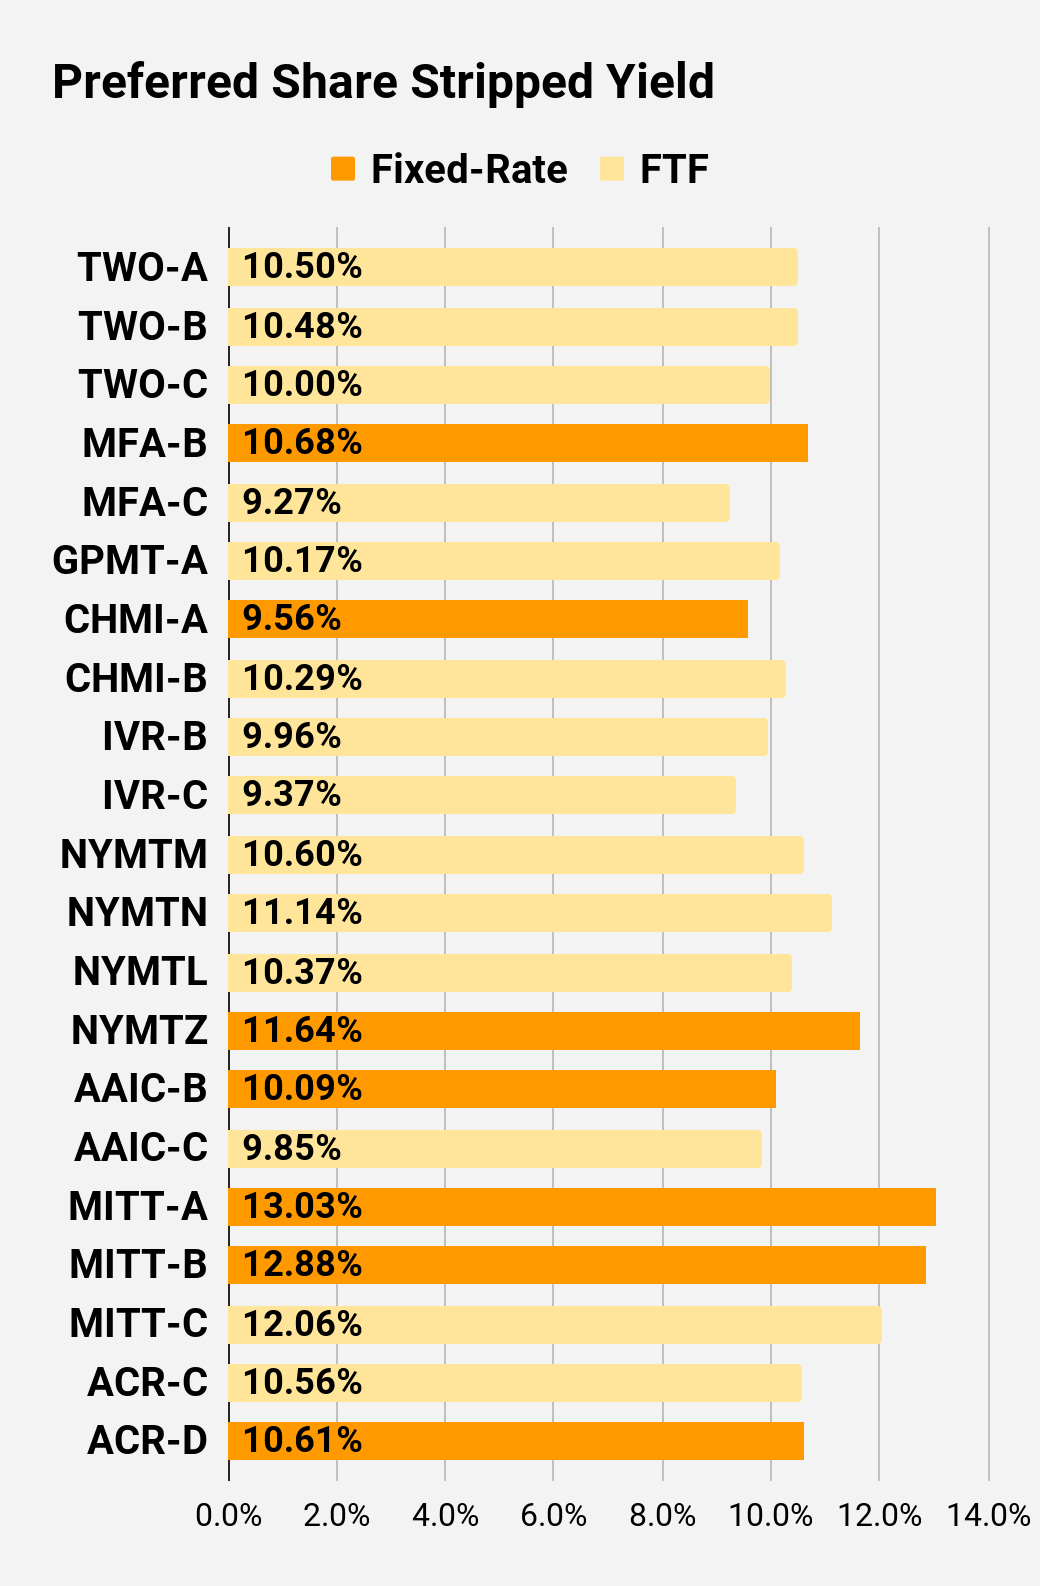
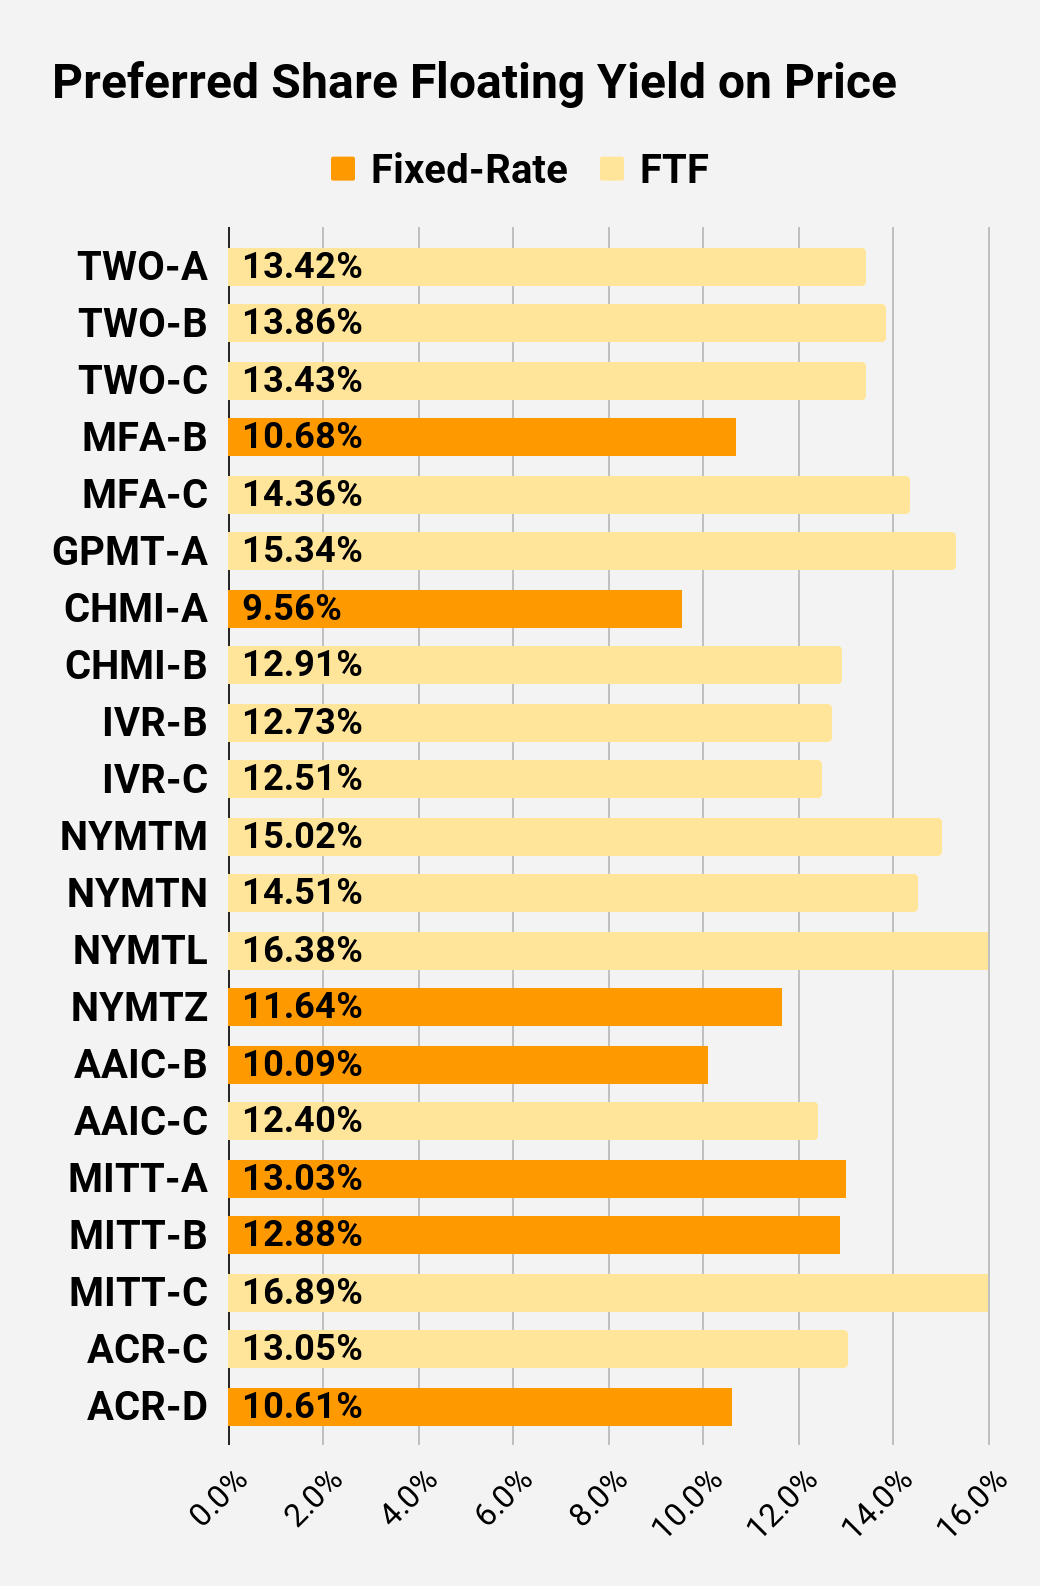
Preferred Share Charts
I changed the coloring a bit. We needed to adjust to include that the first fixed-to-floating shares have transitioned over to floating rates. When a share is already floating, the stripped yield may be different from the “Floating Yield on Price” due to changes in interest rates. For instance, NLY-F already has a floating rate. However, the rate is only reset once per three months. The stripped yield is calculated using the upcoming projected dividend payment and the “Floating Yield on Price” is based on where the dividend would be if the rate reset today. In my opinion, for these shares the “Floating Yield on Price” is clearly the more important metric.
The REIT Forum
The REIT Forum
The REIT Forum
The REIT Forum
The REIT Forum
The REIT Forum
Preferred Share Data
Beyond the charts, we’re also providing our readers with access to several other metrics for the preferred shares.
After testing out a series on preferred shares, we decided to try merging it into the series on common shares. After all, we're still talking about positions in mortgage REITs. We don’t have any desire to cover preferred shares without cumulative dividends, so any preferred shares you see in our column will have cumulative dividends. You can verify that by using Quantum Online. We’ve included the links in the table below.
To better organize the table, we needed to abbreviate column names as follows:
Price = Recent Share Price - Shown in Charts
BoF = Bond or FTF (Fixed-to-Floating)
S-Yield = Stripped Yield - Shown in Charts
Coupon = Initial Fixed-Rate Coupon
FYoP = Floating Yield on Price - Shown in Charts
NCD = Next Call Date (the soonest shares could be called)
Note: For all FTF issues, the floating rate would start on NCD.
WCC = Worst Cash to Call (lowest net cash return possible from a call)
Our goal is to maximize total returns. We achieve those most effectively by including “trading” strategies. We regularly trade positions in the mortgage REIT common shares and BDCs because:
Prices are inefficient.
Long term, share prices generally revolve around book value.
Short term, price-to-book ratios can deviate materially.
Book value isn’t the only step in analysis, but it's the cornerstone.
We also allocate to preferred shares and equity REITs. We encourage buy-and-hold investors to consider using more preferred shares and equity REITs.
Performance
We compare our performance against four ETFs that investors might use for exposure to our sectors:
The high-yield equity REIT ETF. Yes, it has been dreadful.
When investors think it isn’t possible to earn solid returns in preferred shares or mortgage REITs, we politely disagree. The sector has plenty of opportunities, but investors still need to be wary of the risks. We can’t simply reach for yield and hope for the best. When it comes to common shares, we need to be even more vigilant to protect our principal by regularly watching prices and updating estimates for book value and price targets.
Ratings: Bullish on AGNCO, AGNCP, RC, DX, MITT, GPMT
Editor's Note: This article covers one or more microcap stocks. Please be aware of the risks associated with these stocks.
You should try our service. Unlike most services, our service is backed by a real portfolio. Not a "model" portfolio. Not hypothetical positions. Not 7 different portfolios we made up in Google Sheets so we can brag about the good one. None of that crap.
You get real-time alerts on every trade. See current and past positions. I'm sick of analysts who have to retroactively pick a "portfolio" or get creative about defining "returns". Beat the index or get out.
Ask your analyst to share their portfolio value each month so you can verify their returns. When they object, try us.
Colorado Wealth Management is a REIT specialist who began his decades-long investment career in a family-owned realtor office before launching his own company and embracing his drive for deep-dive REIT analysis. He holds an MBA and has passed all 3 CFA exams. He focuses on Equity REITs, Mortgage REITs, and preferred shares. Scott Kennedy is a Certified Public Accountant and Certified in Financial Forensics. He is currently a partner at a national accounting firm.
He leads the investing group The REIT Forum. Features of the group include: Exclusive REIT focus analysis, proprietary charts and data models, real-time trade alerts posted multiple times a month, multiple subscriber-only portfolios, and access to the service's team of analysts and support staff for dialogue and questions on the REIT space. Learn more.
Analyst’s Disclosure:I/we have a beneficial long position in the shares of AGNCO, RITM-D, AGNCP, NYMTL, AGNCM, ARR-C, FBRT-E, GPMT-A, PMT-C, NYMTM, EFC-A, RITM-B, RITM, SLRC, AAIC, MFA, GPMT, RC, DX, TPVG either through stock ownership, options, or other derivatives. I wrote this article myself, and it expresses my own opinions. I am not receiving compensation for it (other than from Seeking Alpha). I have no business relationship with any company whose stock is mentioned in this article.
Colorado Wealth Management Fund and Scott Kennedy are supporting contributors for The REIT Forum. Our ratings and outlooks will often overlap.
Any recommendation posted in this article is not indefinite. We closely monitor all of our positions. We issue Buy and Sell alerts on our recommendations, which are exclusive to our members.
I have an indirect conflict of interest with ABR and STWD. Neither I, nor any contributor for The REIT Forum, will provide investment advice, reply to questions, or engage in discussions regarding these two mREIT stocks.
Seeking Alpha's Disclosure: Past performance is no guarantee of future results. No recommendation or advice is being given as to whether any investment is suitable for a particular investor. Any views or opinions expressed above may not reflect those of Seeking Alpha as a whole. Seeking Alpha is not a licensed securities dealer, broker or US investment adviser or investment bank. Our analysts are third party authors that include both professional investors and individual investors who may not be licensed or certified by any institute or regulatory body.