Dzmitry Dzemidovich
REIT Performance
2022 was a brutal year for the REIT sector (-23.56%), but REITs started 2023 in a very positive direction. REITs achieved an impressive +11.77% total return in January outperforming the Dow Jones Industrial Average (+2.9%), S&P 500 (+6.3%) and NASDAQ (+10.7%). The market cap weighted Vanguard Real Estate ETF (VNQ) had a lower total return than the average REIT in January (+10.40% vs. +11.77%). The spread between the 2023 FFO multiples of large cap REITs (18.2x) and small cap REITs (12.4x) widened in January as multiples expanded by 1.6 turns for large caps and 1.1 turns for small caps. Investors currently need to pay an average of 46.8% more for each dollar of FFO from large cap REITs relative to small cap REITs. In this monthly publication, I will provide REIT data on numerous metrics to help readers identify which property types and individual securities currently offer the best opportunities to achieve their investment goals.
Source: Graph by Simon Bowler of 2nd Market Capital, Data compiled from S&P Global Market Intelligence LLC. See important notes and disclosures at the end of this article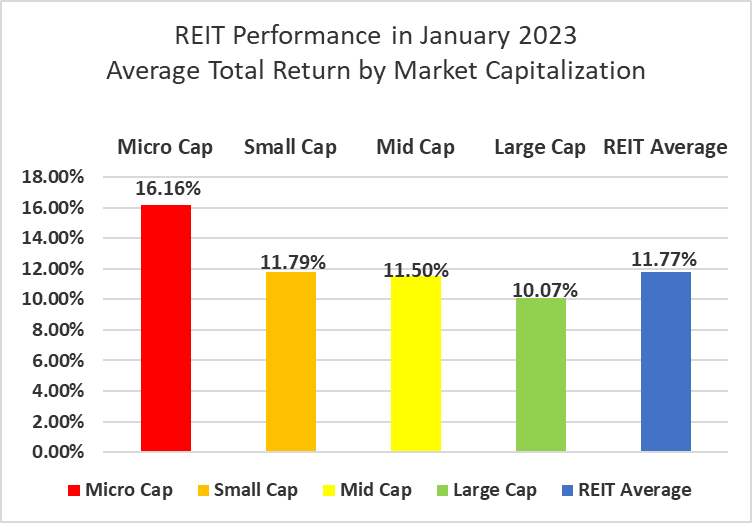
There was a strong negative correlation between total return and market cap in January. Large cap (+10.07%), mid cap (+11.50%) and small cap (+11.79%) REITs averaged low double-digit returns. Micro caps (+16.16%) significantly outperformed over the first month of the year. Small cap REITs outperformed large caps by 172 basis points.
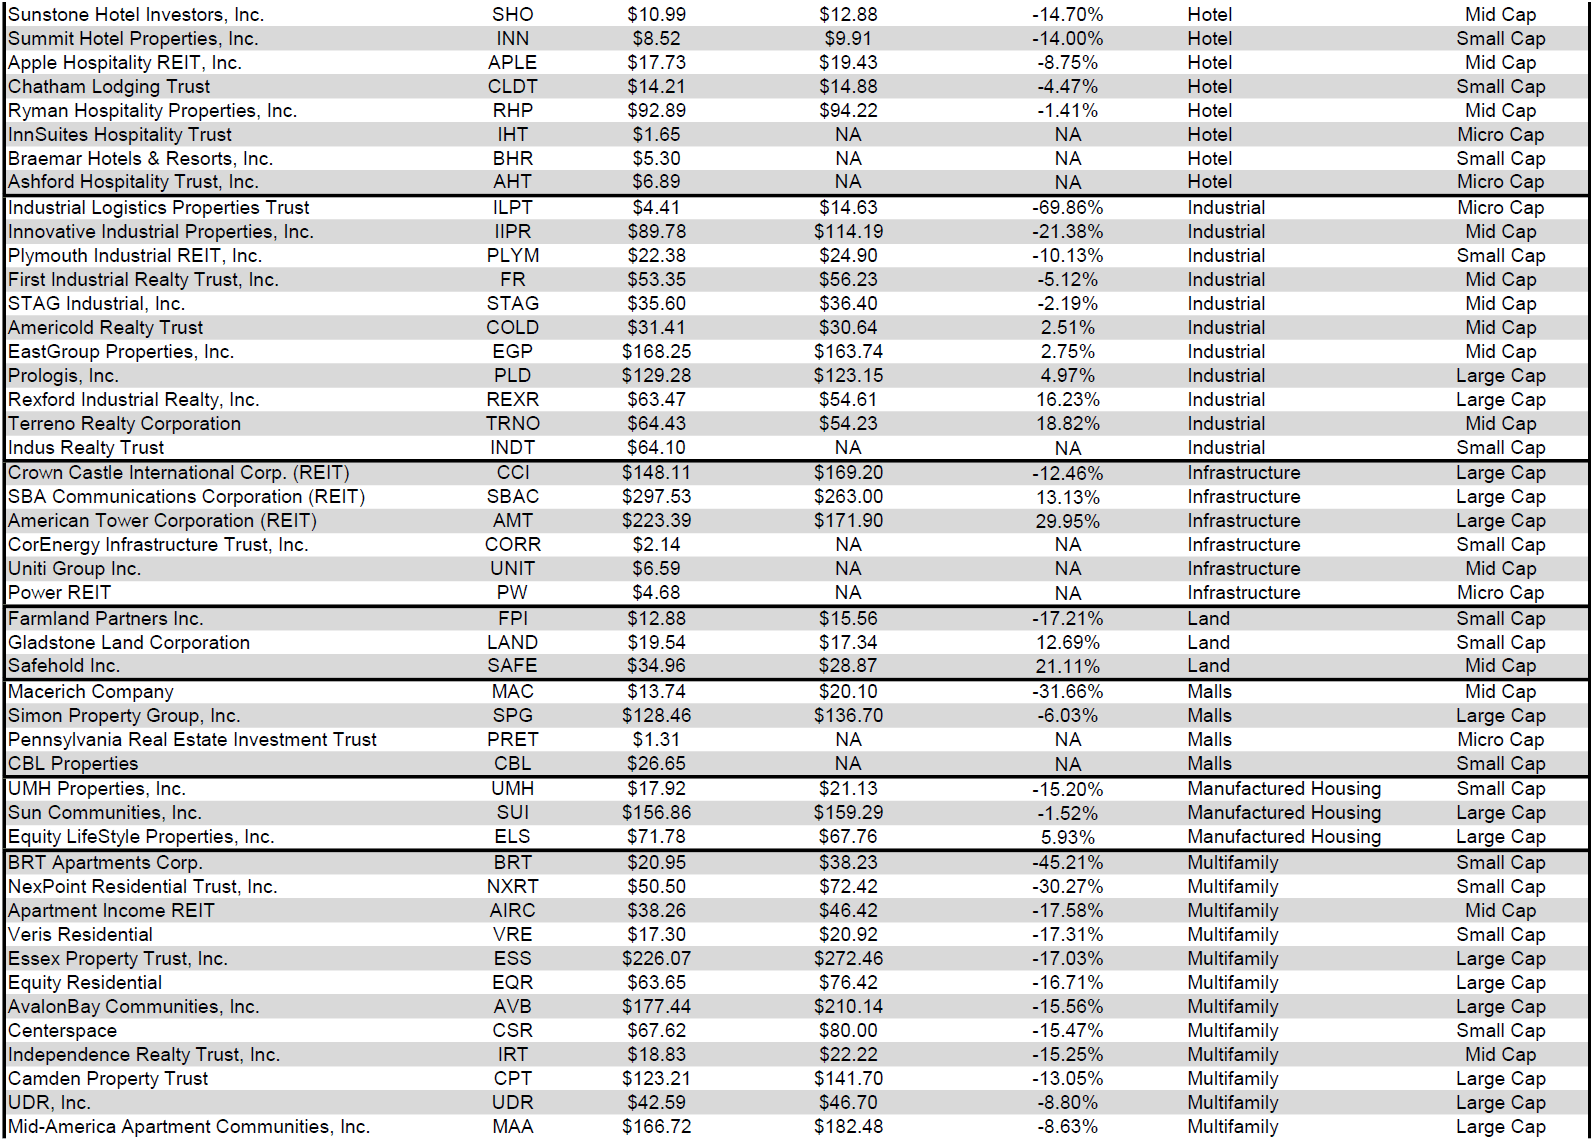
18 out of 18 Property Types Yielded Positive Total Returns in January
100% percent of REIT property types averaged a positive total return in January, with a 15.10% total return spread between the best and worst performing property types. Casino (+4.16%), Shopping Center (+7.03%), Triple Net (+7.91%), Self-Storage (9.71%) and Multifamily (+9.84%) were the only property types that fell short of a double-digit gain in January.
Hotel (+19.25%) and Advertising (+16.44%) REITs outpaced all other properties during January’s huge REIT recovery. With the exception of InnSuites Hospitality Trust (IHT) (-0.35%), Hotel REITs surged in January led by micro caps Ashford Hospitality Trust (AHT) and Sotherly Hotels (SOHO).
Source: Table by Simon Bowler of 2nd Market Capital, Data compiled from S&P Global Market Intelligence LLC. See important notes and disclosures at the end of this article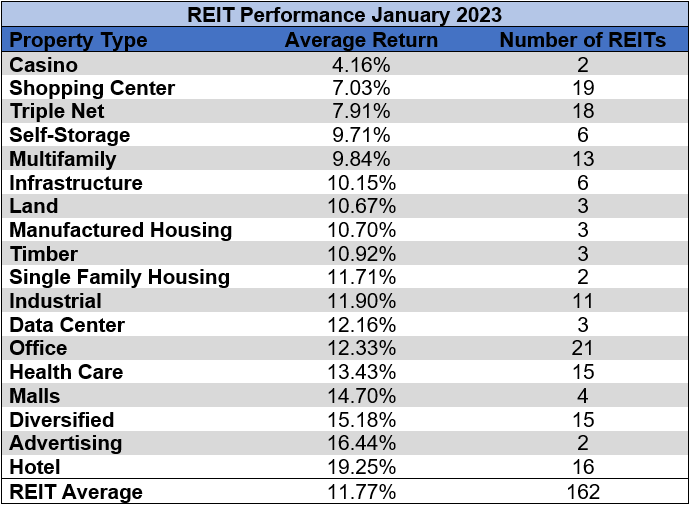
The REIT sector as a whole saw the average P/FFO (2023Y) increase 1.3 turns in January (from 12.8x up to 14.1x). The average FFO multiple expanded for 100% of property types. There are no recent 2023 FFO/share estimates for either of the Advertising REITs or any of the Timber REITs. Land (28.5x) Data Centers (22.8x), Industrial (21.5x) and Manufactured Housing (21.4x) continue to trade at the highest multiples among REIT property types. Mall (6.1x), Office (8.6x) and Hotel (9.1x) REITs all saw strong multiple expansion in January, but continue to trade at single digit multiples.
Source: Table by Simon Bowler of 2nd Market Capital, Data compiled from S&P Global Market Intelligence LLC. See important notes and disclosures at the end of this article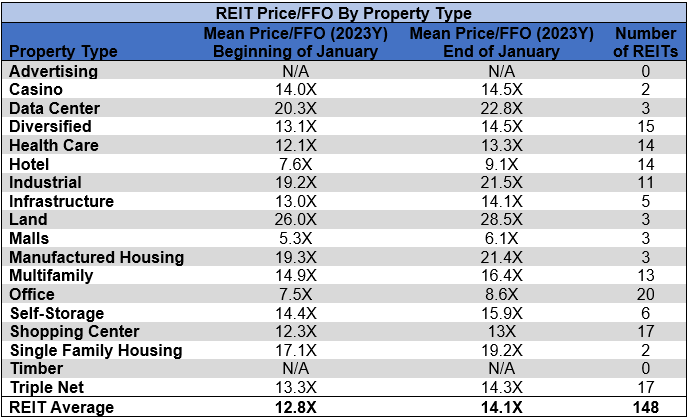
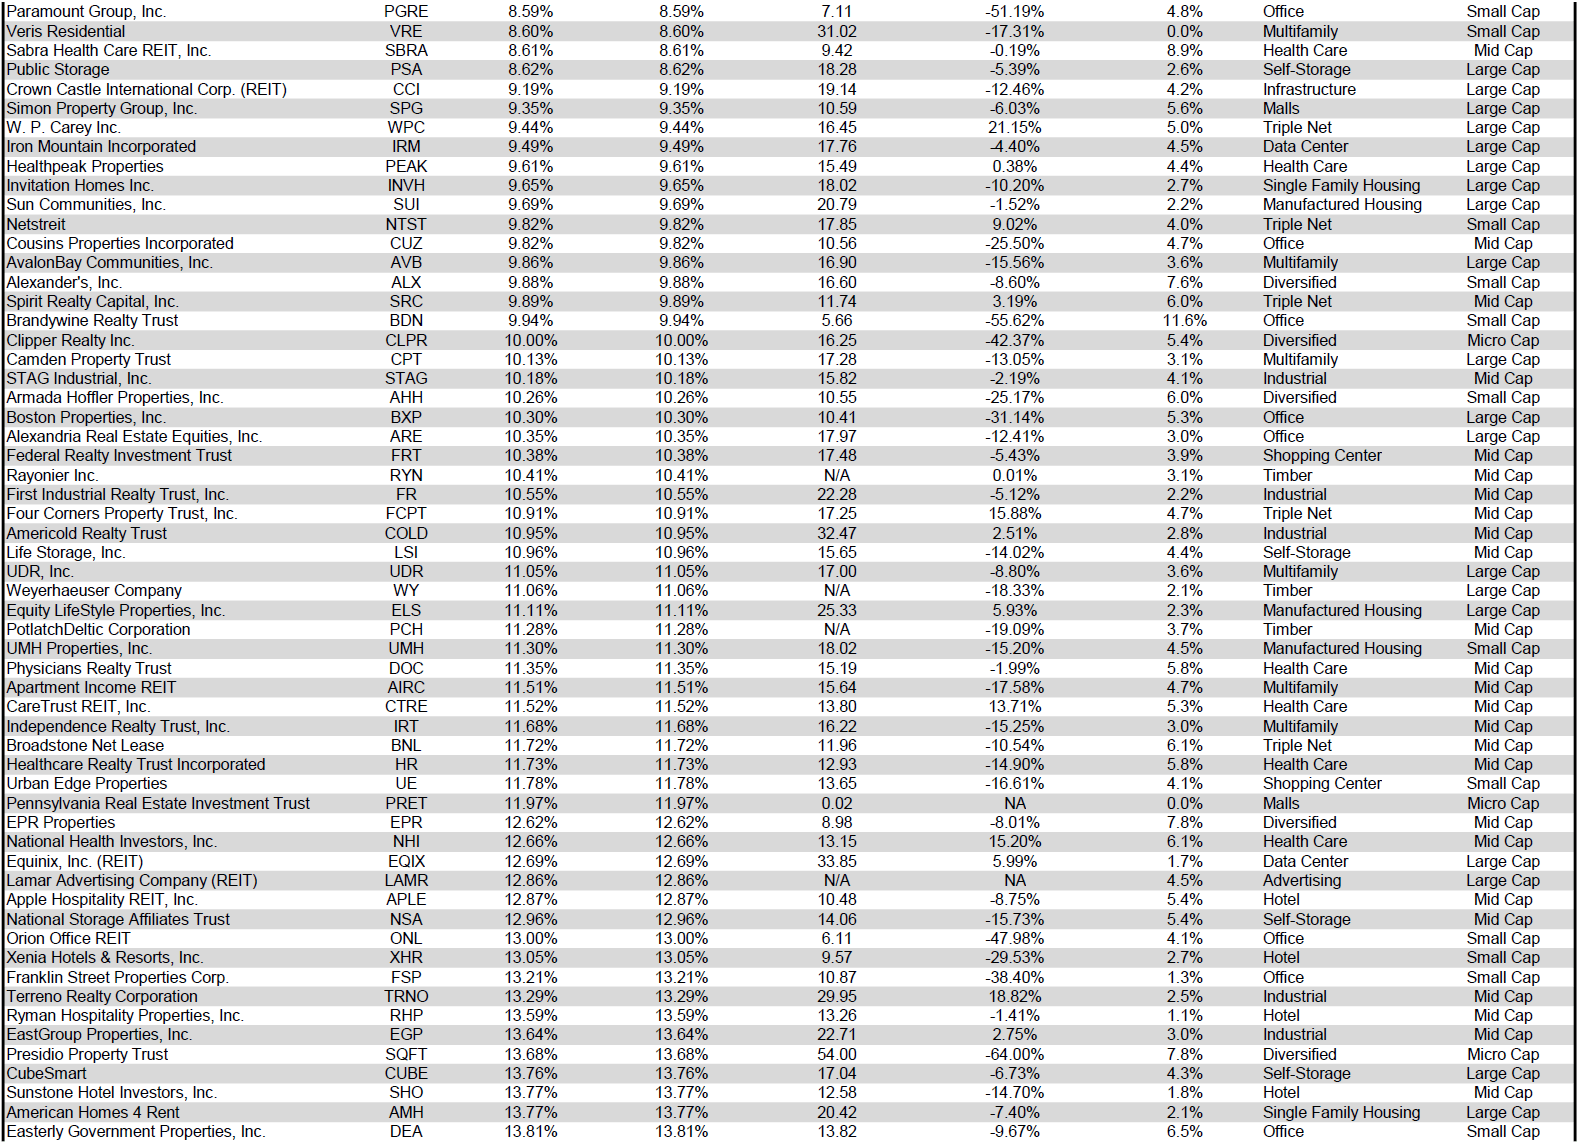
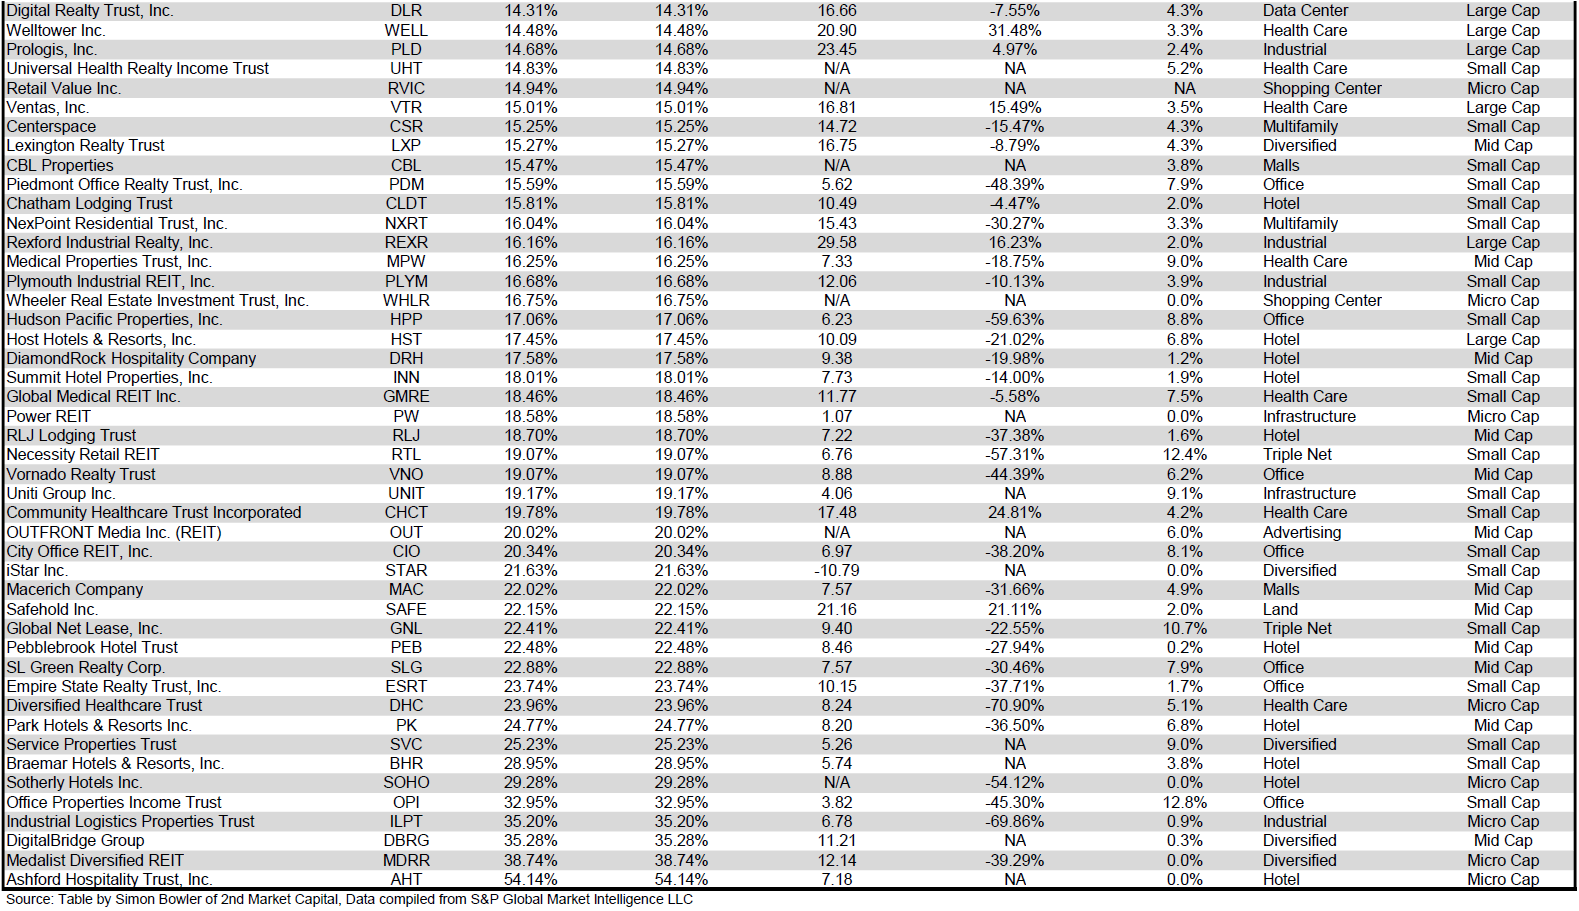
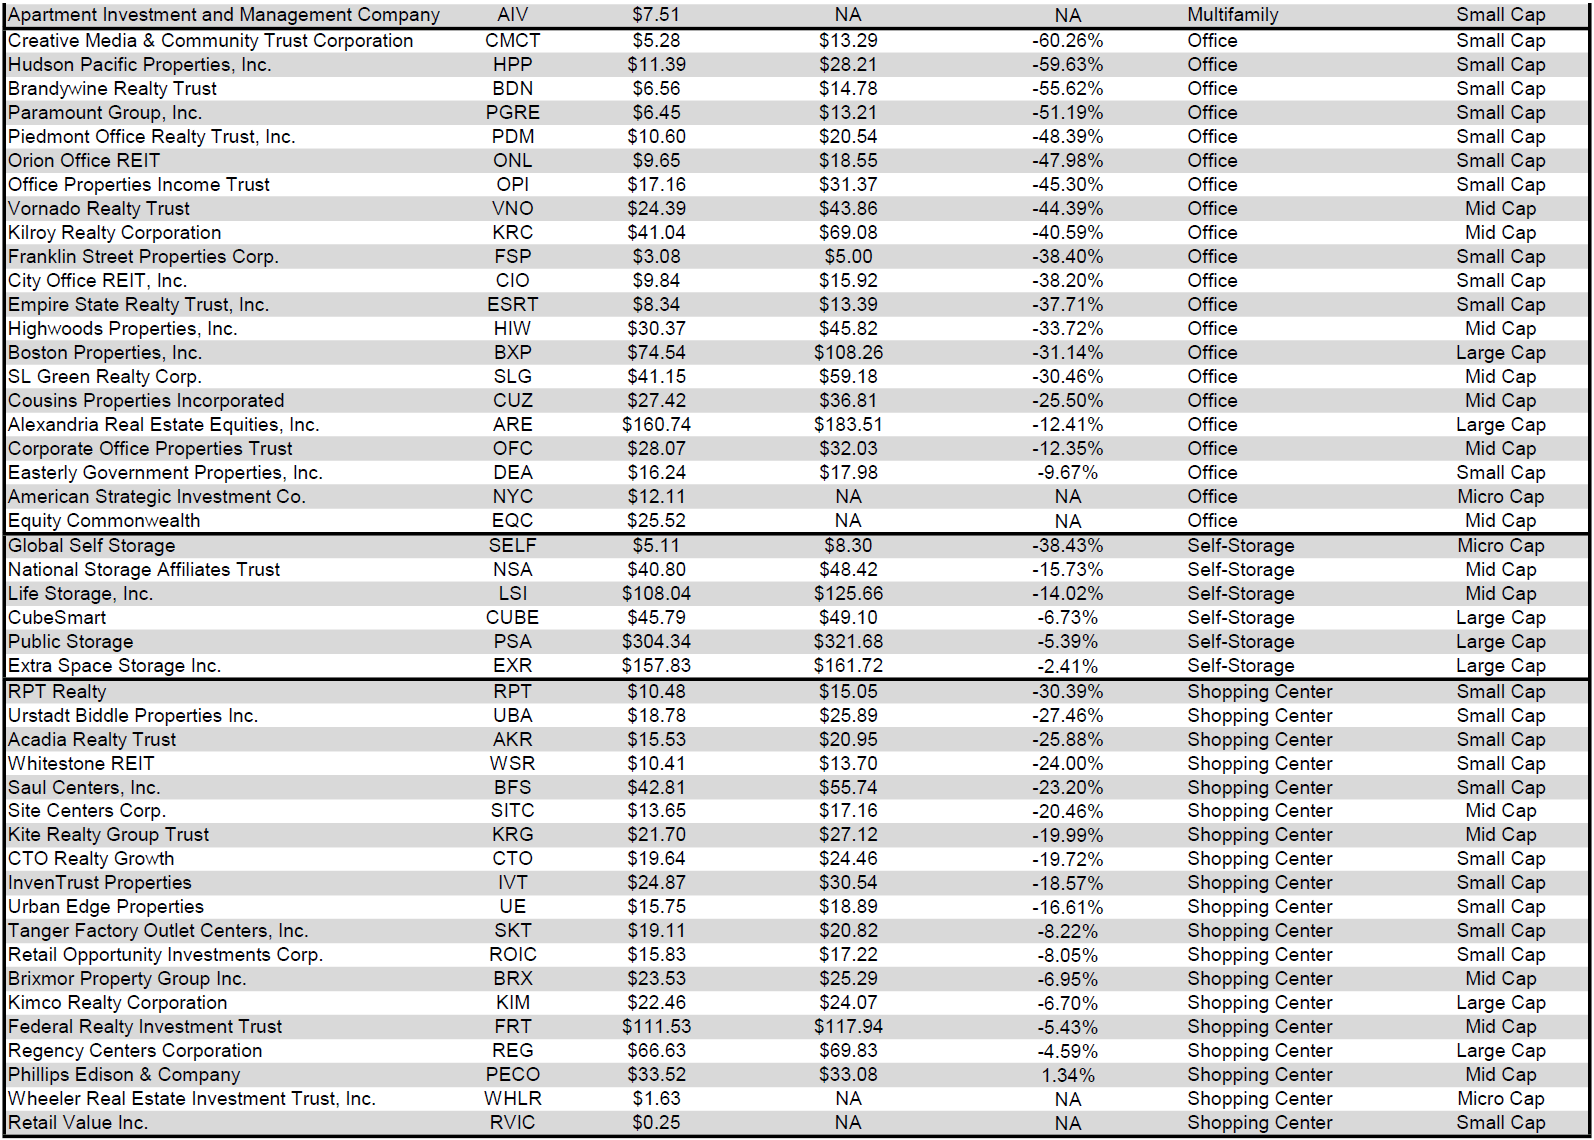
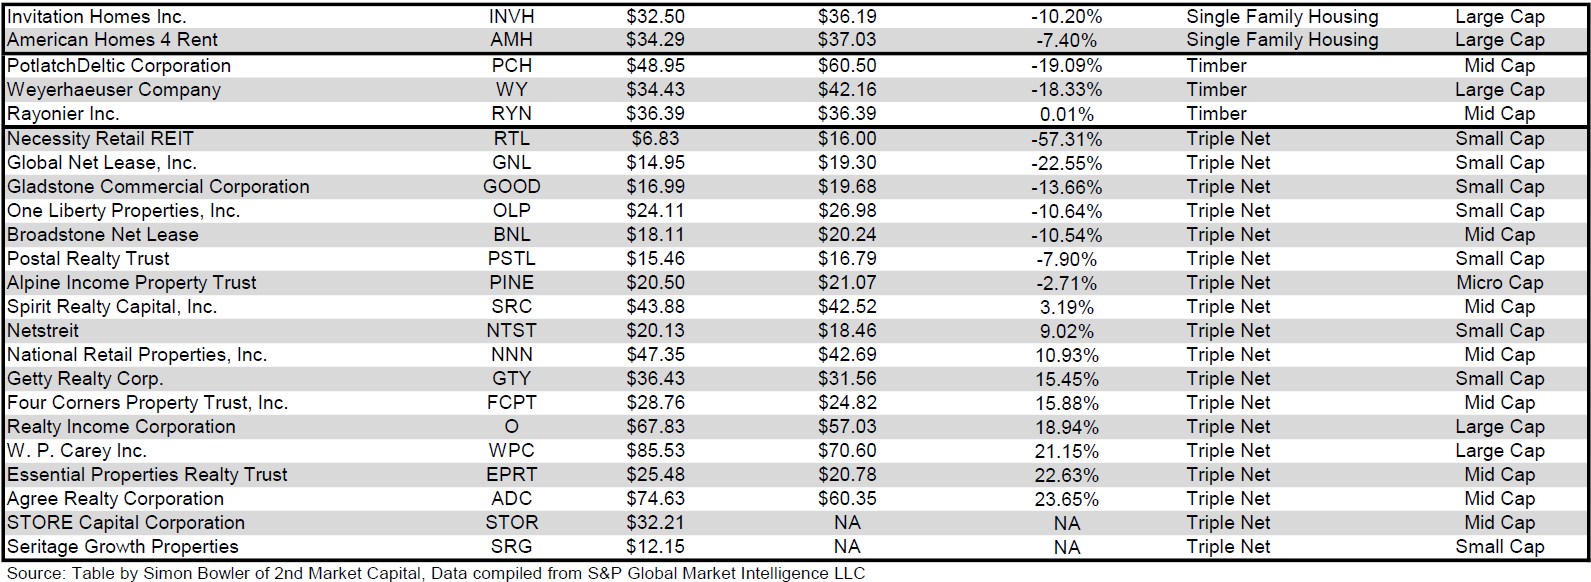
Performance of Individual Securities
Ashford Hospitality Trust (AHT) (+54.14%) partially bounced back from a brutal 2022 (-53.44%), but remains well below where they ended 2021. 2022’s very negative total return was by no means an anomaly, however, as AHT has consistently generated deeply negative returns. In fact, 2022’s -53.44% return was actually less terrible than either 2021 (-62.93%) or 2020 (-90.72%).
New York City REIT (NYC) (-14.48%) completed a 1-for-8 reverse stock split on January 12th and terminated its REIT status effective from January 1st, 2023. On January 20th, the company began trading under the name American Strategic Investment Co. while retaining the NYC ticker symbol.
96.91% of REITs had a positive total return in the first month of 2023. In January 2022, the average REIT had a -5.66% return, whereas in January 2023 the average REIT had a stellar +11.77% total return.
Source: Table by Simon Bowler of 2nd Market Capital, Data compiled from S&P Global Market Intelligence LLC. See important notes and disclosures at the end of this article Source: Table by Simon Bowler of 2nd Market Capital, Data compiled from S&P Global Market Intelligence LLC. See important notes and disclosures at the end of this article Source: Table by Simon Bowler of 2nd Market Capital, Data compiled from S&P Global Market Intelligence LLC. See important notes and disclosures at the end of this article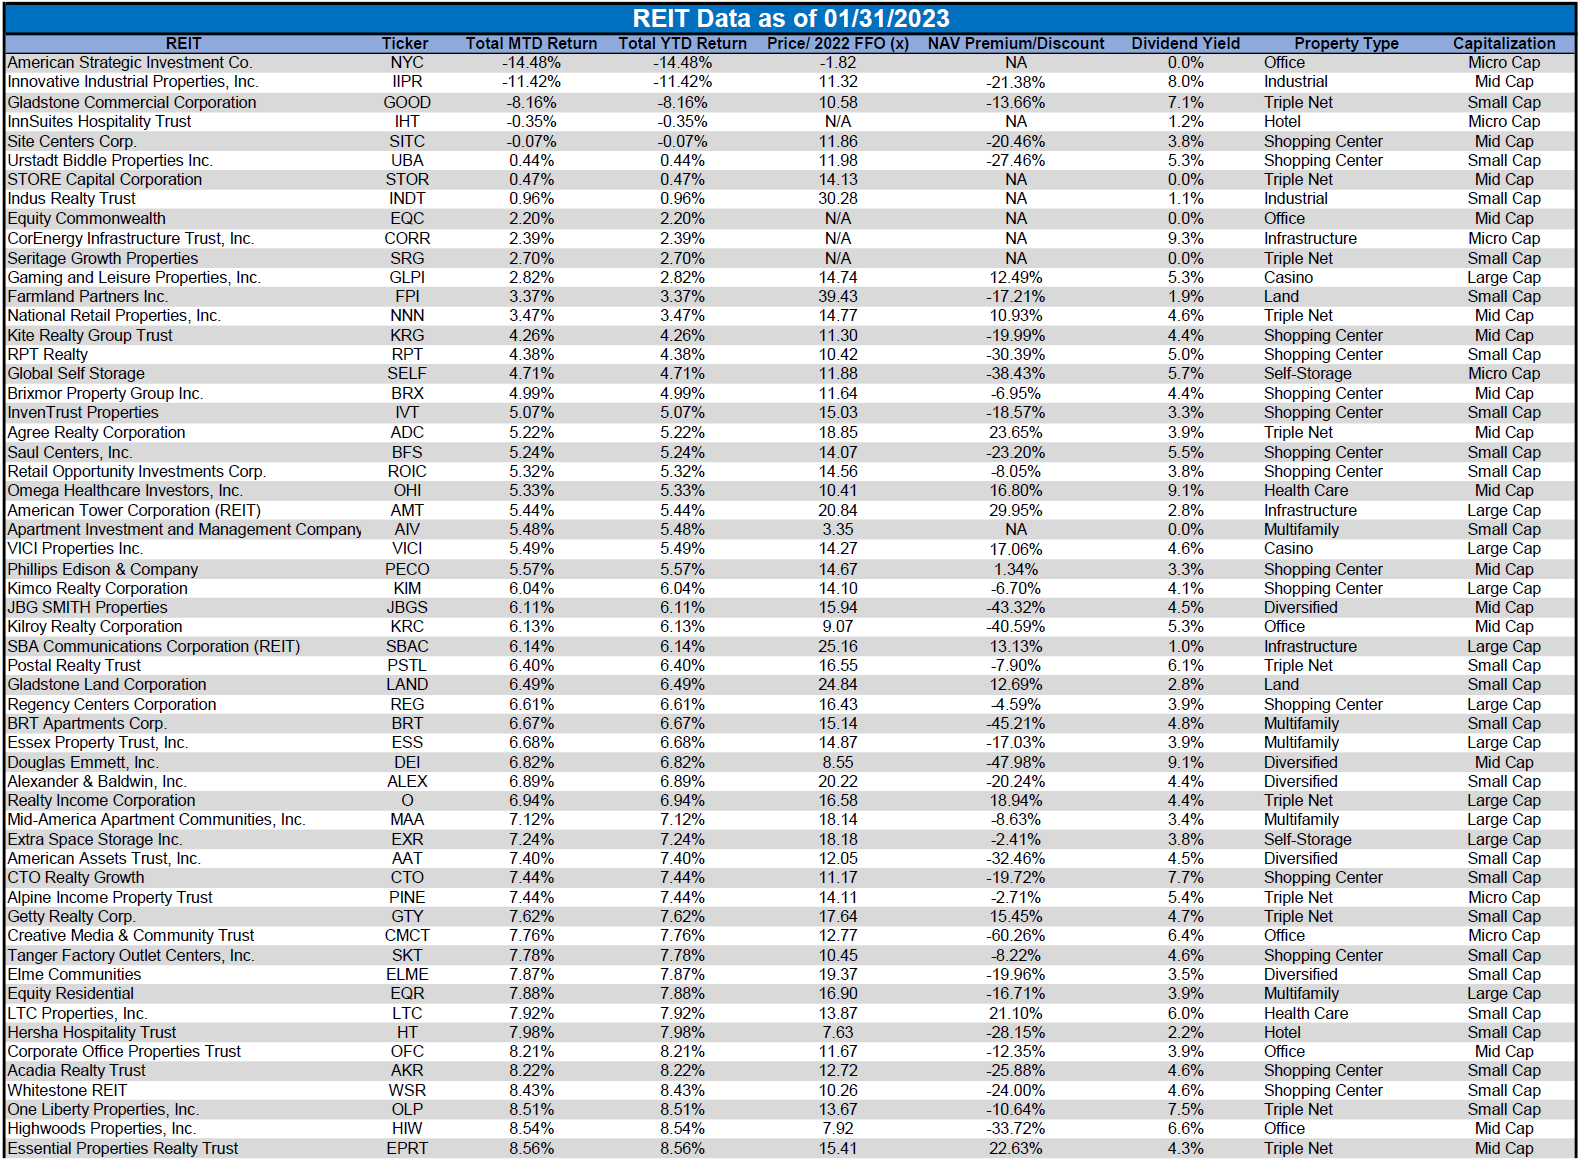
For the convenience of reading this table in a larger font, the table above is available as a PDF as well.
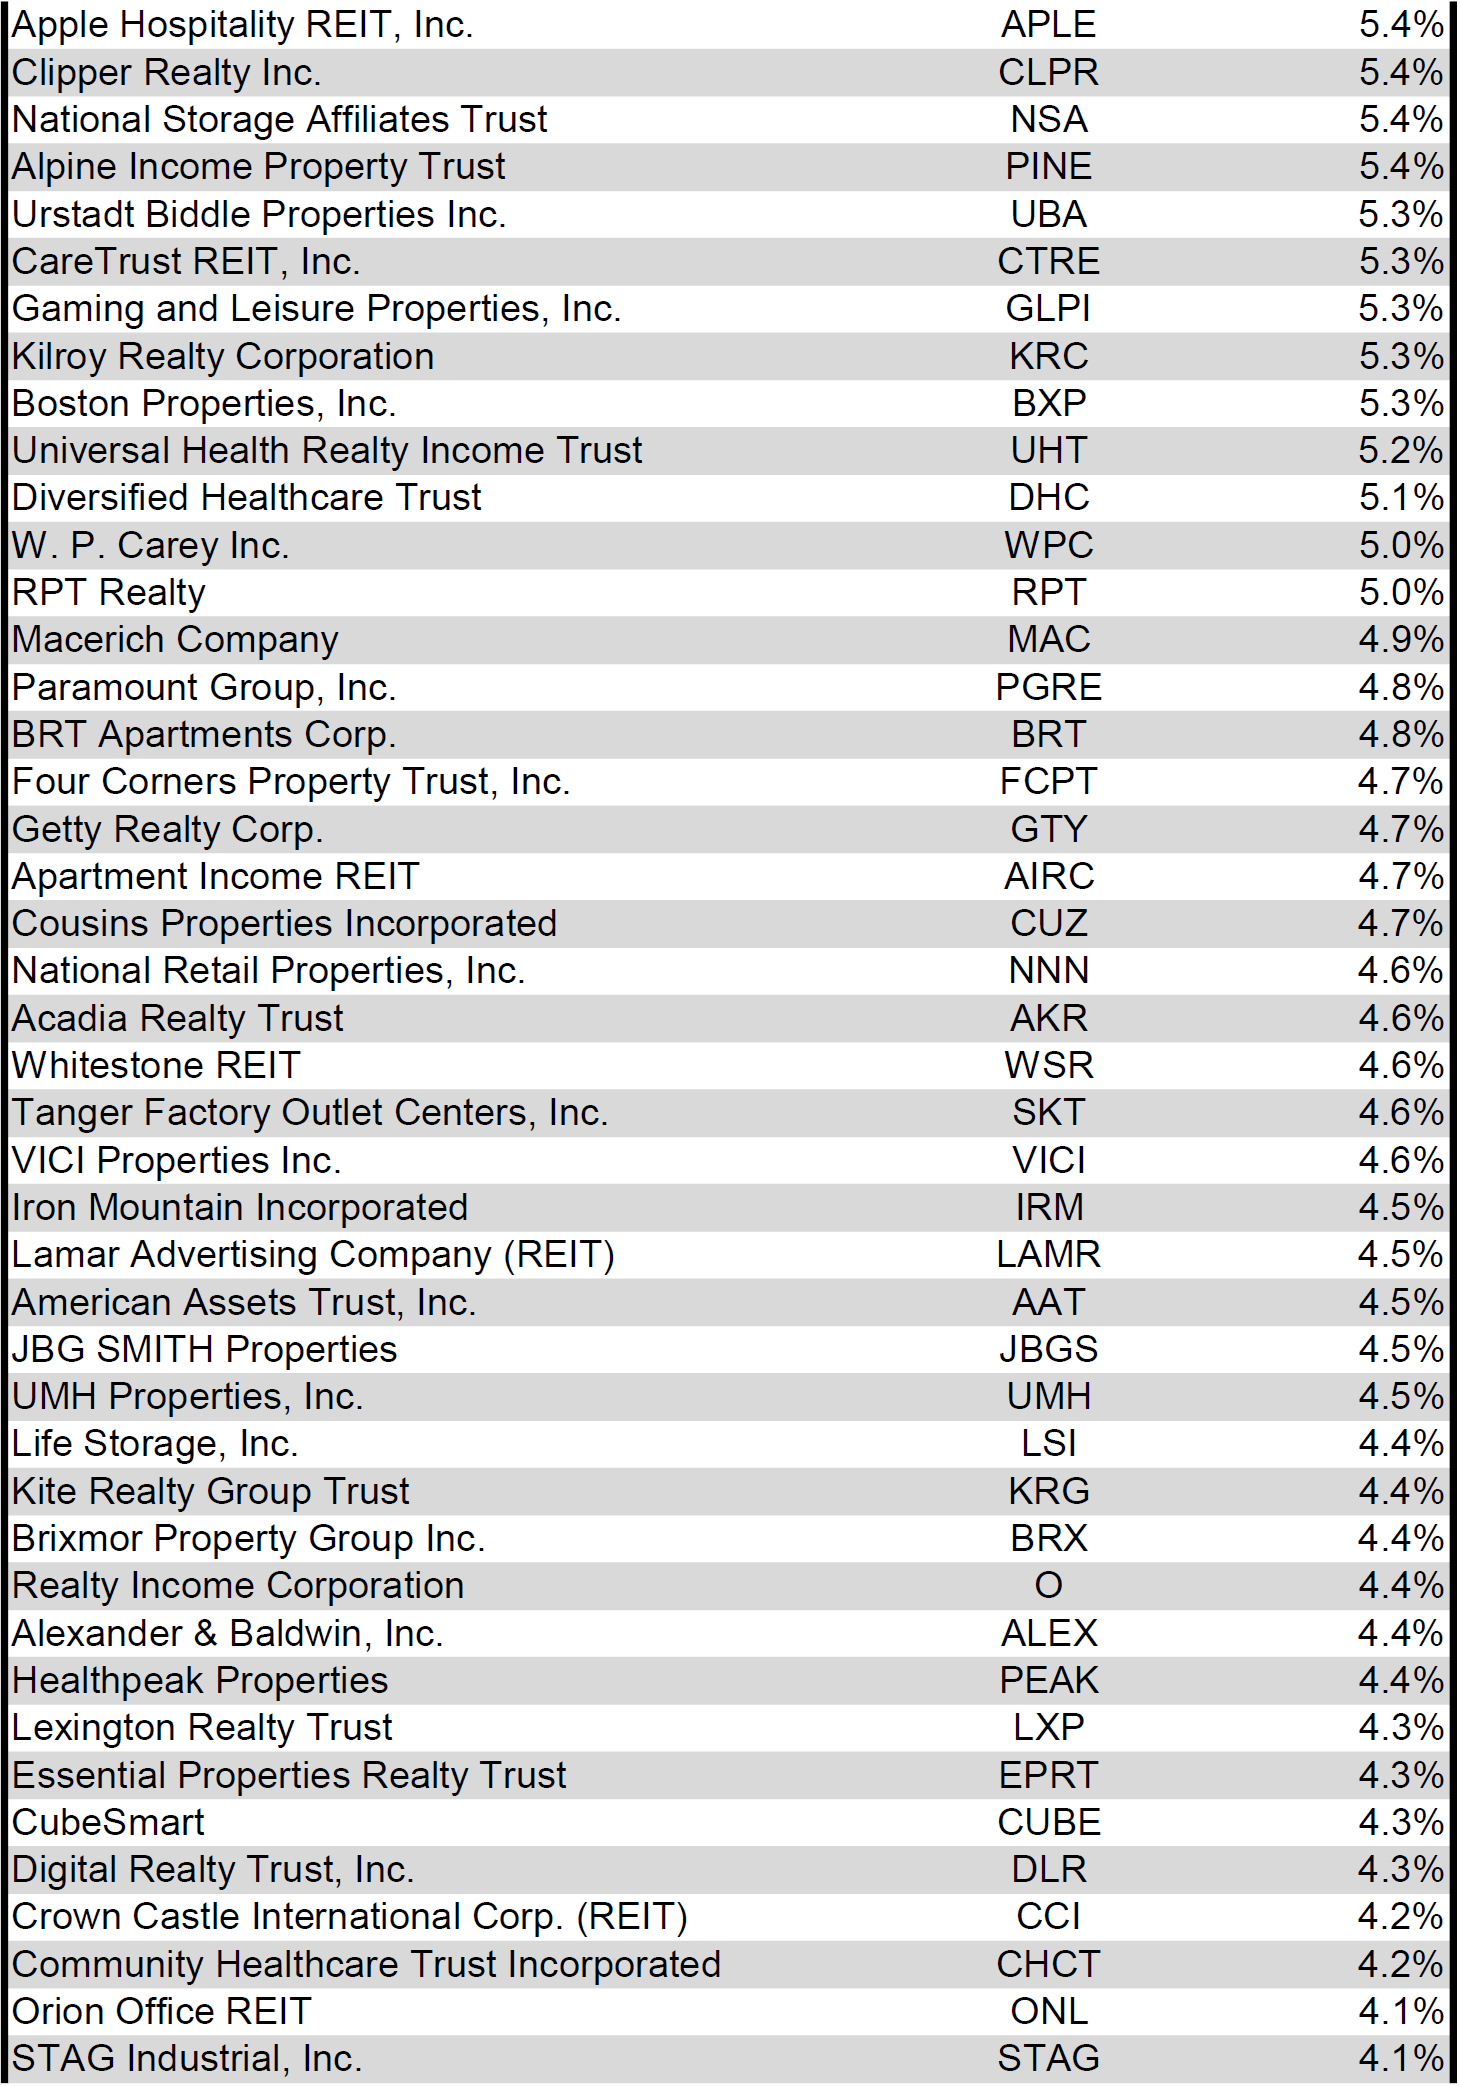
Dividend Yield
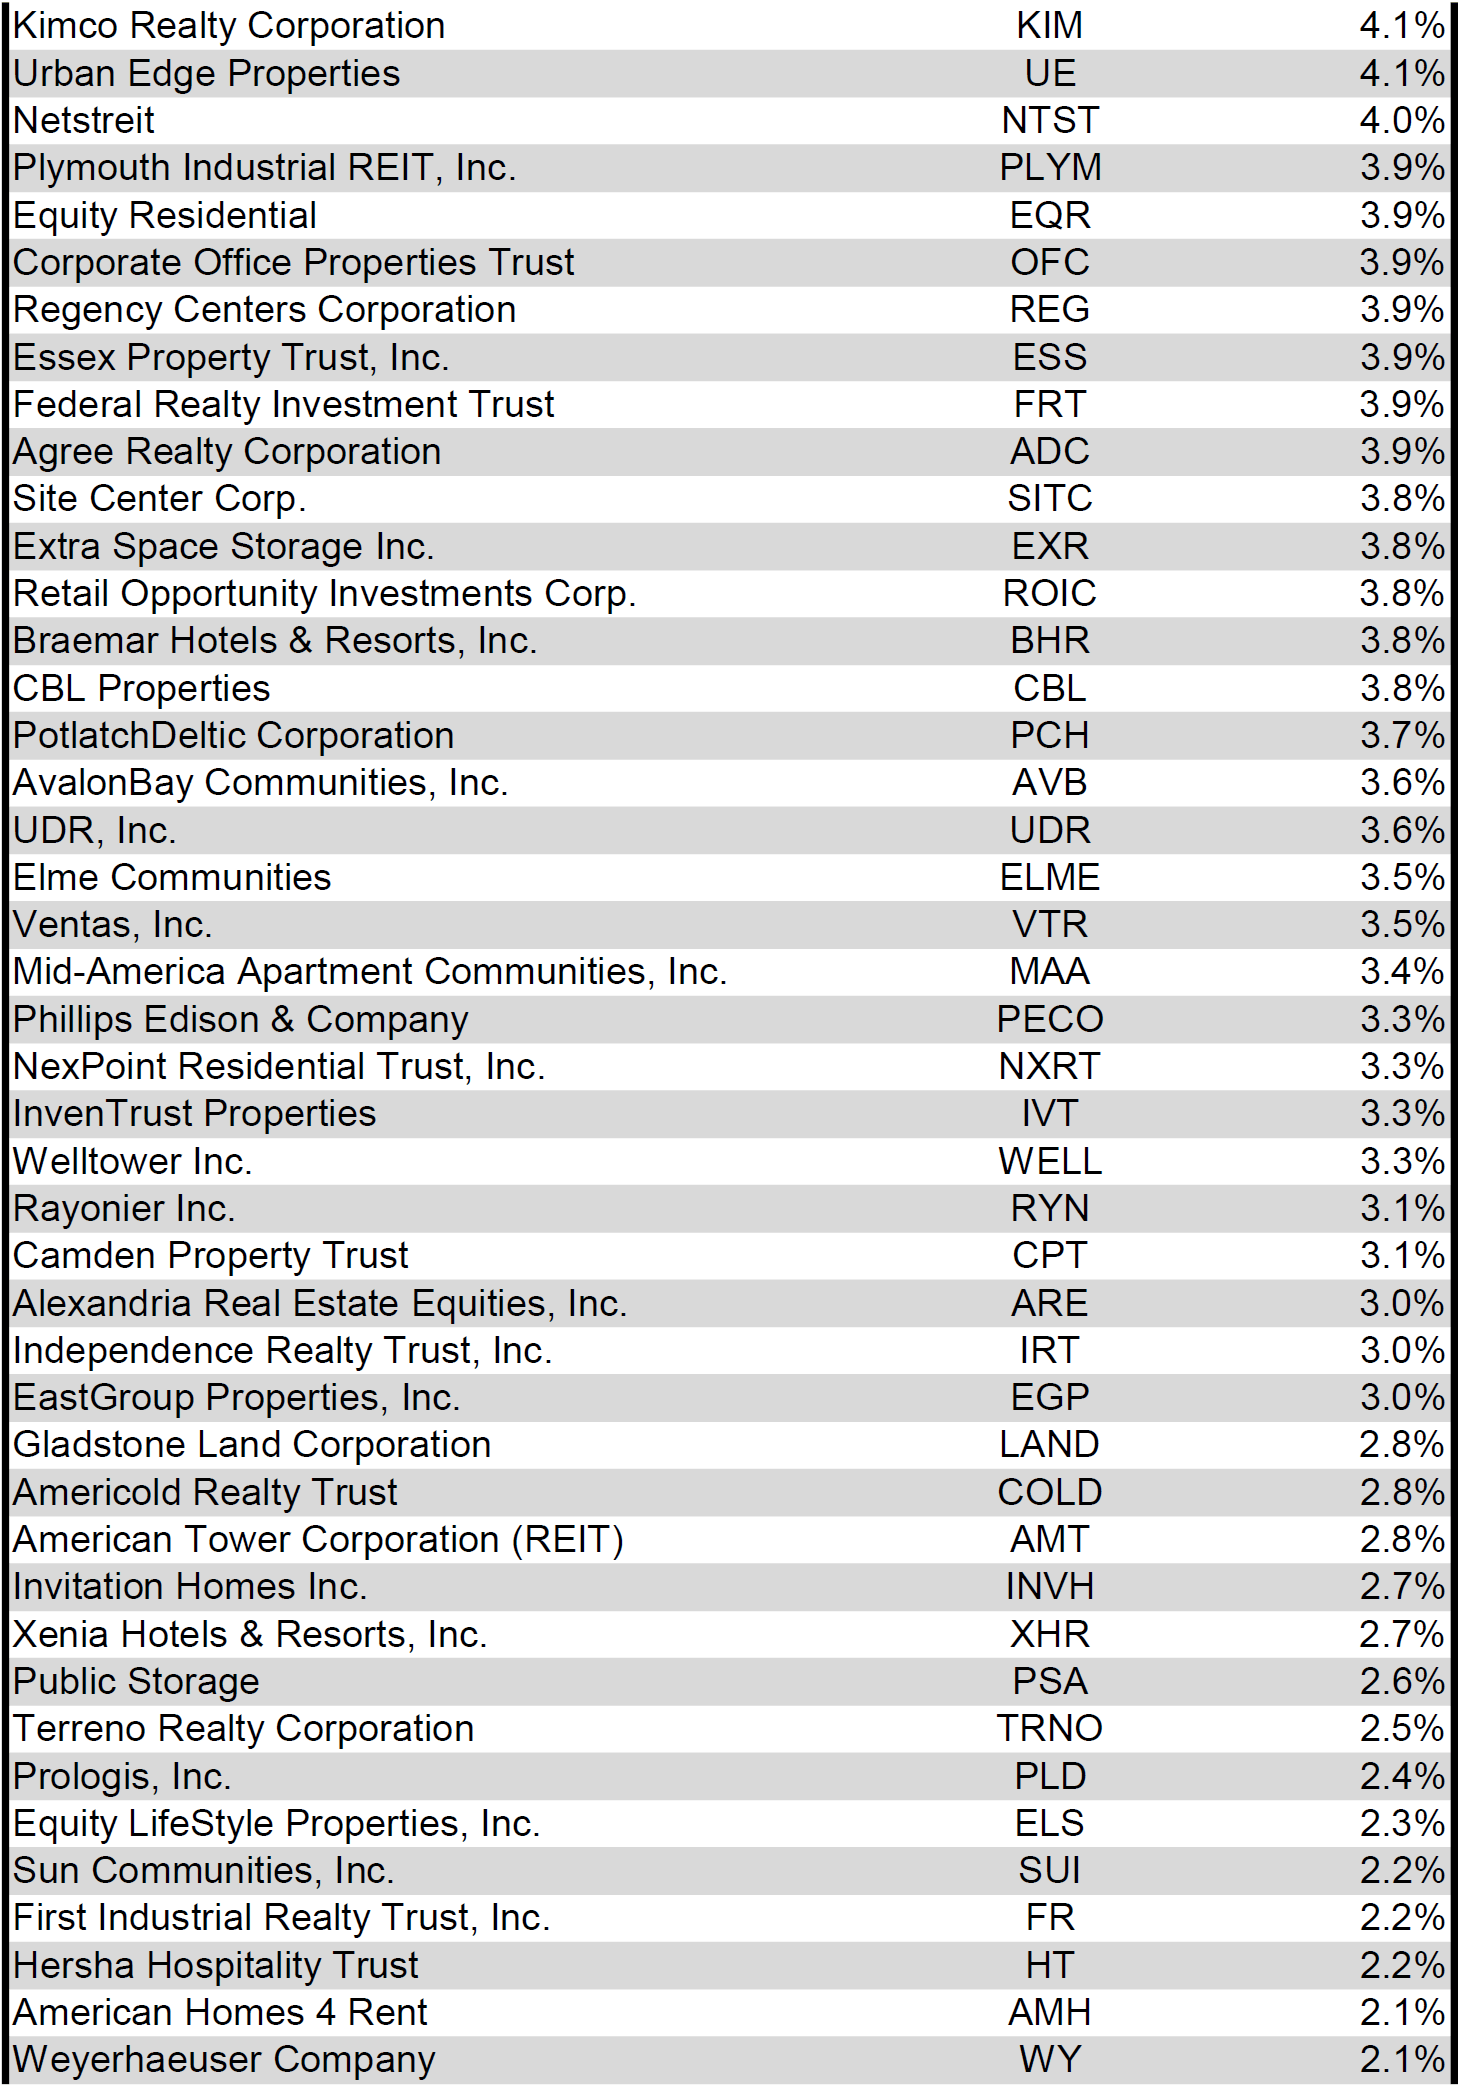
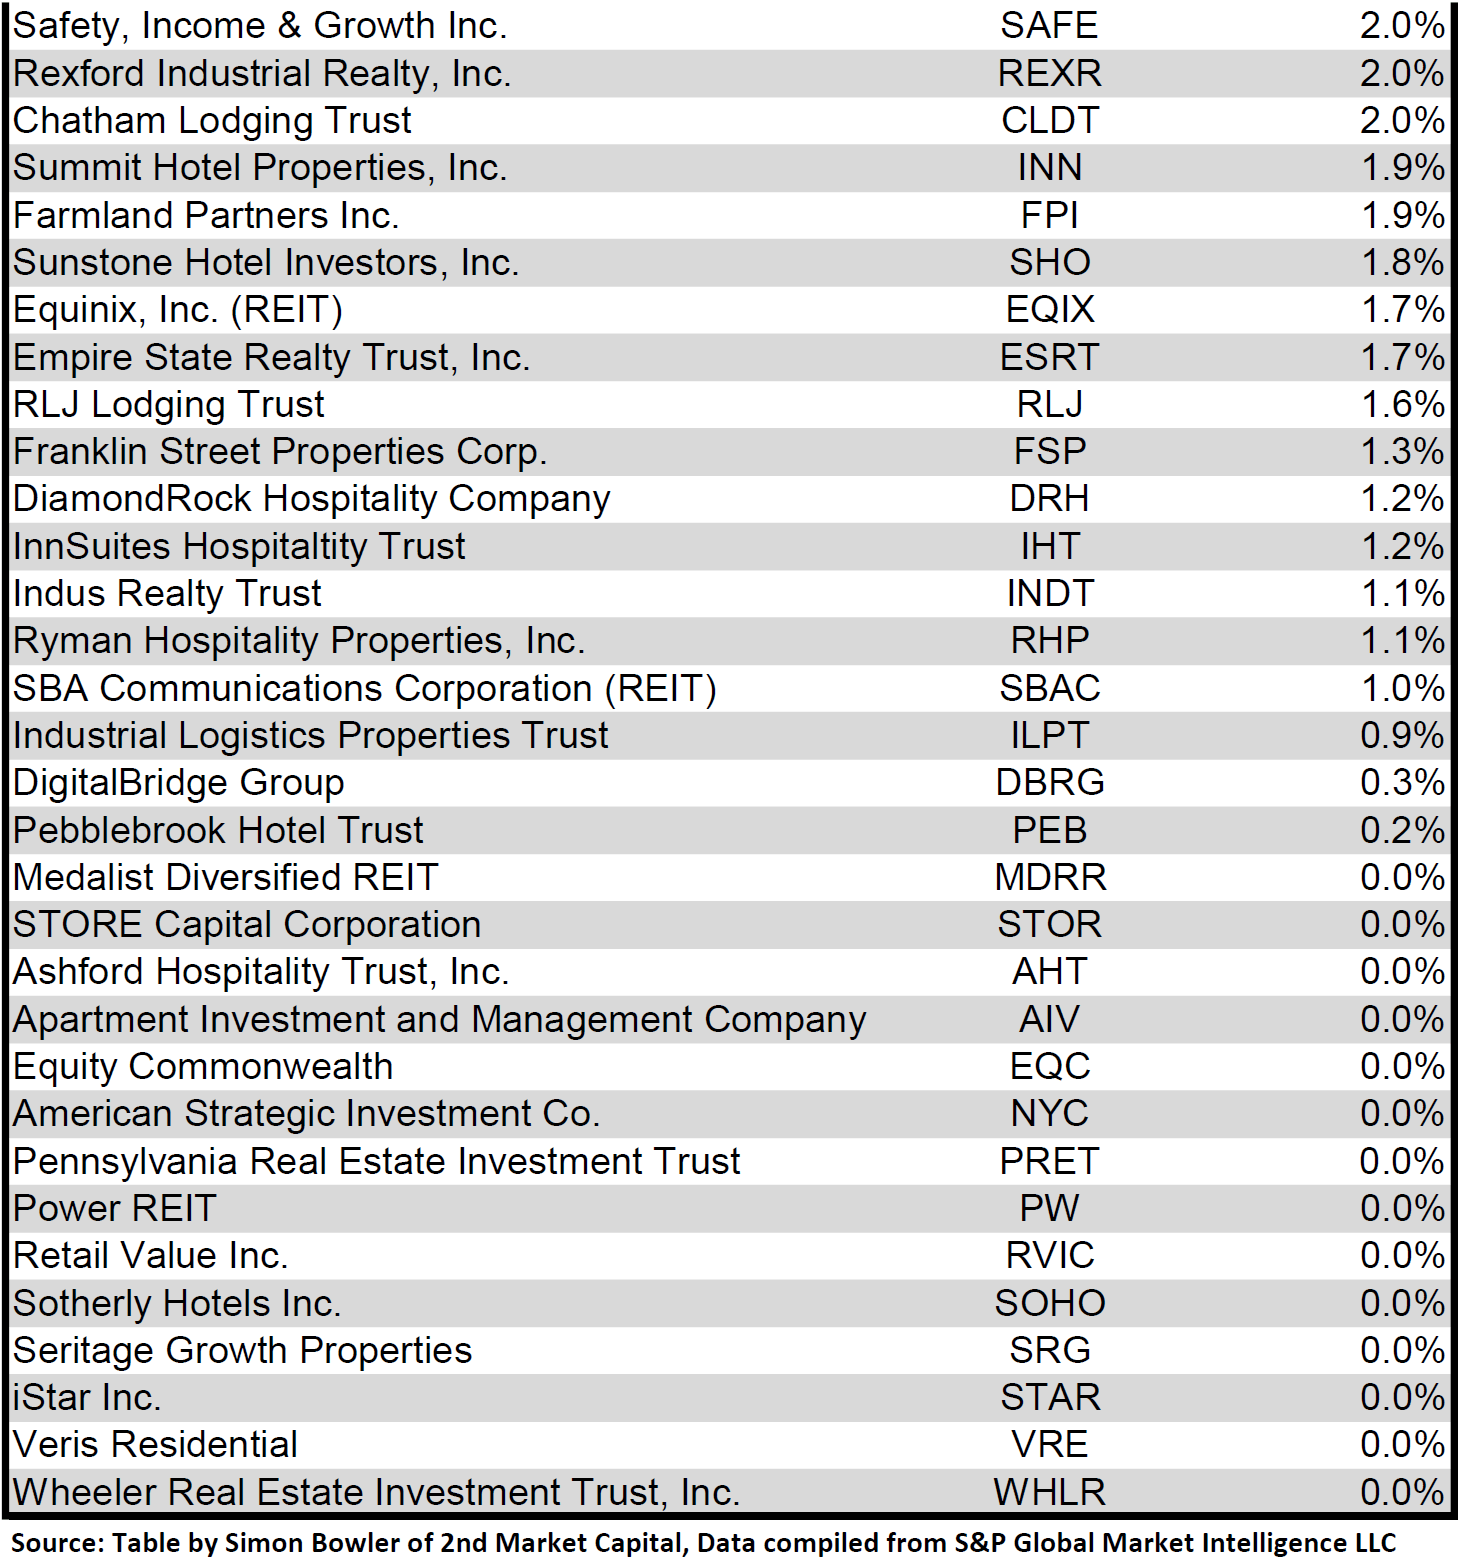
Dividend yield is an important component of a REIT's total return. The particularly high dividend yields of the REIT sector are, for many investors, the primary reason for investment in this sector. As many REITs are currently trading at share prices well below their NAV, yields are currently quite high for many REITs within the sector. Although a particularly high yield for an REIT may sometimes reflect a disproportionately high risk, there exist opportunities in some cases to capitalize on dividend yields that are sufficiently attractive to justify the underlying risks of the investment. I have included below a table ranking equity REITs from highest dividend yield (as of 01/31/2023) to lowest dividend yield.
Source: Table by Simon Bowler of 2nd Market Capital, Data compiled from S&P Global Market Intelligence LLC. See important notes and disclosures at the end of this article Source: Table by Simon Bowler of 2nd Market Capital, Data compiled from S&P Global Market Intelligence LLC. See important notes and disclosures at the end of this article Source: Table by Simon Bowler of 2nd Market Capital, Data compiled from S&P Global Market Intelligence LLC. See important notes and disclosures at the end of this article Source: Table by Simon Bowler of 2nd Market Capital, Data compiled from S&P Global Market Intelligence LLC. See important notes and disclosures at the end of this article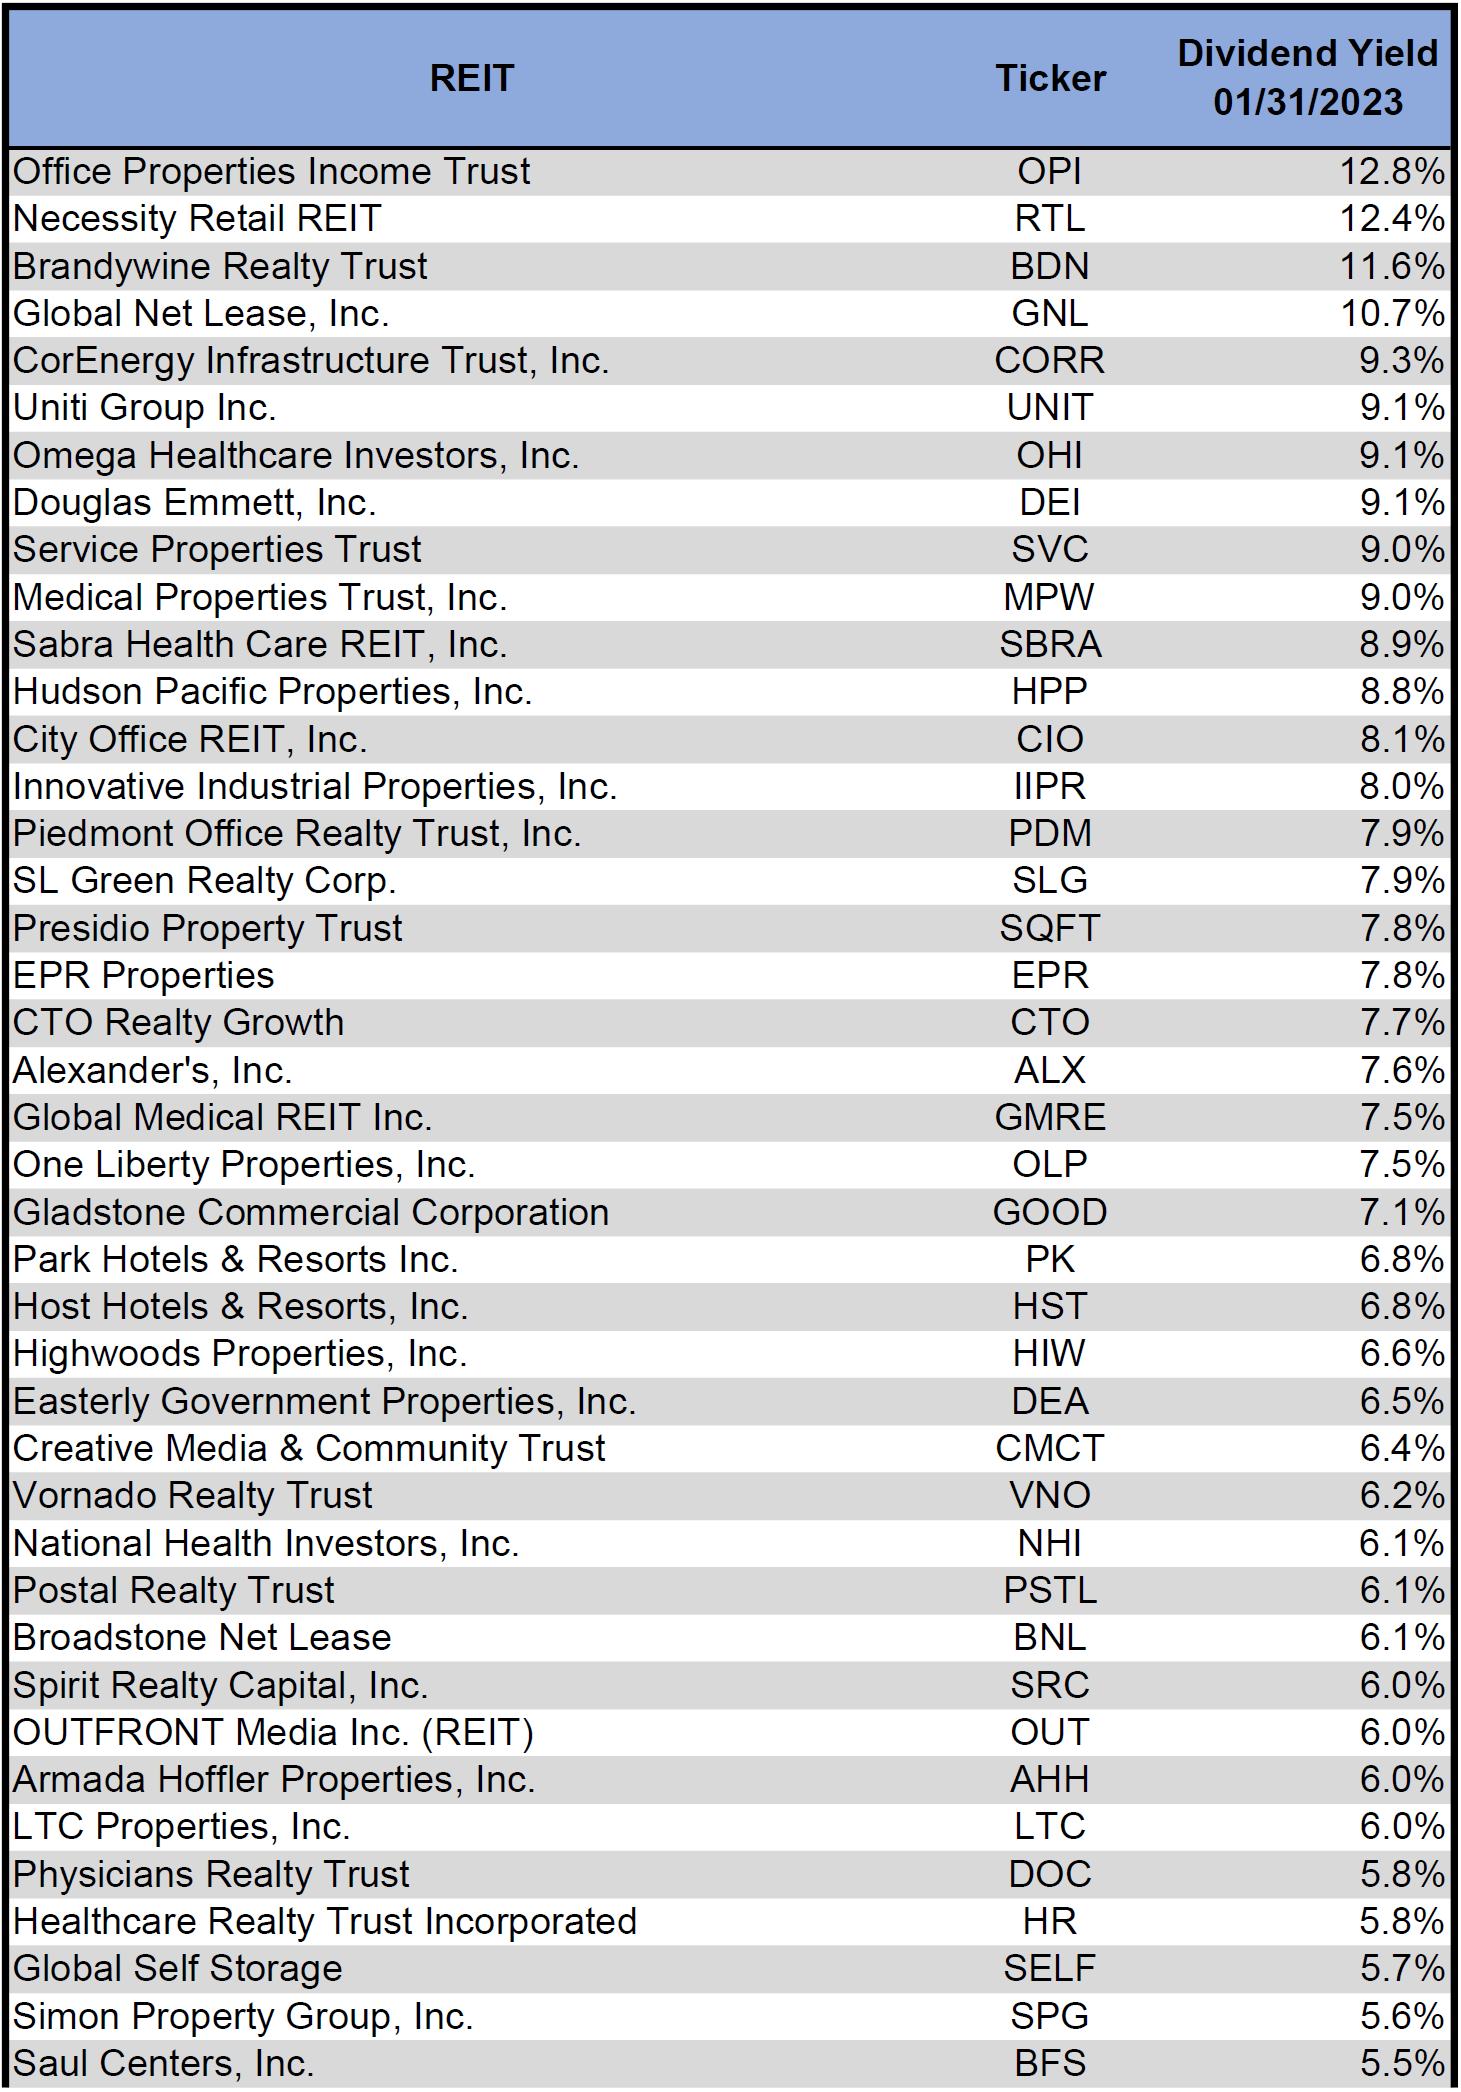
For the convenience of reading this table in a larger font, the table above is available as a PDF as well.
Although a REIT’s decision regarding whether to pay a quarterly dividend or a monthly dividend does not reflect on the quality of the company’s fundamentals or operations, a monthly dividend allows for a smoother cash flow to the investor. Below is a list of equity REITs that pay monthly dividends ranked from highest yield to lowest yield.
Source: Table by Simon Bowler of 2nd Market Capital, Data compiled from S&P Global Market Intelligence LLC. See important notes and disclosures at the end of this article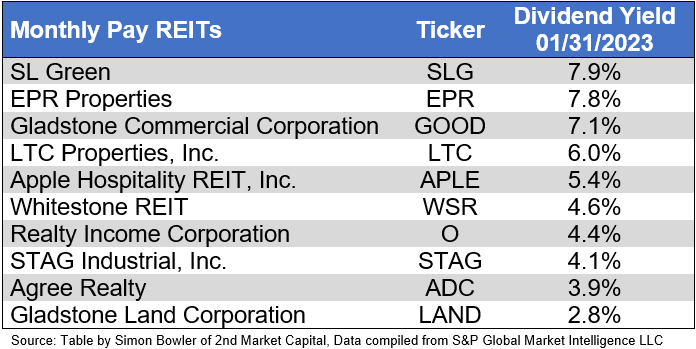
Valuation
REIT Premium/Discount to NAV by Property Type
Below is a downloadable data table, which ranks REITs within each property type from the largest discount to the largest premium to NAV. The consensus NAV used for this table is the average of analyst NAV estimates for each REIT. Both the NAV and the share price will change over time, so I will continue to include this table in upcoming issues of The State of REITs with updated consensus NAV estimates for each REIT for which such an estimate is available.
Source: Table by Simon Bowler of 2nd Market Capital, Data compiled from S&P Global Market Intelligence LLC. See important notes and disclosures at the end of this article Source: Table by Simon Bowler of 2nd Market Capital, Data compiled from S&P Global Market Intelligence LLC. See important notes and disclosures at the end of this article Source: Table by Simon Bowler of 2nd Market Capital, Data compiled from S&P Global Market Intelligence LLC. See important notes and disclosures at the end of this article Source: Table by Simon Bowler of 2nd Market Capital, Data compiled from S&P Global Market Intelligence LLC. See important notes and disclosures at the end of this article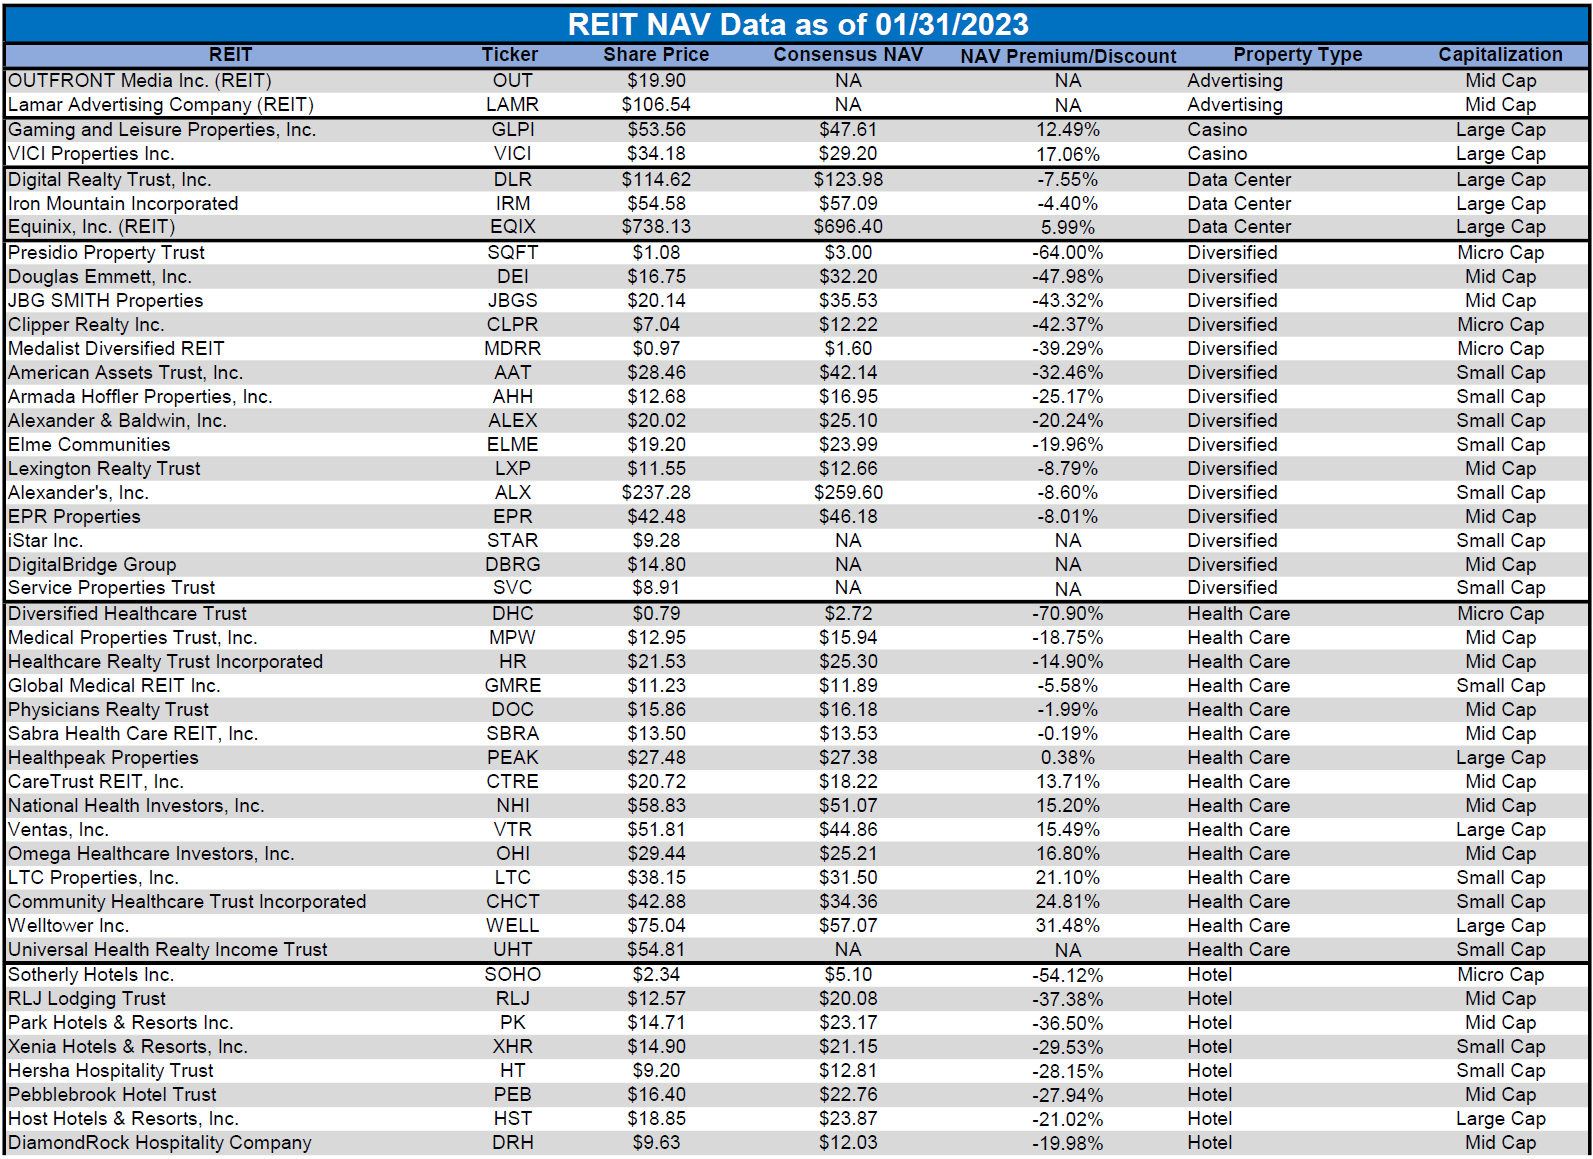
For the convenience of reading this table in a larger font, the table above is available as a PDF as well.
Takeaway
The large cap REIT premium (relative to small cap REITs) narrowed slightly in January and investors are now paying on average about 47% more for each dollar of 2023 FFO/share to buy large cap REITs than small cap REITs (18.2x/12.4x - 1 = 46.8%). As can be seen in the table below, there is presently a strong positive correlation between market cap and FFO multiple.
Source: Table by Simon Bowler of 2nd Market Capital, Data compiled from S&P Global Market Intelligence LLC. See important notes and disclosures at the end of this article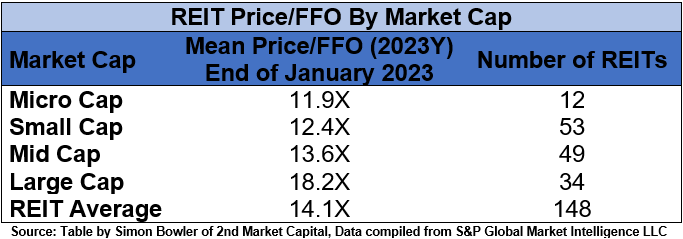
The table below shows the average premium/discount of REITs of each market cap bucket. This data, much like the data for price/FFO, shows a strong, positive correlation between market cap and Price/NAV. The average large cap REIT (-1.28%) trades just slightly below NAV, while mid cap REITs (-10.50%) trade at a low double-digit discount to NAV. Small cap REITs (-21.32%) trade at about 4/5 of NAV. Micro caps on average trade at just over half of their respective NAVs (-49.10%).
Source: Table by Simon Bowler of 2nd Market Capital, Data compiled from S&P Global Market Intelligence LLC. See important notes and disclosures at the end of this article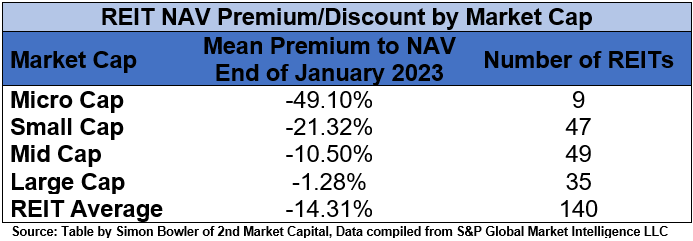
As can been seen in data from S&P Global Market Intelligence, 2021 and 2022 had remarkably few bankruptcies compared to recent years. However, 2023 is off to a rough start with nearly twice as many bankruptcies in January 2023 as there were in January 2022. With the cost of capital sharply increasing over the past year and expected to continue increasing during 2023, companies are increasingly often forced to refinance maturing loans at higher rates. Companies that utilize floating rate debt have been immediately feeling the impact of each Fed rate hike. Rising debt costs puts further strain on struggling companies, which can push some into bankruptcy.
S&P Global Market Intelligence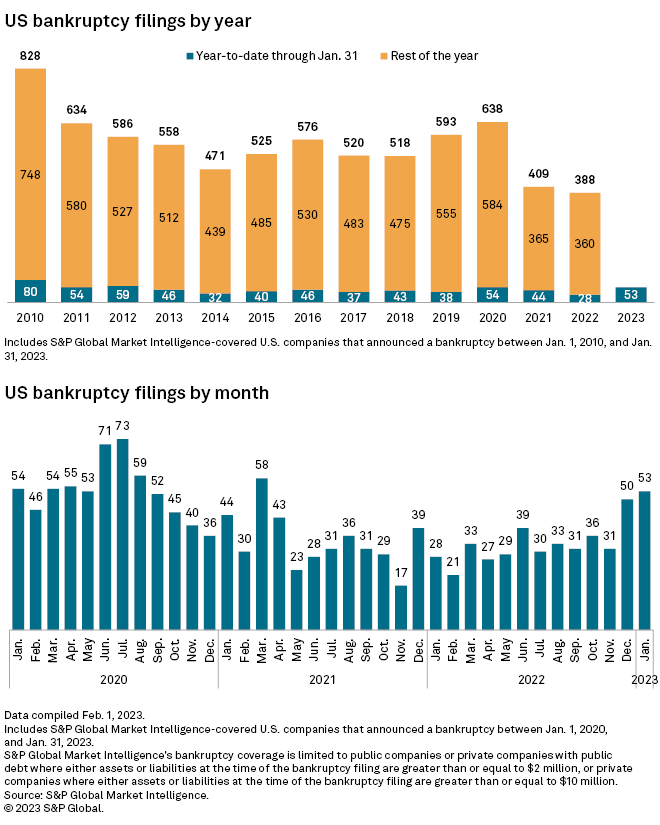
Retail bankruptcies matched this trend, with fewer US retail bankruptcies in 2022 than any other recent year. However, we have already seen nearly 30% of the retail bankruptcies of 2022 in just the first month and a half of 2023.
S&P Global Market Intelligence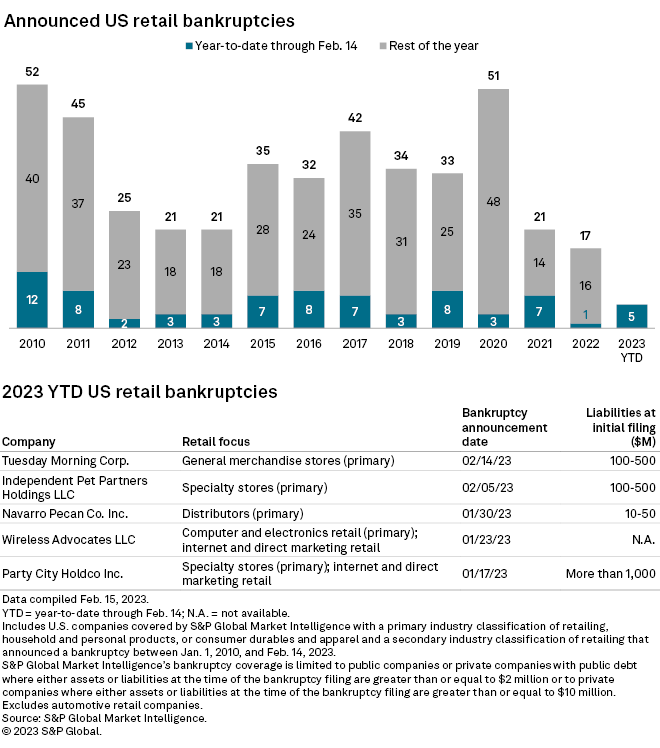
However, retail bankruptcy is not the only risk to retail landlords. Even retail tenants that are not in bankruptcy sometimes close underperforming stores as part of cost-cutting measures to improve profitability. For example, Bed Bath & Beyond (BBBY) has announced plans to close more than a hundred stores, 28 of which are in properties owned by REITs.
S&P Global Market Intelligence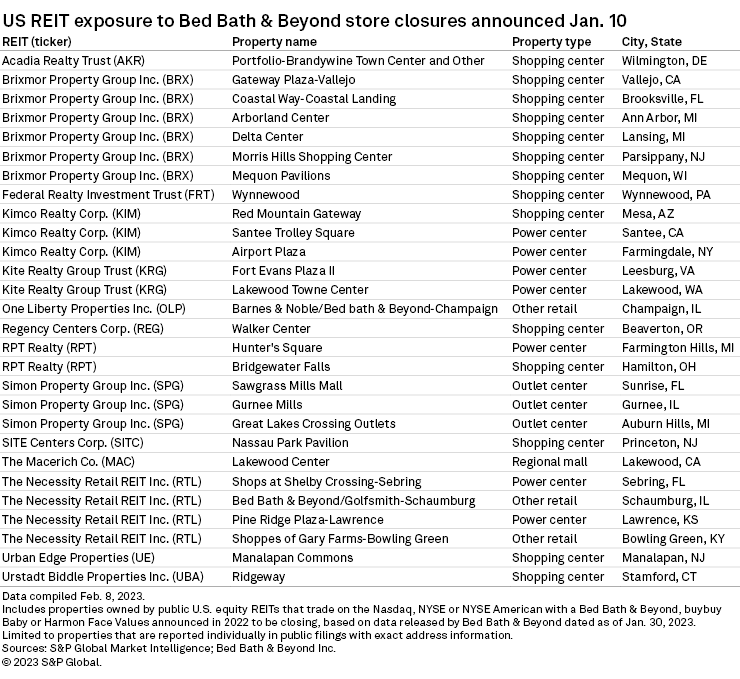
Since store closures can cause rental income disruption to landlords, any time a retailer announces store closures it is important to see which REITs are impacted and to what degree. This involves not only determining how many of the announced store closures impact each REIT, but also the total exposure each REIT has to a struggling tenant. The reason total exposure is important is because further store closures may be announced that could cause further impact to an REIT. For example, Acadia Realty Trust (AKR) only had 1 store included in the January 10th BBBY store closure announcement, but Acadia’s portfolio has more tenant exposure to BBBY than any other REIT as a percentage of annual base rent (2.7%) or percentage of area leased (3.3%).
S&P Global Market Intelligence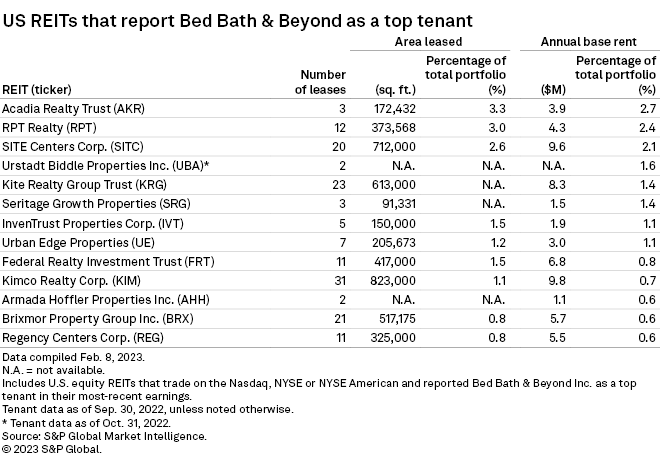
REITs do not generally provide a complete list of all tenants, but rather will typically provide a list of their top tenants and/or a breakdown of which industries their tenants are in. This is traditionally the case for Retail, Triple Net, Office, and Industrial REITs. A REIT with little to no exposure to weak tenants is far less likely to face rental income disruption, so investors would be wise to ensure they understand a REIT’s tenant mix and quality prior to investing.
Editor's Note: This article covers one or more microcap stocks. Please be aware of the risks associated with these stocks.
Dividends are scarce, we provide the solution

For everything you need to build a growing stream of dividend income, please consider joining Portfolio Income Solutions. As a member you will get:
- Access to a curated Real Money REIT Portfolio
- Continuous market and single stock analysis
- Data sets on every REIT
You will benefit from our team’s decades of collective experience in REIT investing. On Portfolio Income Solutions, we don’t only share our ideas, we also discuss best trading practices and help you become a better investor.