
I've been swamped with documents to read
sturti
Get ready for charts, images, and tables because they are better than words. The ratings and outlooks we highlight here come after Scott Kennedy’s weekly updates in the REIT Forum. Your continued feedback is greatly appreciated, so please leave a comment with suggestions.
PennyMac Mortgage Trust (PMT) created a ton of work over the last week. Their announcement that “fixed-to-floating” would mean “fixed-to-still-fixed-at-the-same-rate” for PMT-A and PMT-B meant all fixed-to-floating shares needed to be re-examined.
It was a brutal stretch that required:
- An update Friday night for PMT preferred shares. Many hours digging through the legal documents, not just regurgitating the press release (not useful).
- Another update Sunday night for the sector. That covered the language in each prospectus.
- Another update Tuesday night to preview my conclusions on several shares (so investors would have the conclusions faster).
- Another update Wednesday during market hours to provide the evidence and reasoning for the conclusions sent out Tuesday.
I’ve still got at least three projects on my plate for writing:
- Risk rating and target updates for the preferred shares. This includes recent developments (thanks PMT) as well as prior developments.
- The monthly portfolio update to highlight our current positions and potential opportunities.
- Projections for cell tower REITs over the coming years.
Immediately Preceding Dividend Period
I rarely post entire subscriber articles to the public side. The research is heavily related to what we do on the public side, but I’m not a fan of the “delayed release” model. I think people who pay deserve additional research, rather than just getting the same article a day or two early. That has some value, but it’s rarely been enough to convince me to open my wallet.
We’re going to share some of what we were working on though.
To evaluate the preferred shares, you need to evaluate the presence of various clauses in each prospectus. This is what I spent the weekend doing.
The most unattractive phrase is usually "immediately preceding dividend period." That’s the phrase we believe is creating this chaos. Some companies are trying to use it to refer to the prior fixed-rate dividend if the share is not already floating. That might not be a problem if the clause was clear. However, it often comes as part of a clause like this:
“If fewer than three New York, New York banks selected by us quote rates in the manner described above, the three-month LIBOR for the applicable dividend period will be the same as for the immediately preceding dividend period, or, if there was no such dividend period, the dividend shall be calculated at the dividend rate in effect for the immediately preceding dividend period.”
No Such Dividend Period
That creates a great deal of confusion with the term "no such dividend period."
It would appear to me, as someone who is not a lawyer, that the “final rule” implementing the LIBOR Act has part of that sentence. Specifically, it would void the requirement for polling, and it would void the use prior LIBOR. That leaves us with “or, if there was no such dividend period, the dividend shall be calculated at the dividend rate in effect for the immediately preceding dividend period.” Who determines what “such” means? That’s the real question. The dividend period must exist by definition since it is the time between two dates.
Are they going to strike out the clause "or, if there was no such dividend period?" The LIBOR Act doesn’t appear to provide any grounds for removing that clause.
If they can’t remove it, then reaching a fixed-rate dividend requires declaring that there was “no such dividend period." But we know every dividend period must exist. Since the dividend period is only a measurement of time, it must exist. If it refers to the prior words “immediately preceding dividend period,” then that is a period that also exists. Even if LIBOR doesn’t exist, the period did exist.
PMT needs to prove that “such” should be defined in a way that makes the period not exist.
Some Shares Providing Clarity
While this "immediately preceding dividend period” shows up in quite a few contracts, some REITs have already stated they will use SOFR.
For instance, NLY-F, AGNCN, IVR-B, and IVR-C have already stated explicitly that they will be using 3-month Term SOFR + 26.161 basis points. That is the industry-accepted substitute for 3-month LIBOR.
Some Common Shares
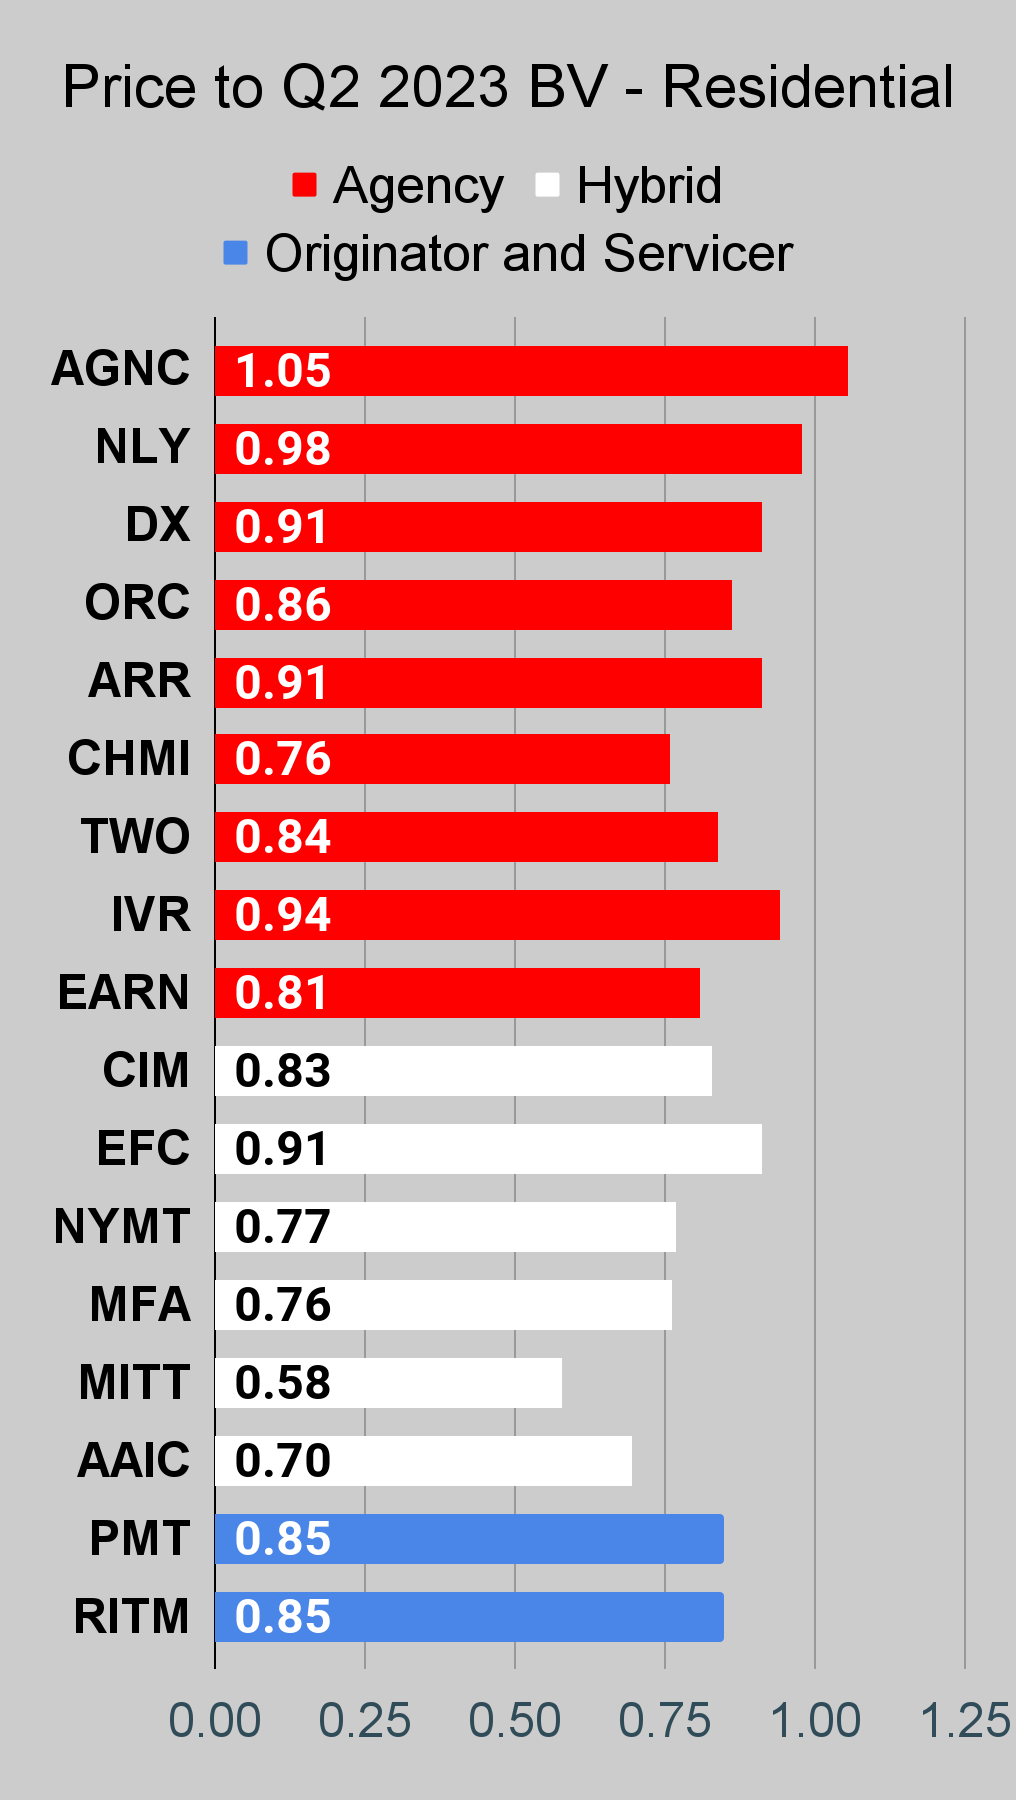
AGNC trades at a price-to-book ratio of about 1.13x using our latest estimates for tangible BV per share. By comparison, DX trades at .95x our latest estimates. That’s a huge gap.
Why are investors buying AGNC? It has a higher dividend yield at 14.5% vs. 12.0%. But surely that’s not enough. Some mortgage REITs are quite a bit higher (until they cut). One of the things that stands out is the huge consensus earnings yield for AGNC. It’s massive. Nearly 23%.
Meanwhile, DX has a negative earnings yield.
So I have to ask you, do you believe that AGNC is simply so brilliant that they are going to be generating drastically more wealth for shareholders over the next several years? I don’t believe that. Instead, I believe consensus earnings estimates are flawed because of the way Core EPS is calculated. Even though both mortgage REITs hold agency fixed-rate mortgages and hedge against interest rate movements, the way AGNC created their portfolio leads to higher recognition of Core EPS.
Does that mean they are generating superior returns for shareholders? No. It just means the way they entered the positions leads to more favorable figures flowing through the right parts of the income statement to report higher Core EPS. That is not a meaningful difference in the ability of the portfolio to perform. It is an accounting difference.
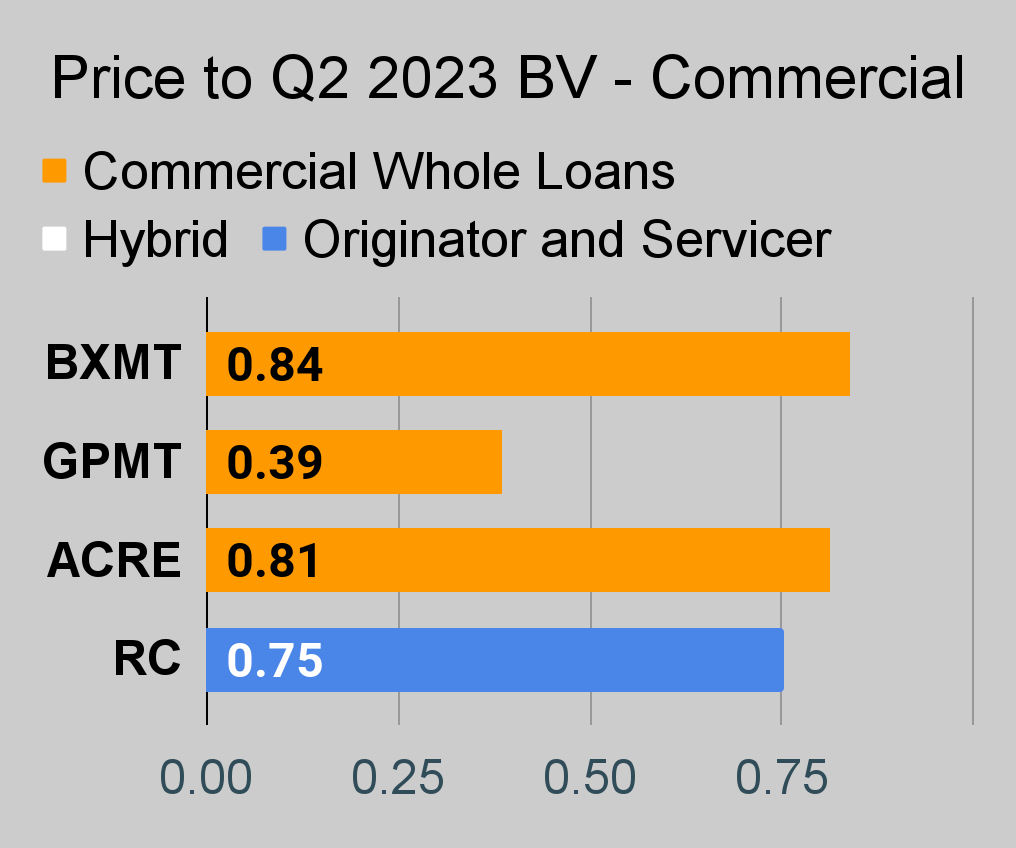
Next, I’ll mention Ready Capital (RC). I think RC is still in bargain territory at $10.92. By our estimate shares are trading at about 76% of book value. That’s cheap enough to be a bargain.
A Note About Charts
I have not revised our charting method yet to account for the issues with fixed-to-floating shares that may not go floating. They are still listed as fixed-to-floating.
Stock Table
We will close out the rest of the article with the tables and charts we provide for readers to help them track the sector for both common shares and preferred shares.
We’re including a quick table for the common shares that will be shown in our tables:
Type of REIT or BDC | ||||
Residential Agency | Residential Hybrid | Residential Originator and Servicer | Commercial | BDC |
If you’re looking for a stock and I haven’t mentioned it yet, you’ll still find it in the charts below. The charts contain comparisons based on price-to-book value, dividend yields, and earnings yield. You won’t find these tables anywhere else.
For mortgage REITs, please look at the charts for AGNC, NLY, DX, ORC, ARR, CHMI, TWO, IVR, EARN, CIM, EFC, NYMT, MFA, MITT, AAIC, PMT, RITM, BXMT, GPMT, WMC, and RC.
For BDCs, please look at the charts for MAIN, CSWC, ARCC, TSLX, TPVG, OCSL, GAIN, GBDC, SLRC, ORCC, PFLT, TCPC, FSK, PSEC, and MFIC.
This series is the easiest place to find charts providing up-to-date comparisons across the sector.
Residential Mortgage REIT Charts
Note: The chart for our public articles uses the book value per share from the latest earnings release. Current estimated book value per share is used in reaching our targets and trading decisions. It's available in our service, but those estimates are not included in the charts below. PMT and NYMT are not showing an earnings yield metric as neither REIT provides a quarterly “Core EPS” metric. Presently, a few other REITs also have no consensus estimate.
Second Note: Due to the way historical amortized cost and hedging is factored into the earnings metrics, it's possible for two mortgage REITs with similar portfolios to post materially different metrics for earnings. I would be very cautious about putting much emphasis on the consensus analyst estimate (which is used to determine the earnings yield). In particular, throughout late 2022 the earnings metric became less comparable for many REITs.
 The REIT Forum | 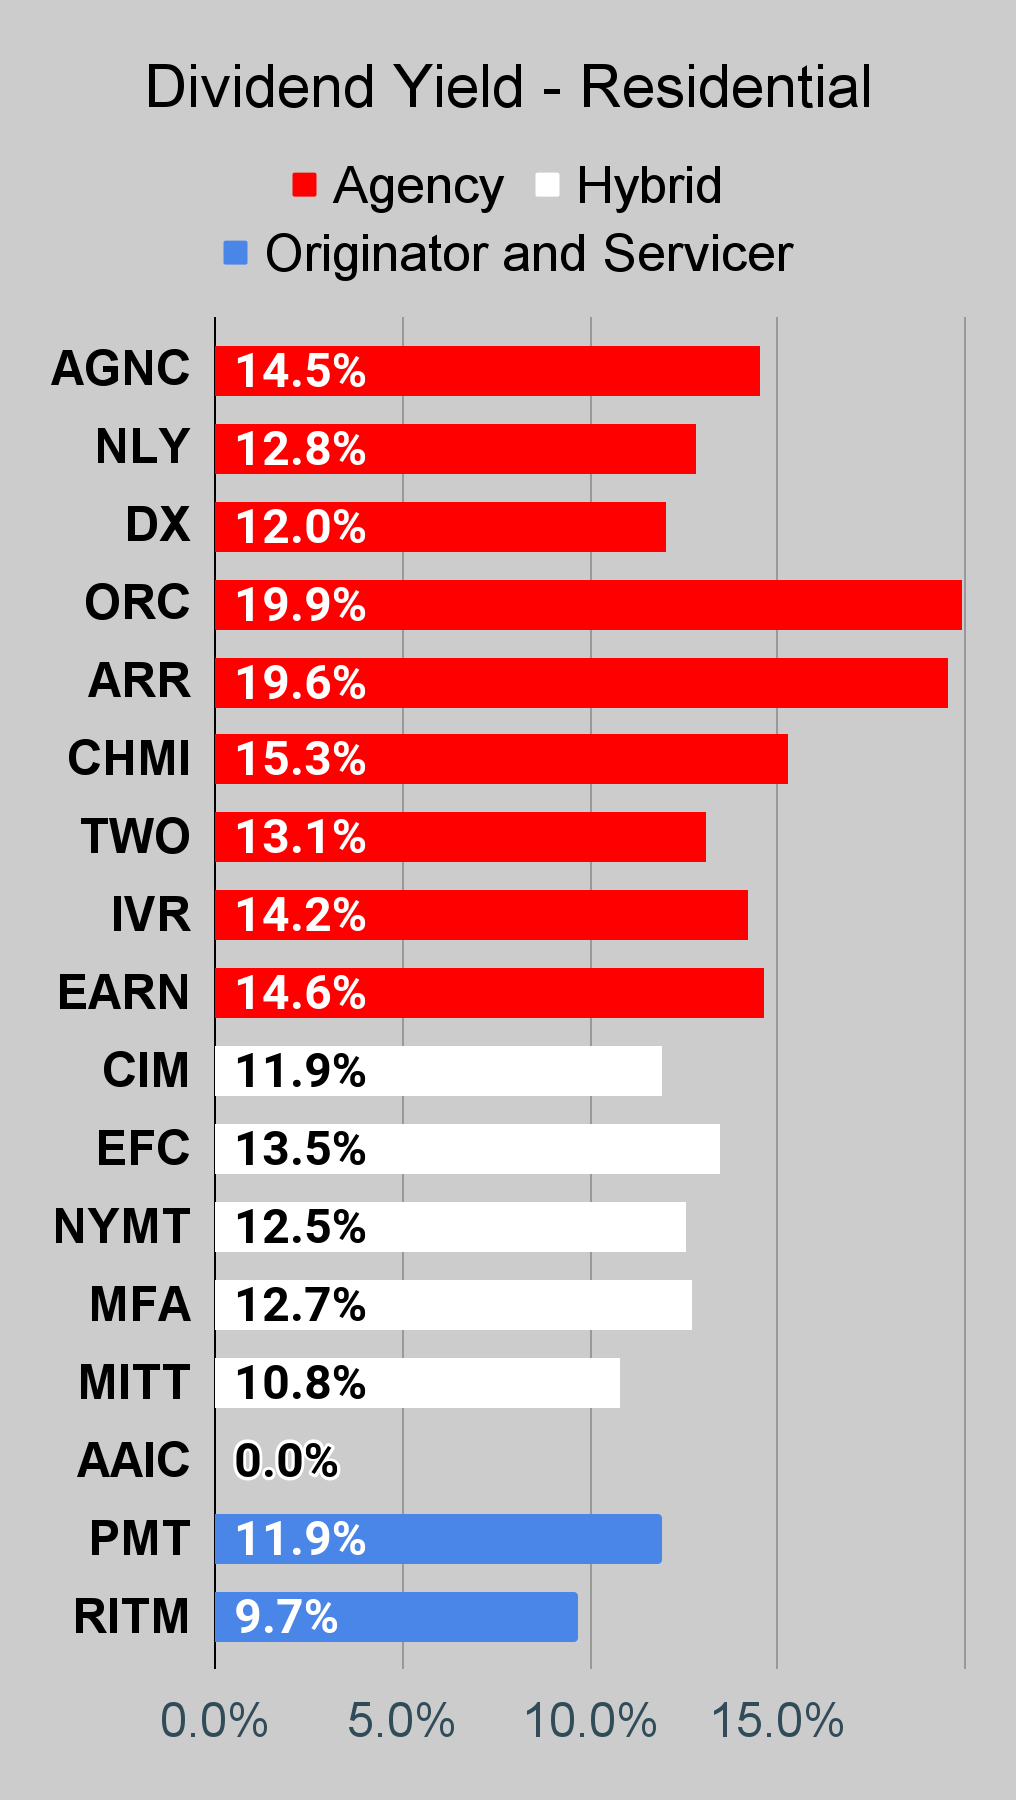 The REIT Forum | 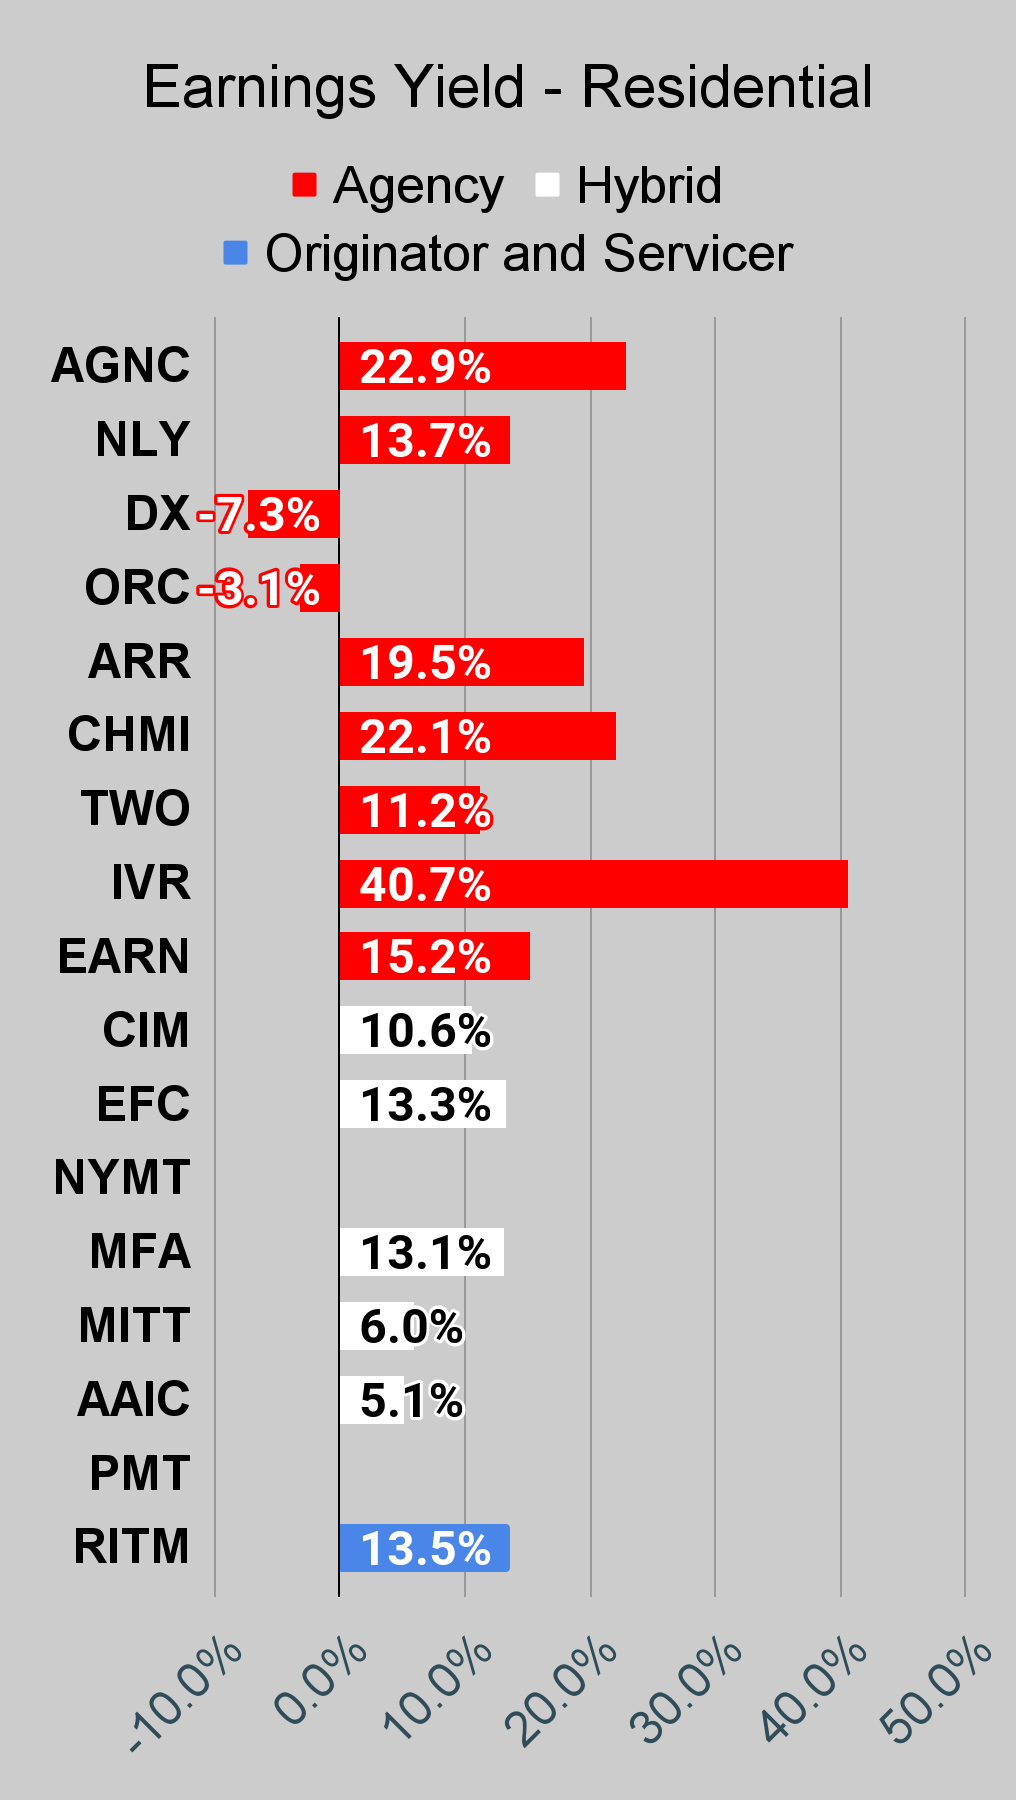 The REIT Forum |
Commercial Mortgage REIT Charts
 The REIT Forum | 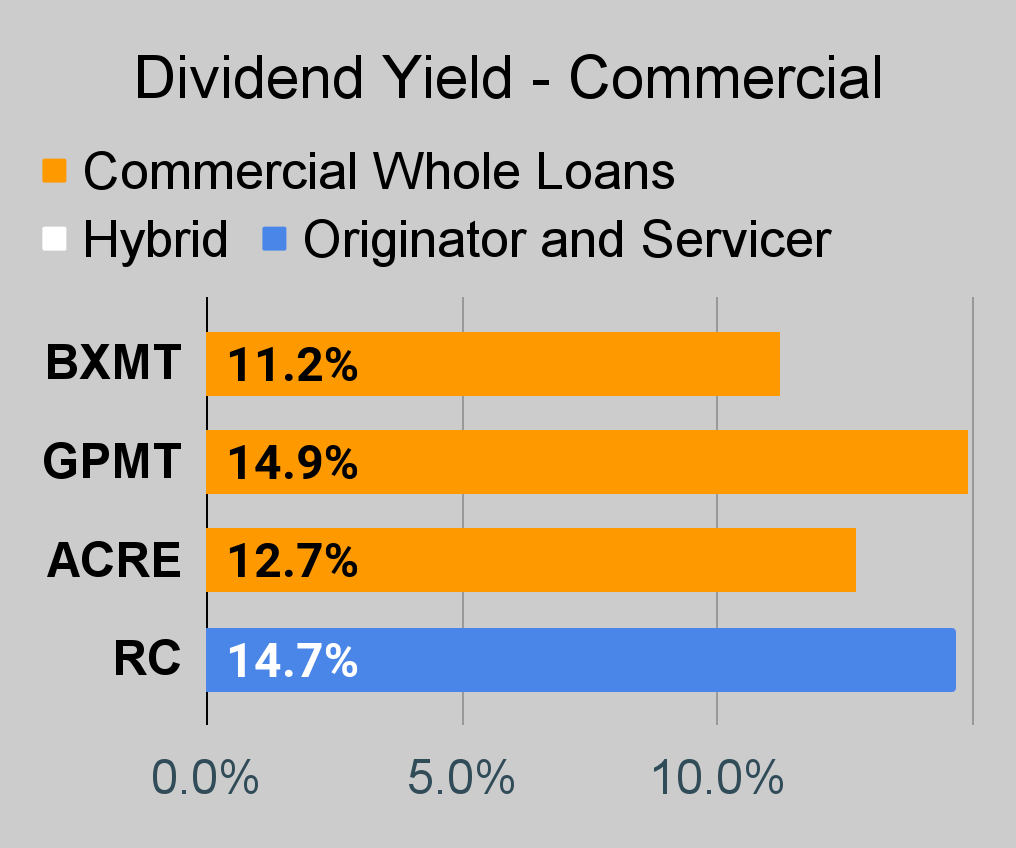 The REIT Forum | 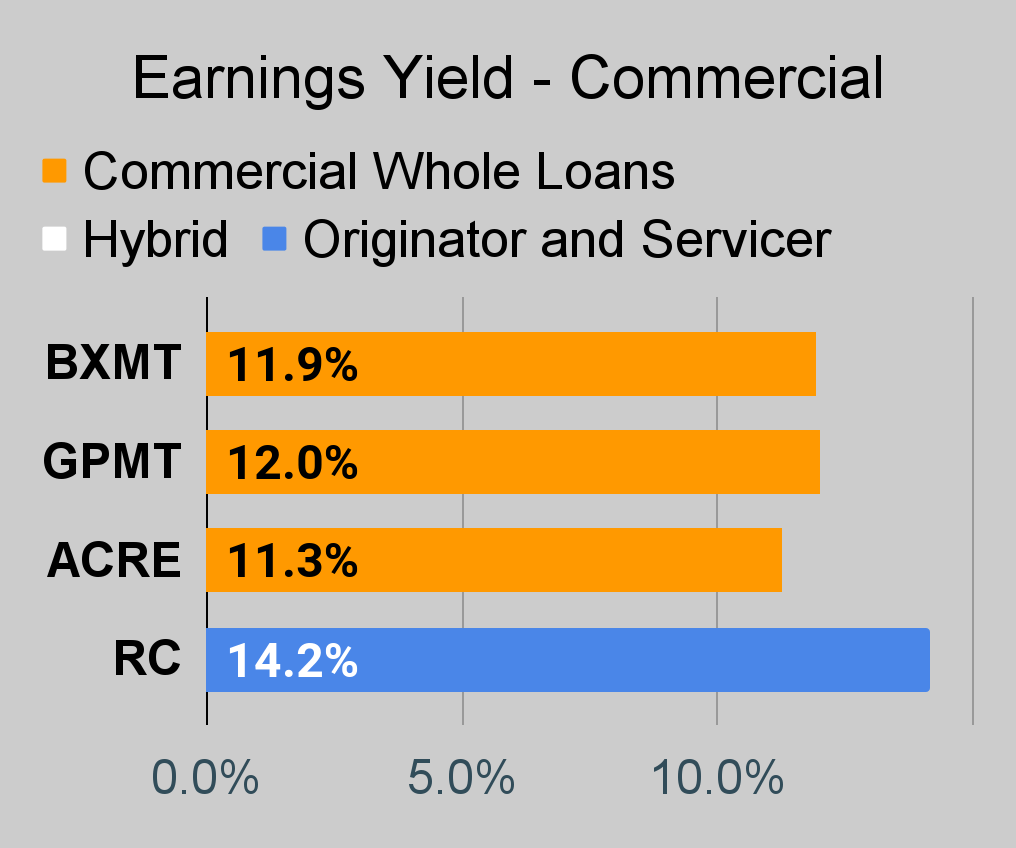 The REIT Forum |
BDC Charts
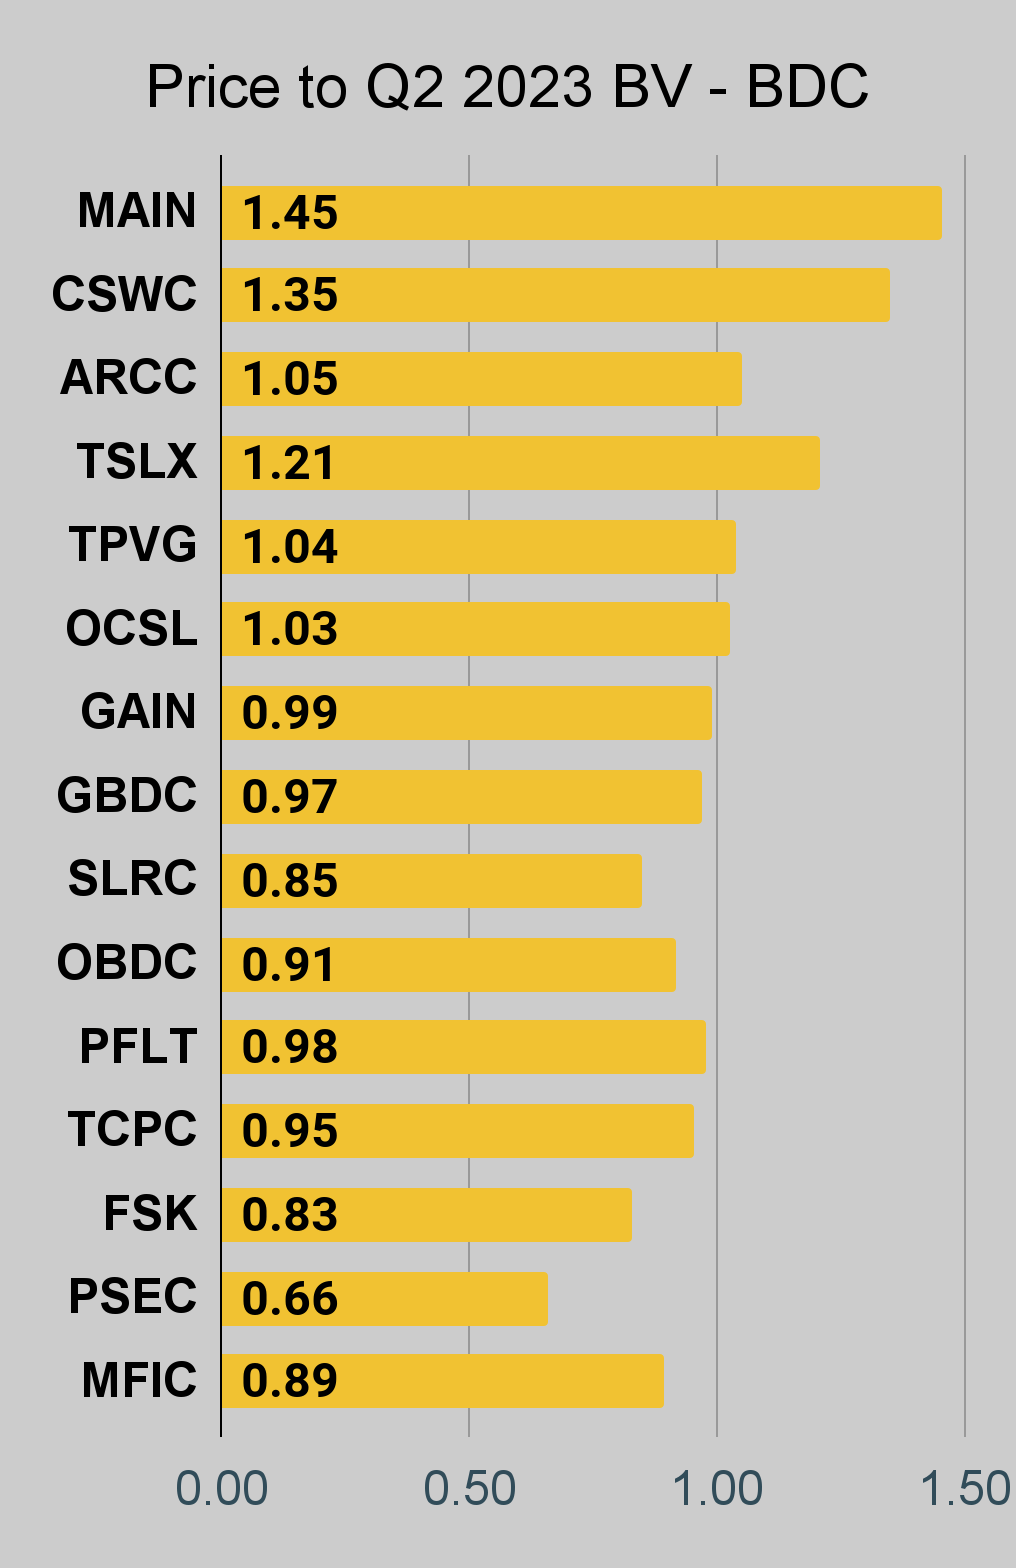 The REIT Forum | 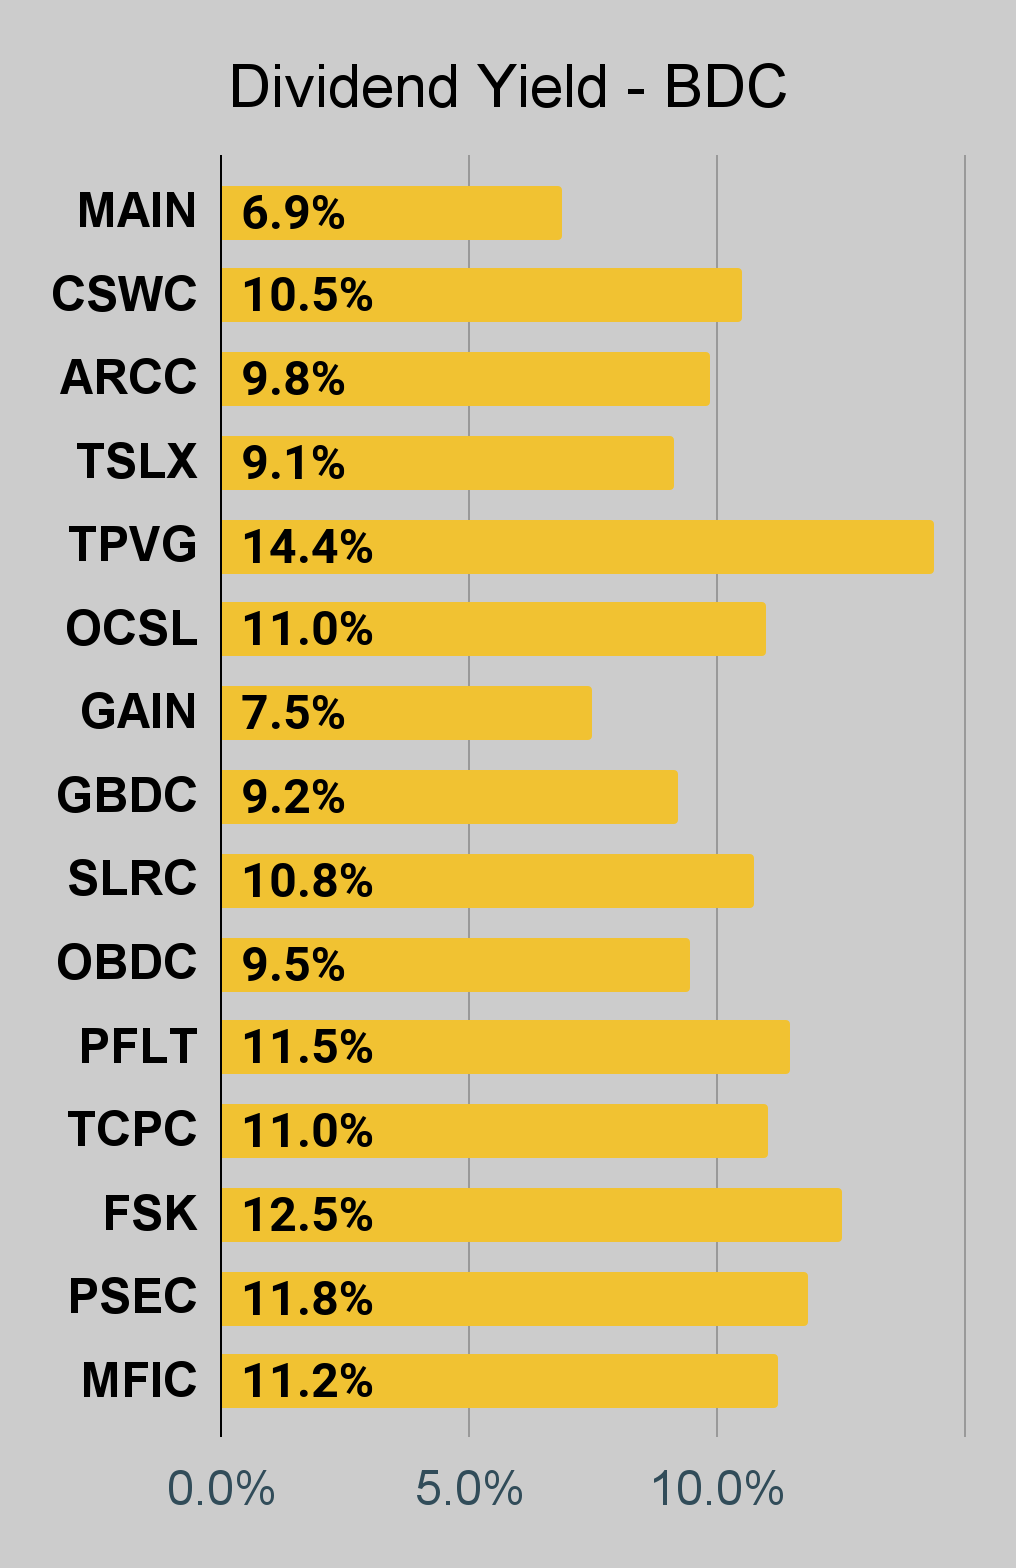 The REIT Forum | 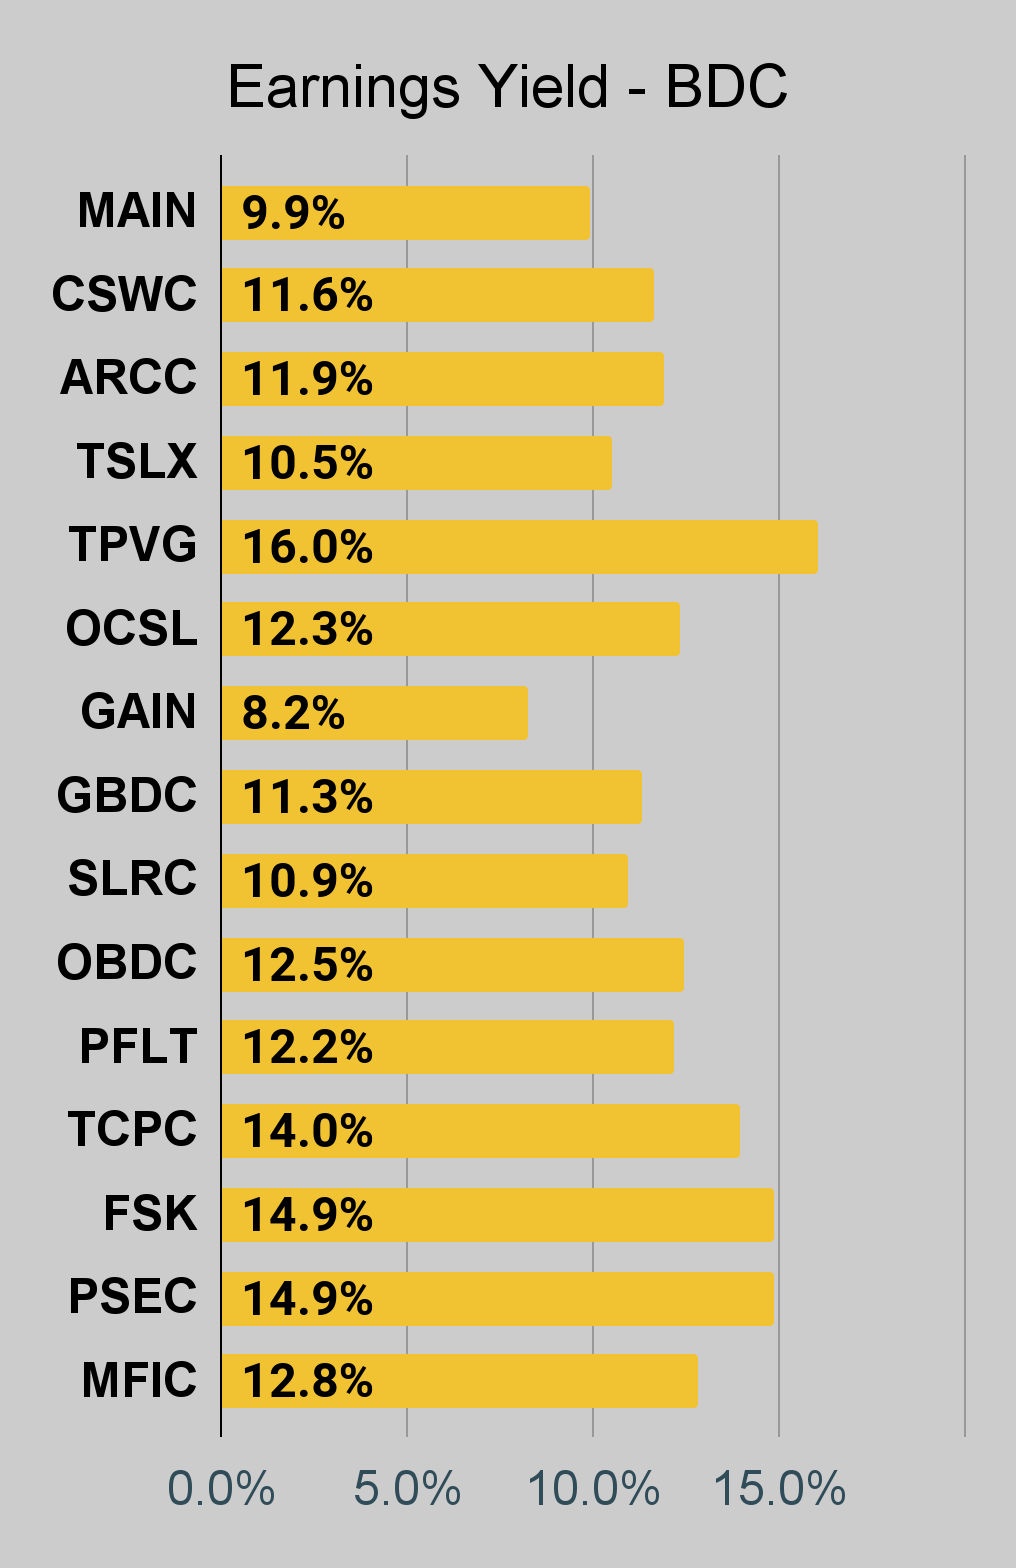 The REIT Forum |
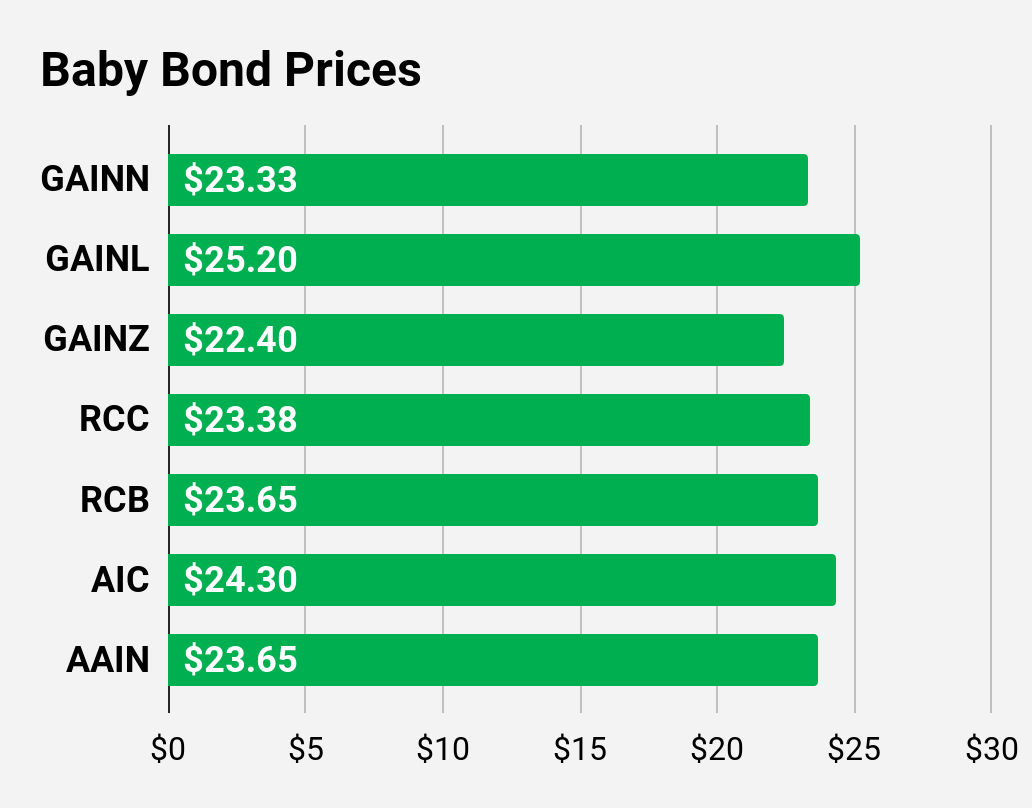
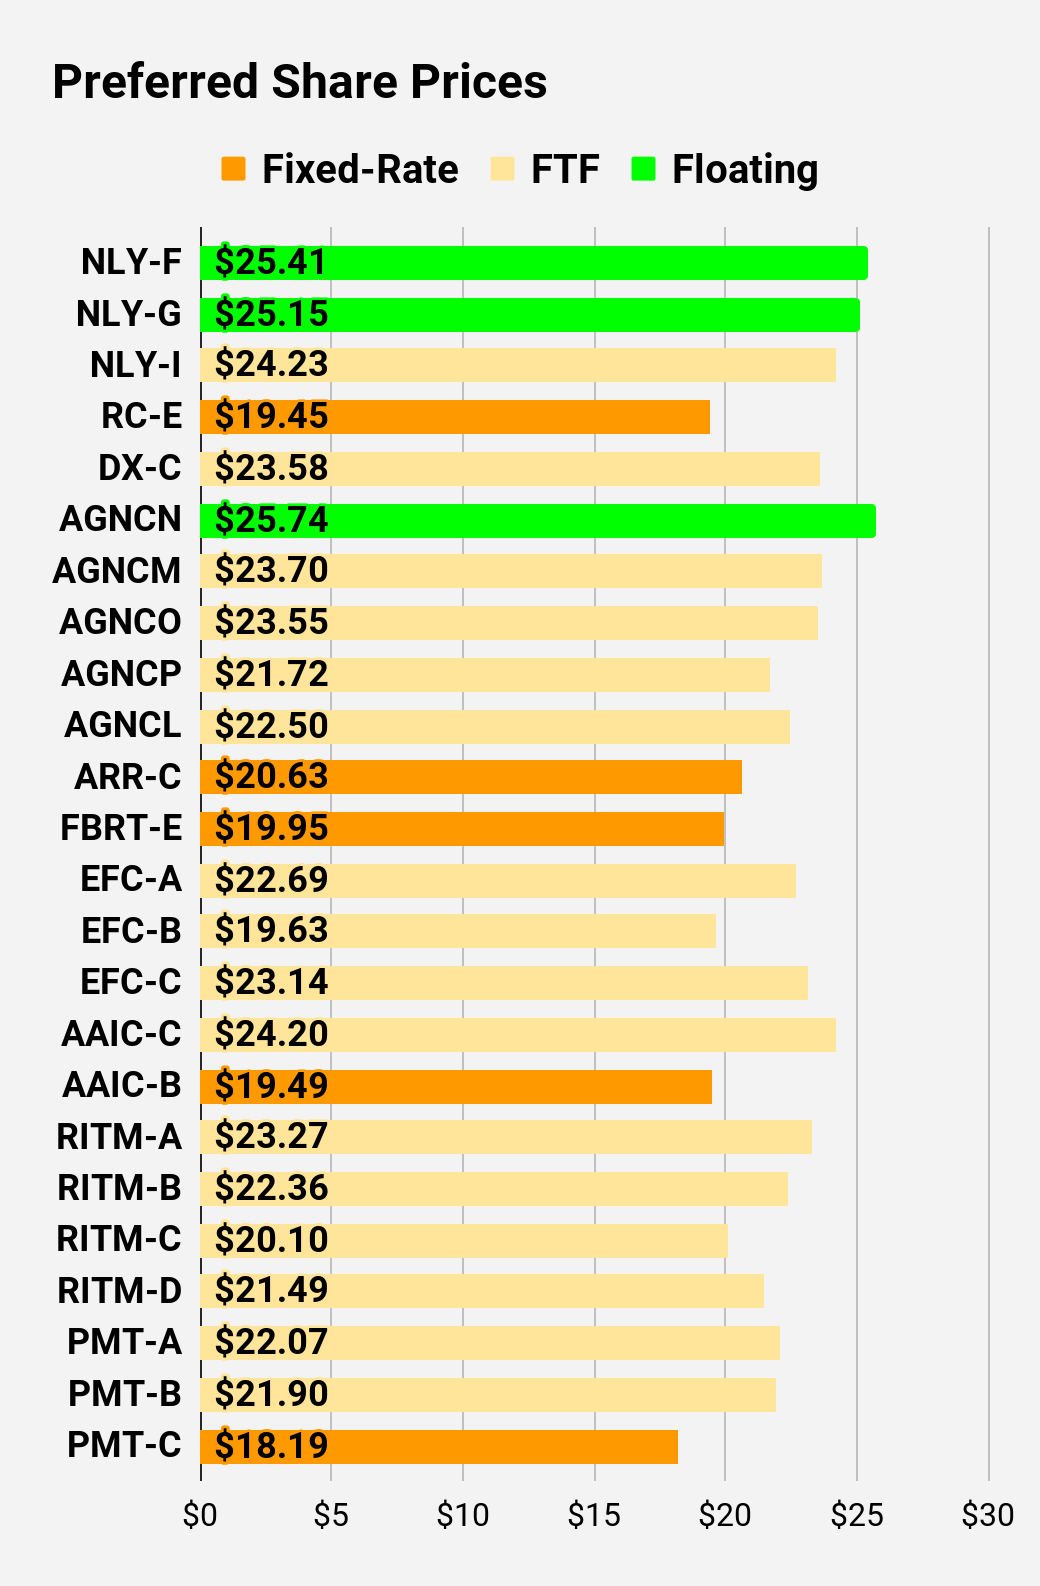
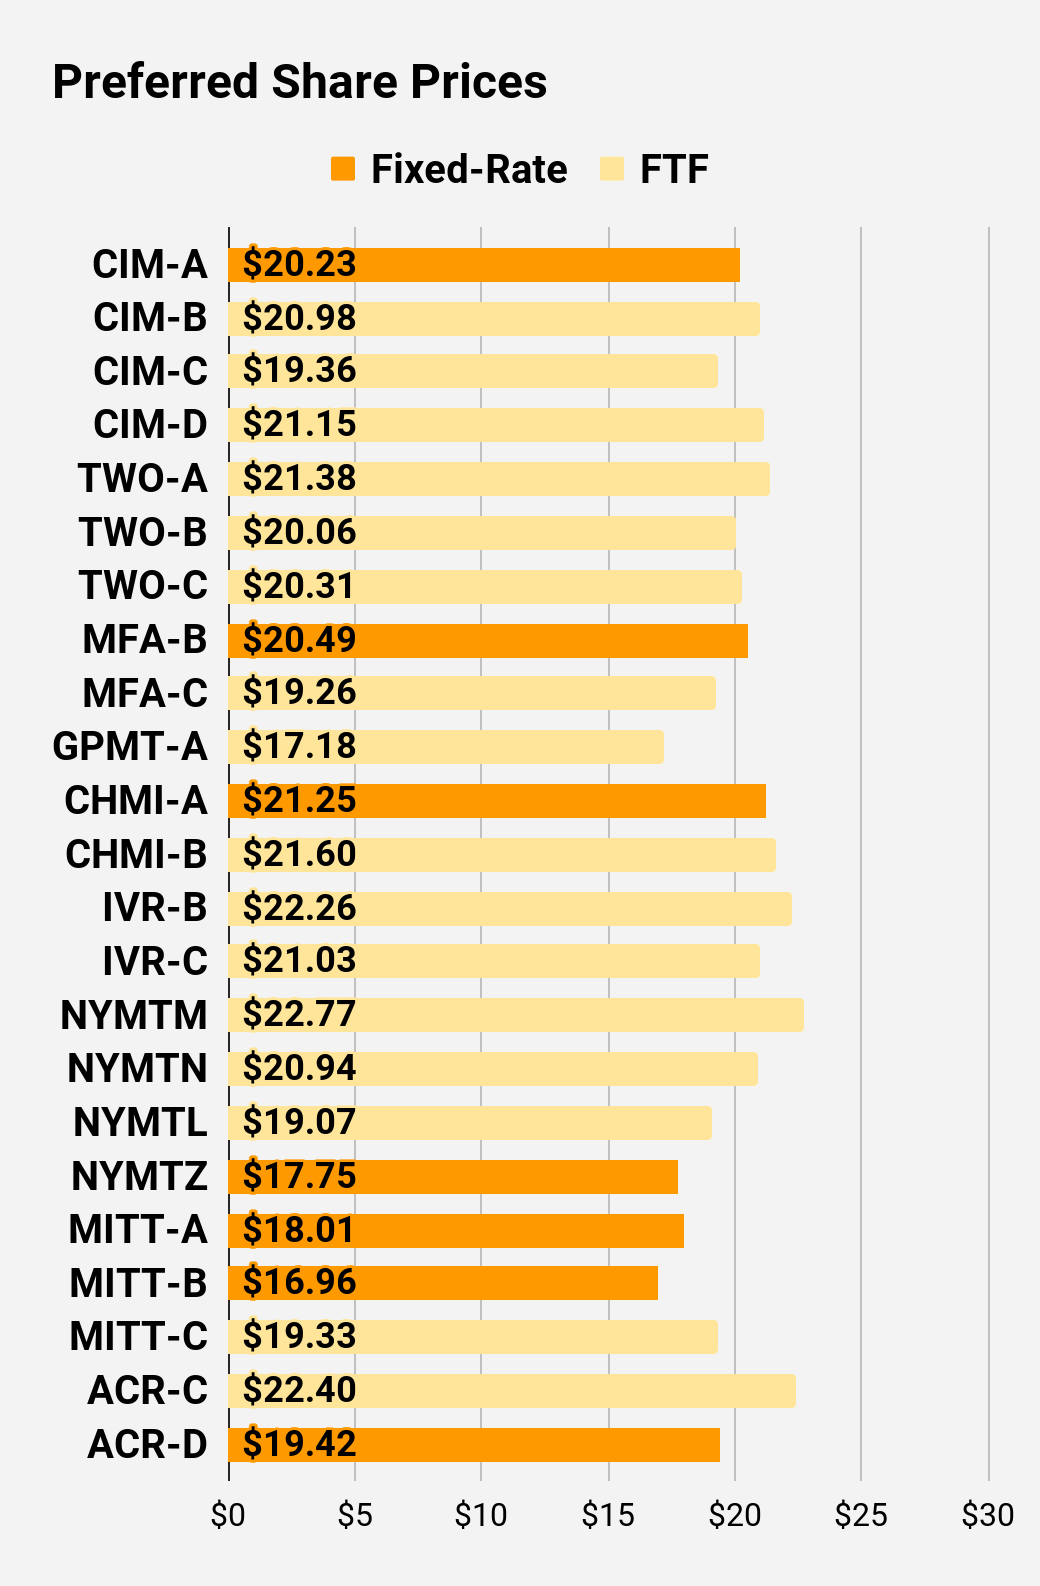
Preferred Share and Baby Bond Charts
I changed the coloring a bit. We needed to adjust to include that the first fixed-to-floating shares have transitioned over to floating rates. When a share is already floating, the stripped yield may be different from the “Floating Yield on Price” due to changes in interest rates. For instance, NLY-F already has a floating rate. However, the rate is only reset once per three months. The stripped yield is calculated using the upcoming projected dividend payment and the “Floating Yield on Price” is based on where the dividend would be if the rate reset today. In my opinion, for these shares the “Floating Yield on Price” is clearly the more important metric.
 The REIT Forum | 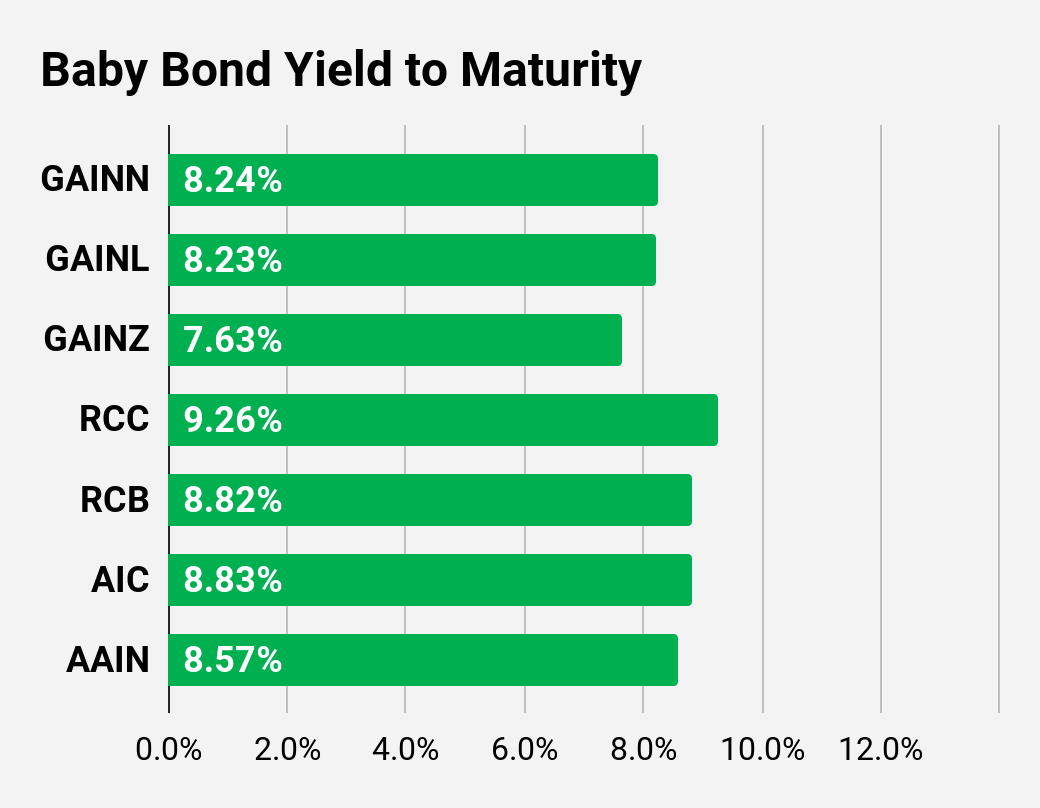 The REIT Forum | 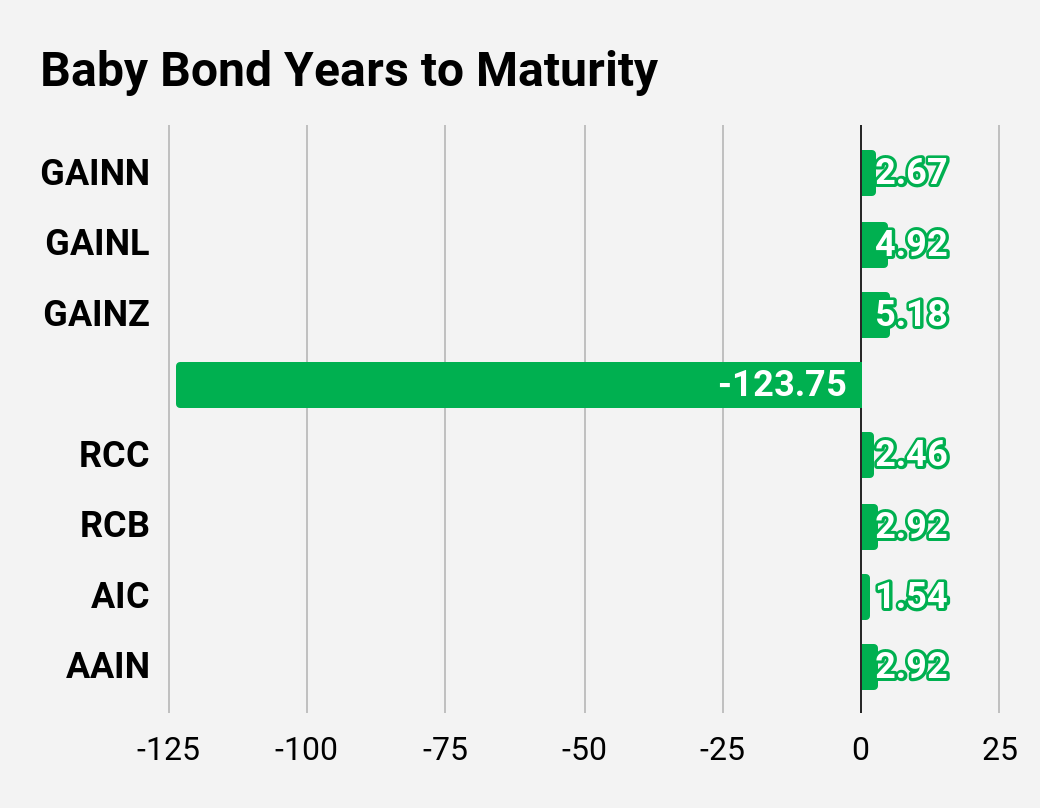 The REIT Forum |
 The REIT Forum | 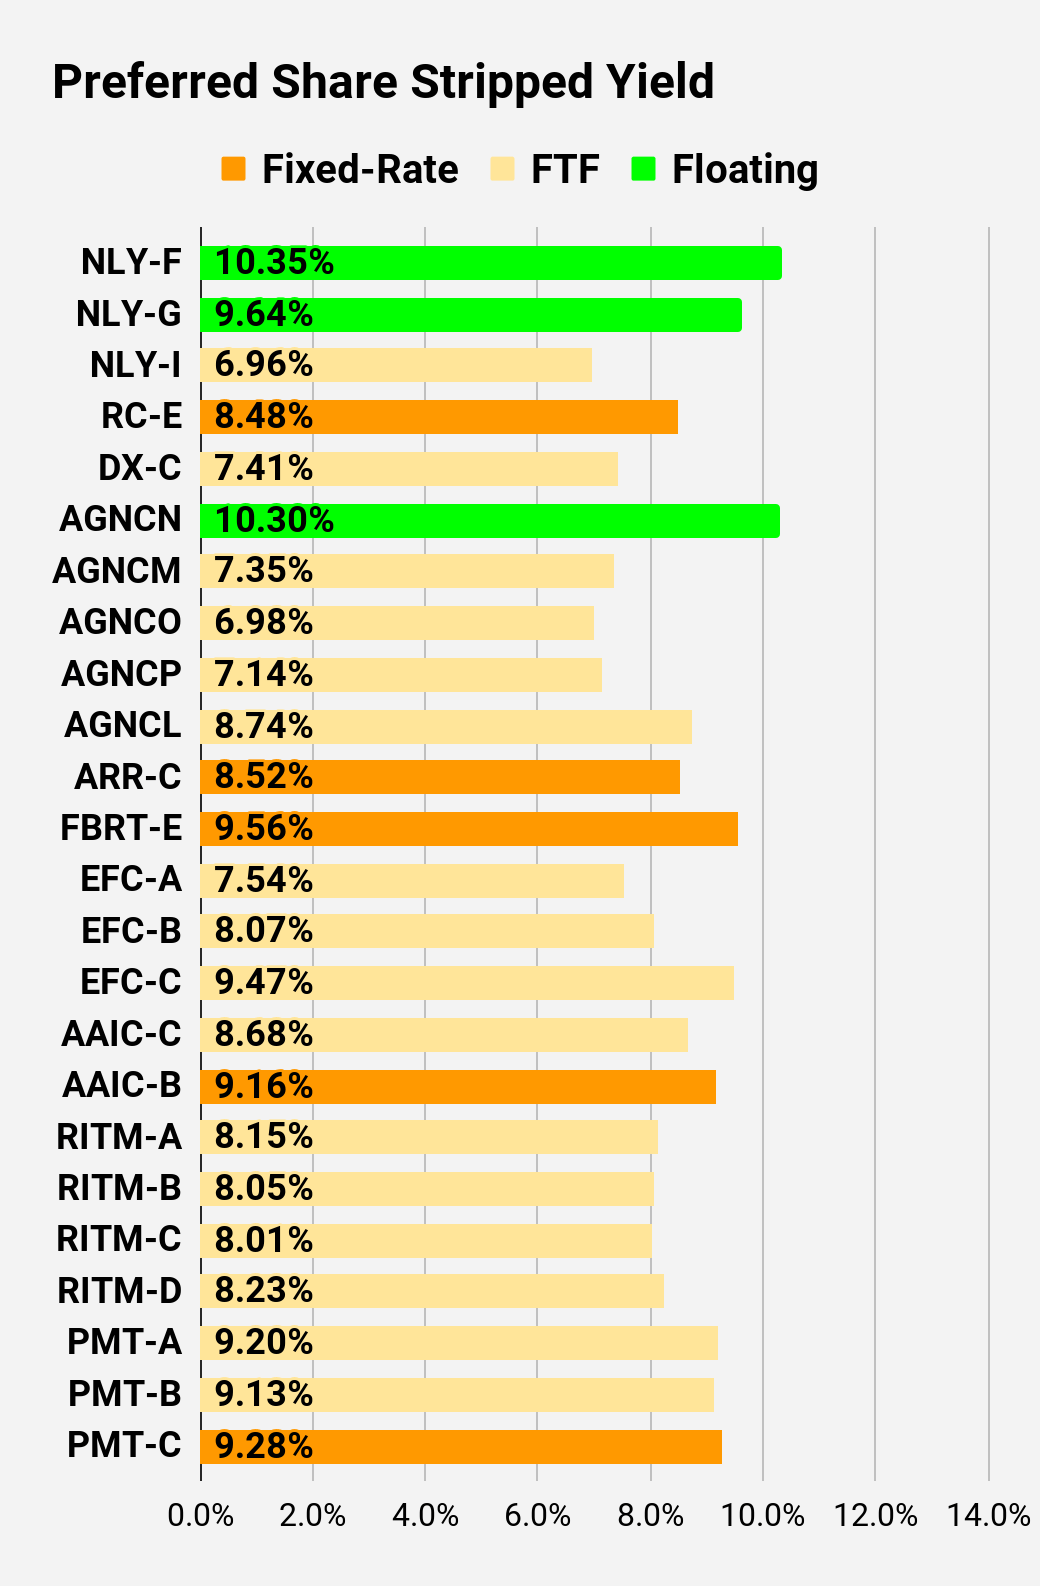 The REIT Forum | 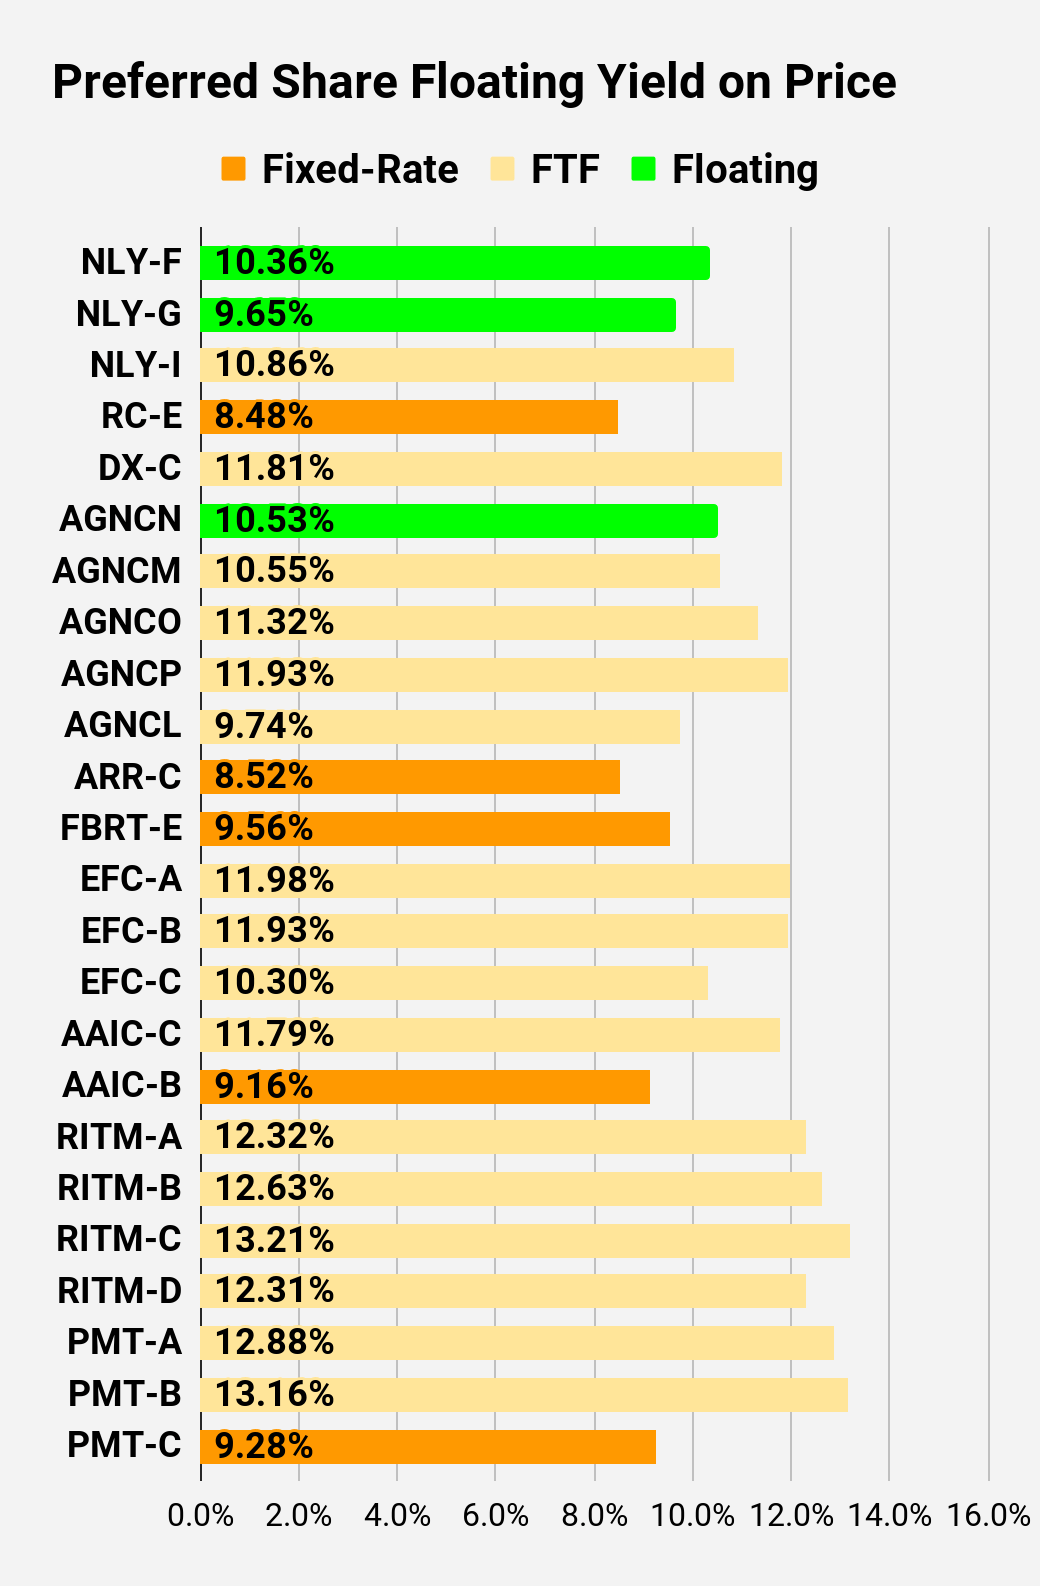 The REIT Forum |
 The REIT Forum | 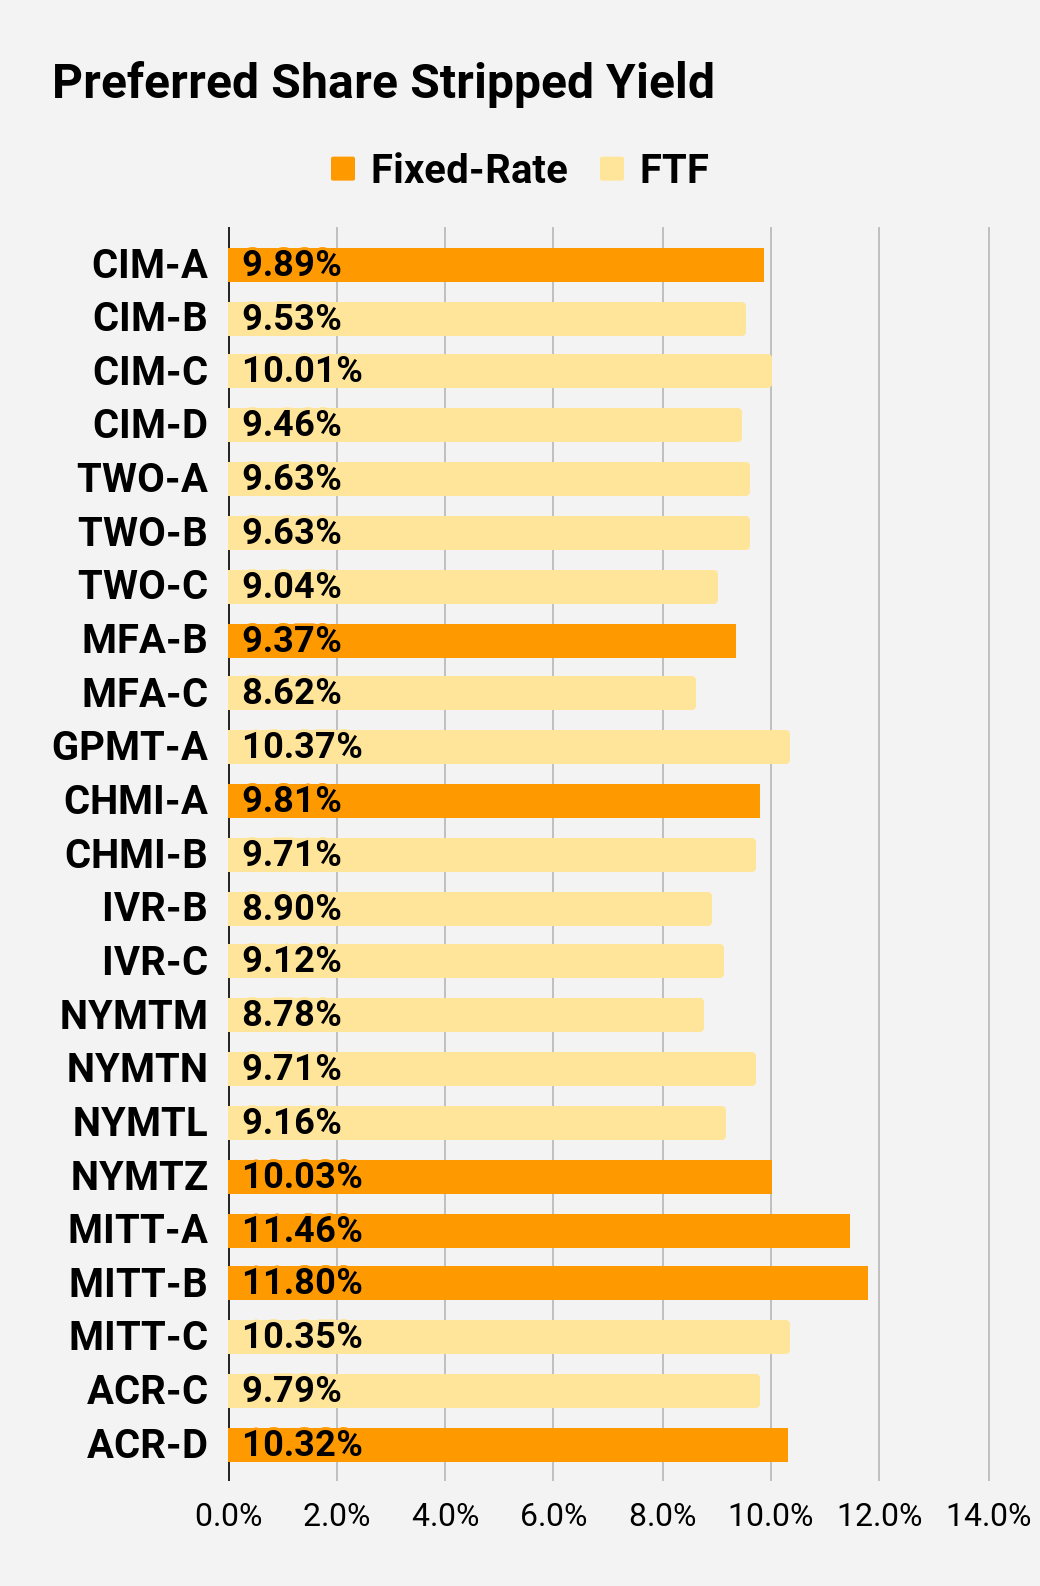 The REIT Forum | 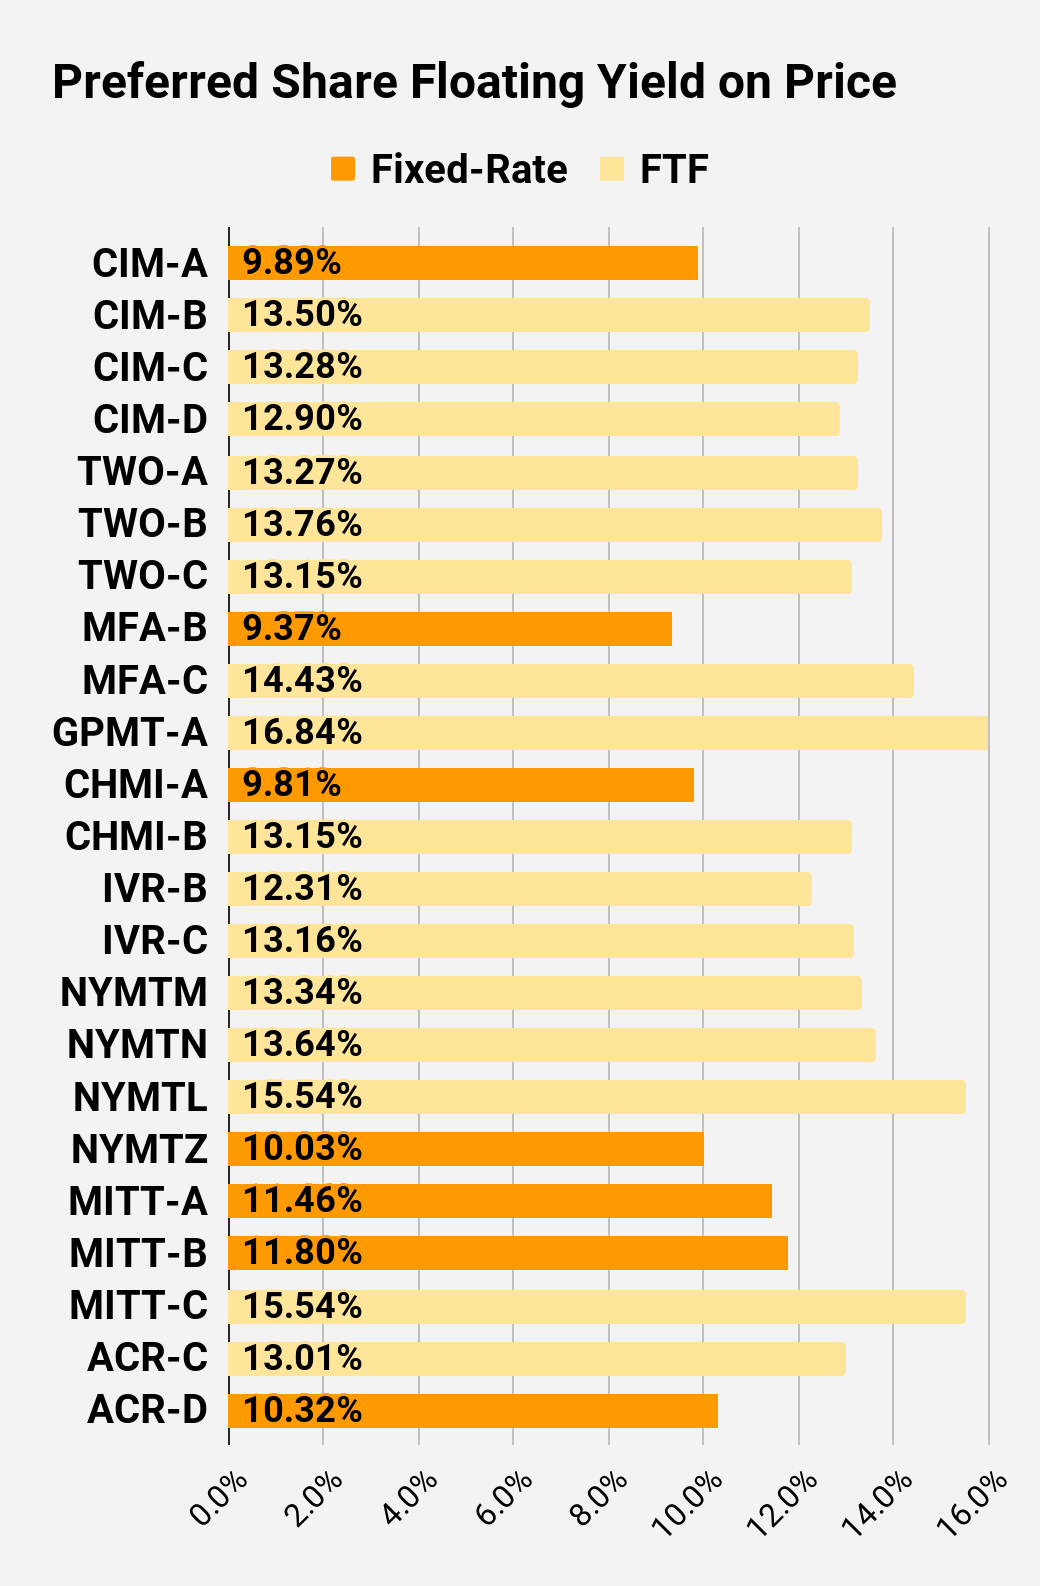 The REIT Forum |
Preferred Share Data
Beyond the charts, we’re also providing our readers with access to several other metrics for the preferred shares.
After testing out a series on preferred shares, we decided to try merging it into the series on common shares. After all, we're still talking about positions in mortgage REITs. We don’t have any desire to cover preferred shares without cumulative dividends, so any preferred shares you see in our column will have cumulative dividends. You can verify that by using Quantum Online. We’ve included the links in the table below.
To better organize the table, we needed to abbreviate column names as follows:
- Price = Recent Share Price - Shown in Charts
- BoF = Bond or FTF (Fixed-to-Floating)
- S-Yield = Stripped Yield - Shown in Charts
- Coupon = Initial Fixed-Rate Coupon
- FYoP = Floating Yield on Price - Shown in Charts
- NCD = Next Call Date (the soonest shares could be called)
- Note: For all FTF issues, the floating rate would start on NCD.
- WCC = Worst Cash to Call (lowest net cash return possible from a call)
- QO Link = Link to Quantum Online Page
Ticker | Price | BoF | S-Yield | Coupon | FYoP | NCD | WCC | QO Link | P-Link |
$23.33 | Bond | 8.24% | 5.00% | 8.24% | 9/30/2023 | $1.88 | |||
$25.20 | Bond | 8.23% | 8.00% | 8.23% | 8/1/2025 | $3.81 | |||
$22.40 | Bond | 7.63% | 4.75% | 7.63% | 11/1/2023 | $2.90 | |||
$23.38 | Bond | 9.26% | 5.75% | 9.26% | 9/30/2023 | $1.86 | |||
$23.65 | Bond | 8.82% | 6.20% | 8.82% | 9/30/2023 | $1.61 | |||
$24.30 | Bond | 8.83% | 6.75% | 8.83% | 9/30/2023 | $0.75 | |||
$23.65 | Bond | 8.57% | 6.00% | 8.57% | 9/30/2023 | $1.59 |
Second batch:
Ticker | Price | BoF | S-Yield | Coupon | FYoP | NCD | WCC | QO Link | P-Link |
$25.41 | Floating | 10.35% | 10.52% | 10.36% | 9/30/2023 | -$0.41 | |||
$25.15 | Floating | 9.64% | 9.70% | 9.65% | 9/30/2023 | -$0.15 | |||
$24.23 | FTF | 6.96% | 6.75% | 10.86% | 6/30/2024 | $2.03 | |||
$19.45 | 8.48% | 6.50% | 8.48% | 6/10/2026 | $10.21 | ||||
$23.58 | FTF | 7.41% | 6.90% | 11.81% | 4/15/2025 | $4.44 | |||
$25.74 | Floating | 10.30% | 10.42% | 10.53% | 9/30/2023 | -$0.18 | |||
$23.70 | FTF | 7.35% | 6.88% | 10.55% | 4/15/2024 | $2.60 | |||
$23.55 | FTF | 6.98% | 6.50% | 11.32% | 10/15/2024 | $3.50 | |||
$21.72 | FTF | 7.14% | 6.13% | 11.93% | 4/15/2025 | $5.97 | |||
$22.50 | FTF | 8.74% | 7.75% | 9.74% | 10/15/2027 | $10.75 | |||
$20.63 | 8.52% | 7.00% | 8.52% | 1/28/2025 | $6.85 | ||||
$19.95 | 9.56% | 7.50% | 9.56% | 9/30/2023 | $5.44 | ||||
$22.69 | FTF | 7.54% | 6.75% | 11.98% | 10/30/2024 | $4.43 | |||
$19.63 | FTF | 8.07% | 6.25% | 11.93% | 1/30/2027 | $10.86 | |||
$23.14 | FTF | 9.47% | 8.63% | 10.30% | 4/30/2028 | $12.12 | |||
$24.20 | FTF | 8.68% | 8.25% | 11.79% | 3/30/2024 | $2.27 | |||
$19.49 | 9.16% | 7.00% | 9.16% | 9/30/2023 | $5.89 | ||||
$23.27 | FTF | 8.15% | 7.50% | 12.32% | 8/15/2024 | $3.62 | |||
$22.36 | FTF | 8.05% | 7.13% | 12.63% | 08/15/2024 | $4.44 | |||
$20.10 | FTF | 8.01% | 6.38% | 13.21% | 02/15/2025 | $7.31 | |||
$21.49 | FTF | 8.23% | 7.00% | 12.31% | 11/15/2026 | $9.22 | |||
$22.07 | FTF | 9.20% | 8.13% | 12.88% | 3/15/2024 | $3.94 | |||
$21.90 | FTF | 9.13% | 8.00% | 13.16% | 6/15/2024 | $4.60 | |||
$18.19 | 9.28% | 6.75% | 9.28% | 8/24/2026 | $11.77 |
Third batch:
Ticker | Price | BoF | S-Yield | Coupon | FYoP | NCD | WCC | QO Link | P-Link |
$20.23 | 9.89% | 8.00% | 9.89% | 9/30/2023 | $4.85 | ||||
$20.98 | FTF | 9.53% | 8.00% | 13.50% | 3/30/2024 | $5.10 | |||
$19.36 | FTF | 10.01% | 7.75% | 13.28% | 9/30/2025 | $9.60 | |||
$21.15 | FTF | 9.46% | 8.00% | 12.90% | 3/30/2024 | $4.93 | |||
$21.38 | FTF | 9.63% | 8.13% | 13.27% | 4/27/2027 | $11.24 | |||
$20.06 | FTF | 9.63% | 7.63% | 13.76% | 7/27/2027 | $12.57 | |||
$20.31 | FTF | 9.04% | 7.25% | 13.15% | 1/27/2025 | $7.42 | |||
$20.49 | 9.37% | 7.50% | 9.37% | 9/30/2023 | $4.99 | ||||
$19.26 | FTF | 8.62% | 6.50% | 14.43% | 3/31/2025 | $8.59 | |||
$17.18 | FTF | 10.37% | 7.00% | 16.84% | 11/30/2026 | $13.72 | |||
$21.25 | 9.81% | 8.20% | 9.81% | 9/30/2023 | $4.11 | ||||
$21.60 | FTF | 9.71% | 8.25% | 13.15% | 4/15/2024 | $4.88 | |||
$22.26 | FTF | 8.90% | 7.75% | 12.31% | 12/27/2024 | $5.68 | |||
$21.03 | FTF | 9.12% | 7.50% | 13.16% | 9/27/2027 | $11.97 | |||
$22.77 | FTF | 8.78% | 7.88% | 13.34% | 1/15/2025 | $5.19 | |||
$20.94 | FTF | 9.71% | 8.00% | 13.64% | 10/15/2027 | $12.57 | |||
$19.07 | FTF | 9.16% | 6.88% | 15.54% | 10/15/2026 | $11.52 | |||
$17.75 | 10.03% | 7.00% | 10.03% | 1/15/2027 | $13.39 | ||||
$18.01 | 11.46% | 8.25% | 11.46% | 9/30/2023 | $7.02 | ||||
$16.96 | 11.80% | 8.00% | 11.80% | 9/30/2023 | $8.07 | ||||
$19.33 | FTF | 10.35% | 8.00% | 15.54% | 9/17/2024 | $7.64 | |||
$22.40 | FTF | 9.79% | 8.63% | 13.01% | 7/30/2024 | $4.76 | |||
$19.42 | 10.32% | 7.88% | 10.32% | 5/21/2026 | $11.12 |
Strategy
Our goal is to maximize total returns. We achieve those most effectively by including “trading” strategies. We regularly trade positions in the mortgage REIT common shares and BDCs because:
- Prices are inefficient.
- Long term, share prices generally revolve around book value.
- Short term, price-to-book ratios can deviate materially.
- Book value isn’t the only step in analysis, but it's the cornerstone.
We also allocate to preferred shares and equity REITs. We encourage buy-and-hold investors to consider using more preferred shares and equity REITs.
Outlook: Bullish on RC, Bearish on AGNC

You should try our service. Unlike most services, our service is backed by a real portfolio. Not a "model" portfolio. Not hypothetical positions. Not 7 different portfolios we made up in Google Sheets so we can brag about the good one. None of that crap.
You get real-time alerts on every trade. See current and past positions. I'm sick of analysts who have to retroactively pick a "portfolio" or get creative about defining "returns". Beat the index or get out.
Ask your analyst to share their portfolio value each month so you can verify their returns. When they object, try us.