JohnnyGreig
Fundamental analysis of stocks is essentially about finding discrepancies between intrinsic value and market price. These deviations are caused by the market either becoming too excited or too fearful, often with a myopic focus on a single factor and missing the bigger picture. Simon Property Group, Inc. (NYSE:SPG) epitomizes this concept, as a singular focus on the next bear thesis has driven it down to a funds from operations ("FFO") multiple equivalent to 2000, 2008 or 2020.
Each time SPG has gotten that cheap it has been a home run for investors who picked it up. I believe history will repeat here. Further, the risk factors facing the company are substantially less daunting than they were in the previous episodes of cheapness.
The buy thesis
SPG is positioned to grow FFO/share steadily for the foreseeable future. Despite being the consensus fundamental outlook, it is antithetical to what is implied by a 9.38X forward FFO multiple. Over time, as SPG hits its growth, the multiple should increase substantially to reflect the reality.
Let me begin by addressing the risk factors facing the company which the market seems to be fixated upon.
Risk factors causing SPG to trade cheaply
- Tenant store closures
- E-commerce
- Interest rates.
These are all real risk factors and things investors should watch closely. However, I think the negative narrative has left out the idea that retail has been facing major challenges since the dawn of time. SPG has thrived through substantially more difficult headwinds. History can teach a good lesson here.
SPG knocking out problems since 1995
In the past few decades retail has been faced with some massive challenges. 2000 featured the birth of mainstream e-commerce. Over the ensuing decades, the percentage of total retail sales gobbled up by e -commerce grew from basically 0 to 15%.
FRED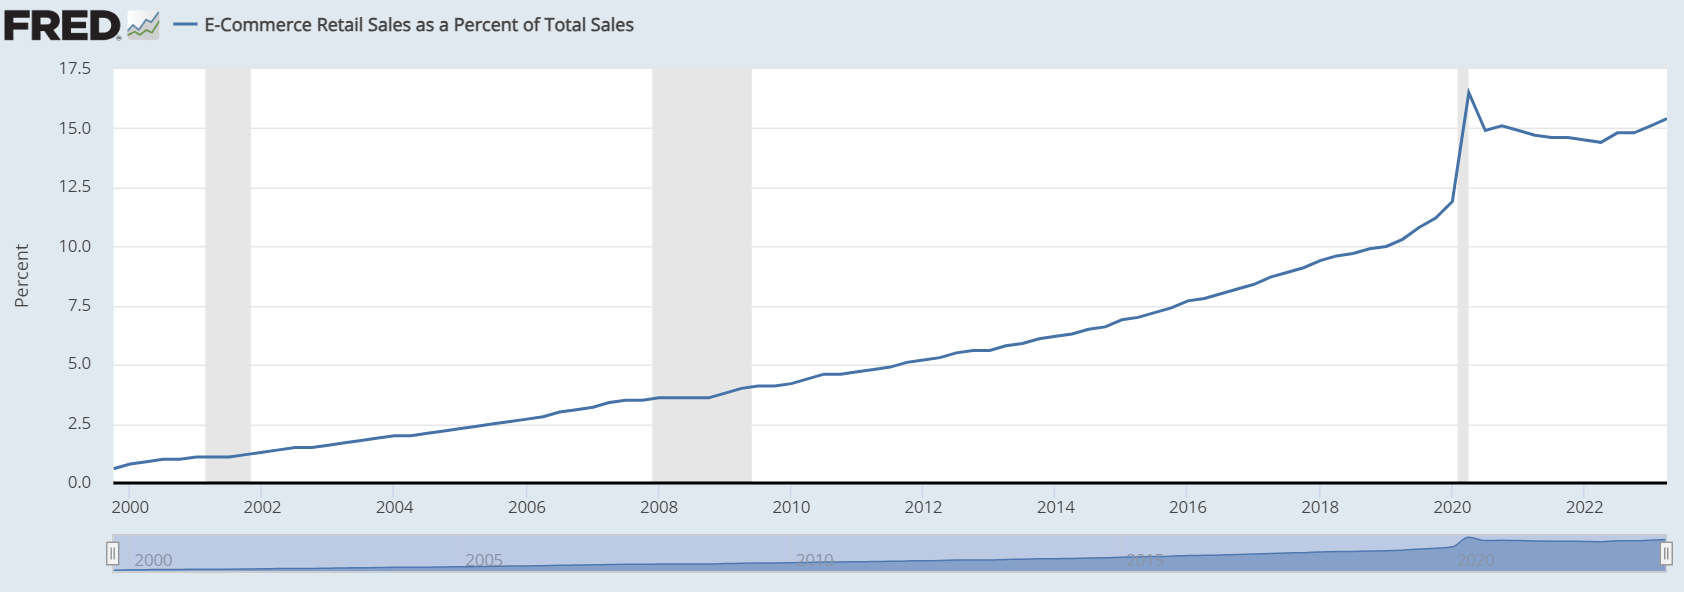
Over those same decades SPG grew FFO/share 5 fold from about $0.60 quarterly to about $3 quarterly.
S&P Global Market Intelligence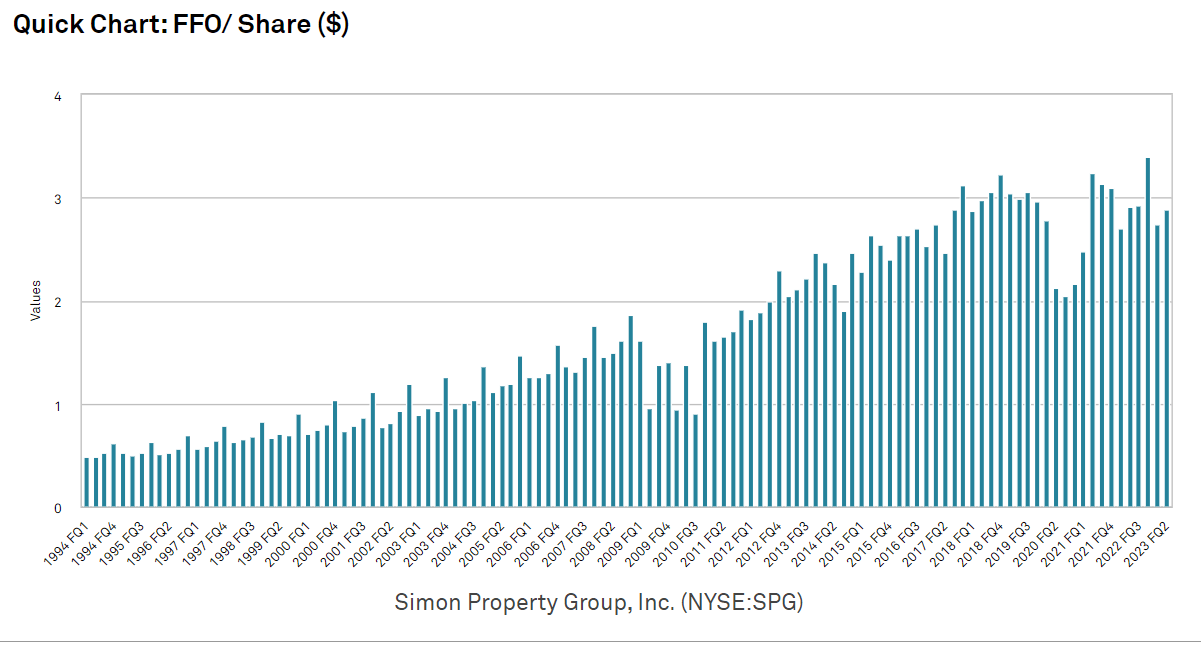
I suspect e-commerce will continue to capture market share but that is a problem SPG is well prepared to handle. Here are the adaptations SPG has made:
- Tenant sales are calculated in a way that includes e-commerce purchases made within the store and those within the catchment radius of the store. Things like buy-online-pickup-in-store (BOPIS) are normally counted as e-commerce sales, but they are sales that only happen if there is a physical store. SPG ensures tenants give the brick and mortar credit for such sales and it means higher rental rates given a fixed occupancy cost.
- Returns from online are no longer allowed to be counted as negative brick and mortar sales. SPG has been cracking down on this practice which retailers used to inflate their e-commerce numbers.
At a broader retail level, returns in general are being heavily scrutinized due to the extreme cost incurred by sellers. As returns get financially disincentivized for customers, apparel sales should return to brick and mortar. It turns out people really do need to try on clothes if they want a good fit.
The last 2 decades also faced the largest recession since the great depression in the form of the great financial crisis. Referring to the graph above, SPG’s FFO did dip a bit but fully recovered to above recession levels by 2011. A similar dip occurred during COVID when malls were forcibly shut down by the government. Once again, SPG FFO/share has recovered to above pre-pandemic levels.
There have been plenty of problems and SPG just grows through them. It comes down to fundamental strengths that few companies share. In particular, I think it worth noting the following:
- Efficient operations
- Strong management
- Healthy balance sheet
- Premium quality and location of real estate.
Efficient platform
SPG’s overhead expense is just 3.2% of revenue.
SPG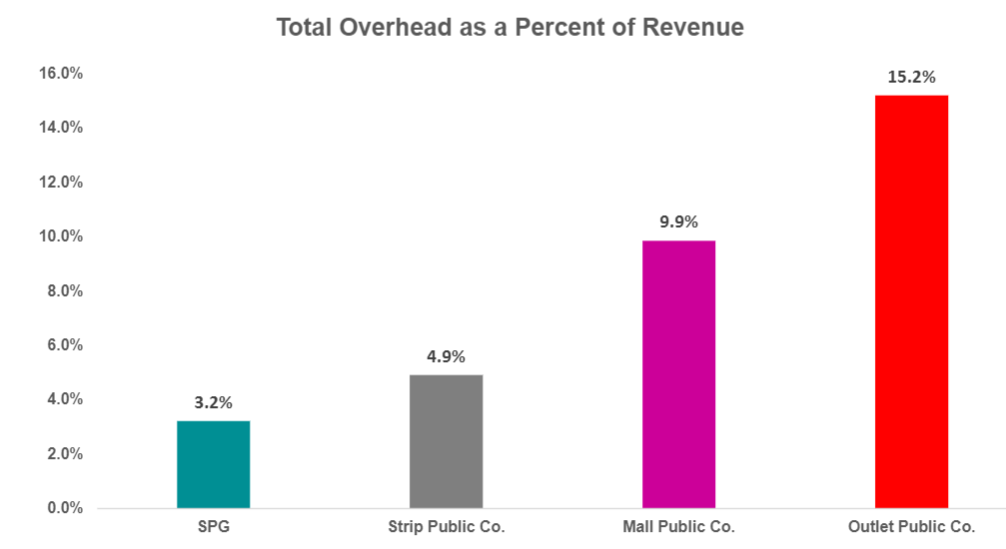
The graphic above only compares SPG to retail peers, but that cost ratio is among the lowest of all REITs.
Strong management
Strength of management is, of course, a subjective measure. I view SPG’s management quite favorably based on a combination of track record and individual decisions they make. Over the years in following SPG, I have noticed that they are frequently the first to innovate and this is evident in the previously mentioned way they calculate tenant sales with regard to e-commerce.
This is the same management team that grew FFO/share for the last 30 years. David Simon has been CEO of SPG since 1995. If you listen to the latest conference calls he is still as fiery as ever. SPG’s scale provides it with leverage in tenant negotiations and they know how to use it.
Strong balance sheet
Debt levels are stable at SPG
S&P Global Market Intelligence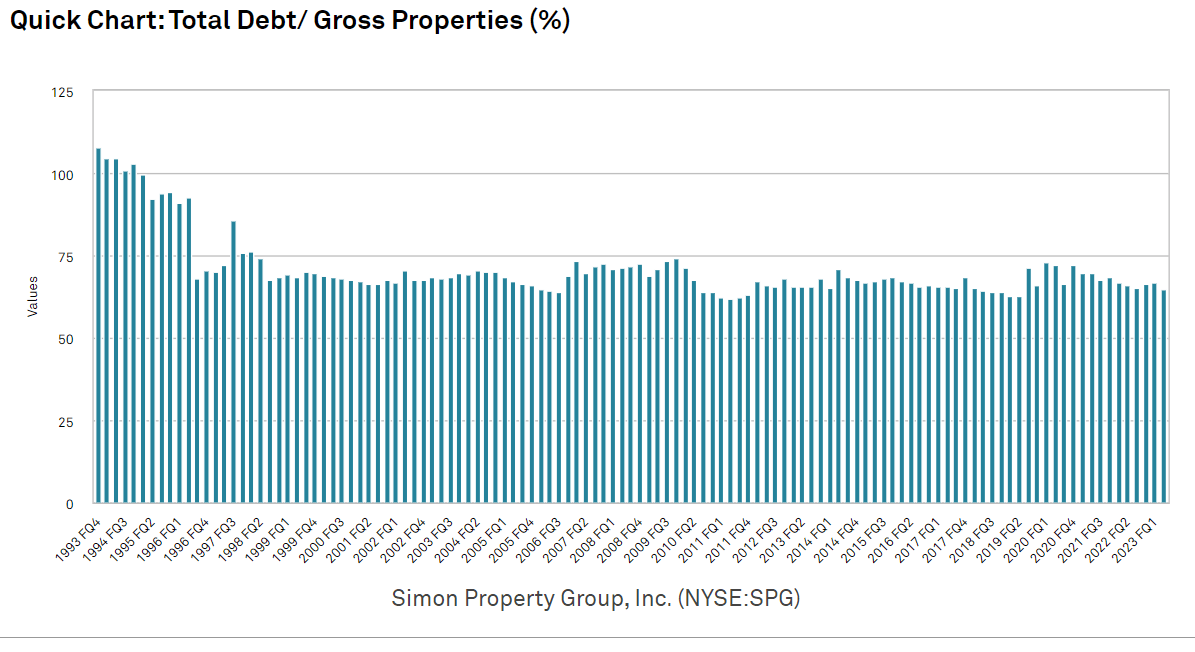
They have consistently maintained an investment grade rating and sit at A- today. EBITDA coverage of interest expense is 5.7X as of the most recent quarter.
This balance sheet keeps interest expense relatively low even in this now somewhat high interest rate environment. In a September conference presentation, SPG stated that 10-year debt refinanced today would be at about 5.75%.
Sure, that is slightly higher than it has been, but it still represents a great spread as SPG is able to invest in acquisitions and redevelopments at cap rates ranging from 8% to the mid teens. Interest rates affect the discount rate for all investments, but SPG is not going to be materially hurt fundamentally.
SPG’s property portfolio is the key to defeating the market’s remaining fear of tenant store closures.
Property strength
The death of the mall narrative surfaced before COVID but really accelerated through the pandemic shutdown. A significant portion of malls did indeed fail.
This mall weakness has been incorrectly interpreted as a bad thing for SPG and may explain the very low multiple at which it trades.
While it is true that many malls have been demolished or converted to another use, this was not done at random. It was the bottom X% of malls that died. SPG’s malls are almost universally in the top quartile of sales per foot, profitability and quality. These are not the malls that died.
Not only did SPG largely evade the wave of mall death, but it is a beneficiary. There are now far less square feet of space in which tenants can locate.
Retailer bankruptcies like Bed Bath & Beyond (OTCPK:BBBYQ) make the headlines causing investors to anticipate widespread vacancy. There are 2 things wrong with this logic.
- Store closures have always happened and today’s pace is well within the normal range
- Store closures are only 1 part of a 3-part equation.
The fuller equation governing the leasing environment is a combination of
- Store closures
- Store openings
- Supply of square footage.
CoStar reports that:
“There are 3,448 store closings and 4,427 store openings announced so far for this year”
That is net store openings of about +979 stores. On top of that there has been virtually no new mall supply or strip center supply while many malls have closed.
Thus, more stores are now trying to fit into fewer locations and the result is that the power pendulum has now swung fully in favor of landlords.
SPG has premium space. Tenants want that space and they are having to pay up for it.
The recent ICSC (International Council of Shopping Centers) conference featured fairly heavy activity, which indicates an influx of tenants jockeying for space.
For SPG this means increased occupancy and rental rates. It was already showing up in the 2nd quarter.
- Occupancy was 94.7% at June 30, 2023, compared to 93.9% at June 30, 2022, an increase of 80 basis points.
- Base minimum rent per square foot was $56.27 at June 30, 2023, compared to $54.58 at June 30, 2022, an increase of 3.1%.
I think the growth will continue.
Not much has changed. It is still a strong company with great properties.
What has changed is the multiple.
S&P Global Market Intelligence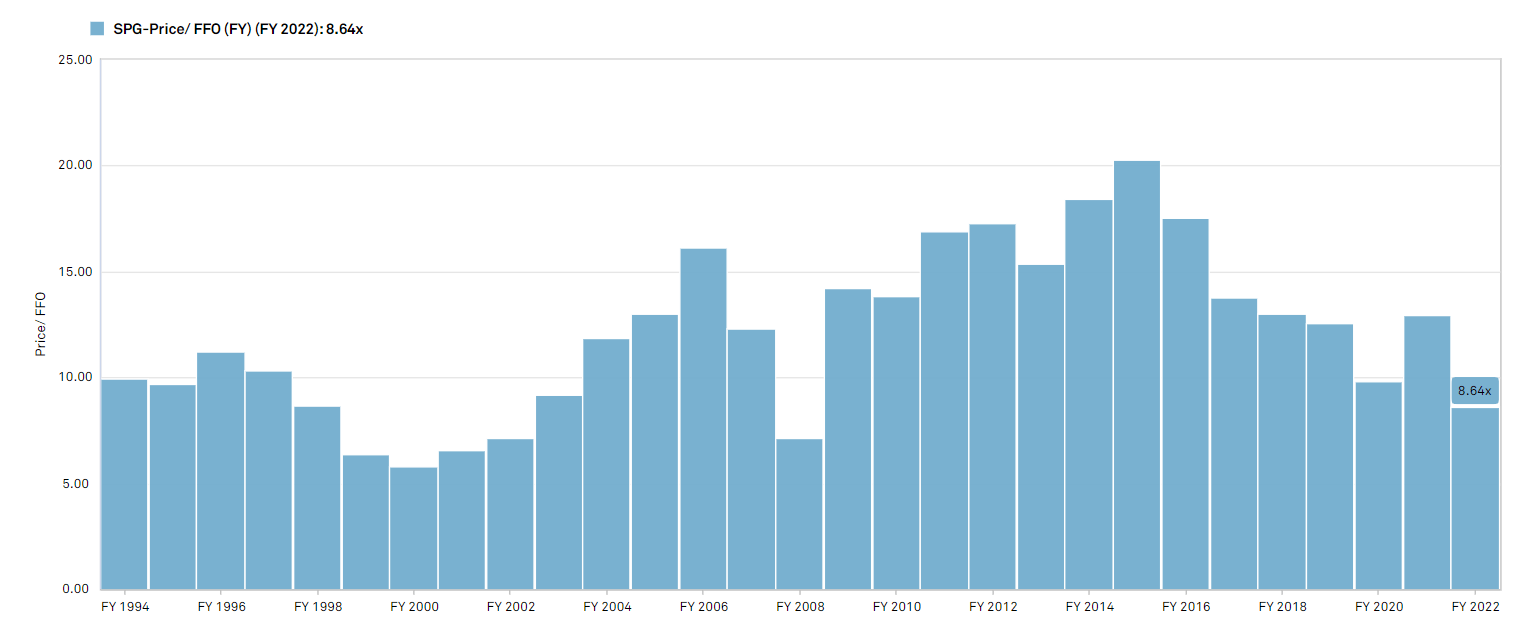
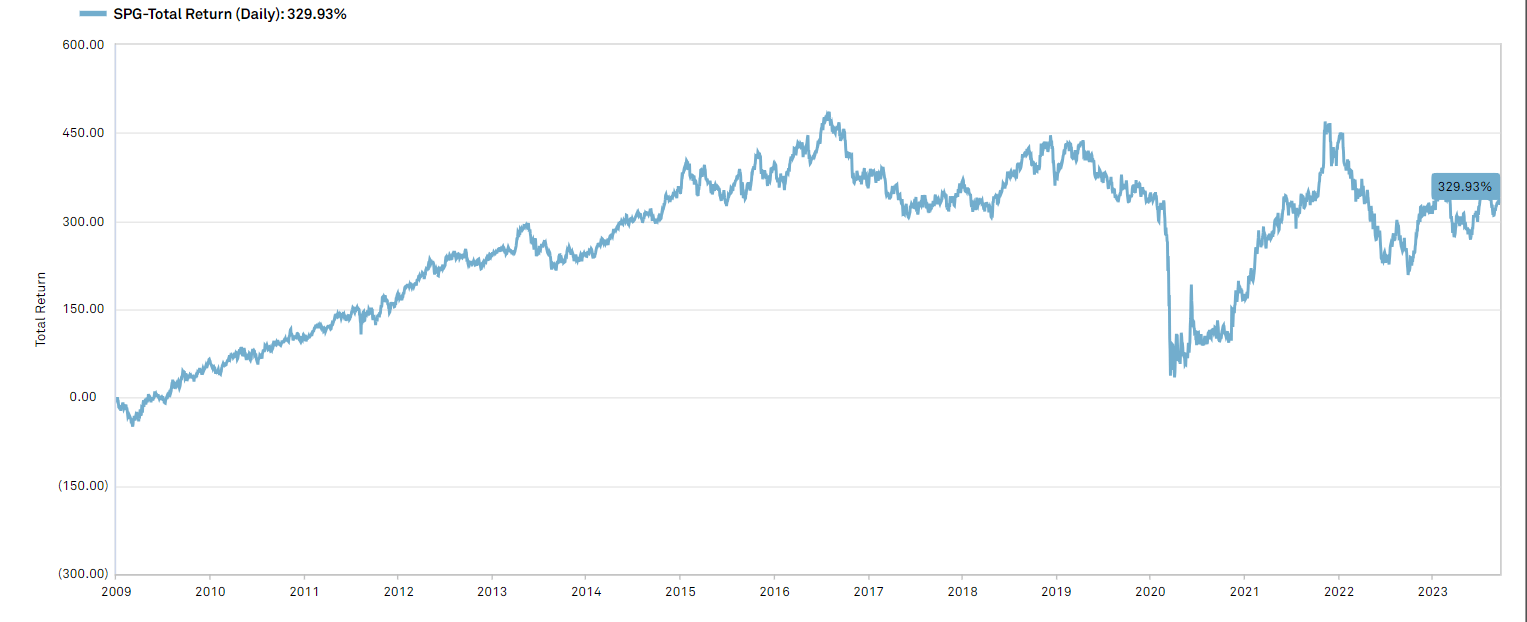
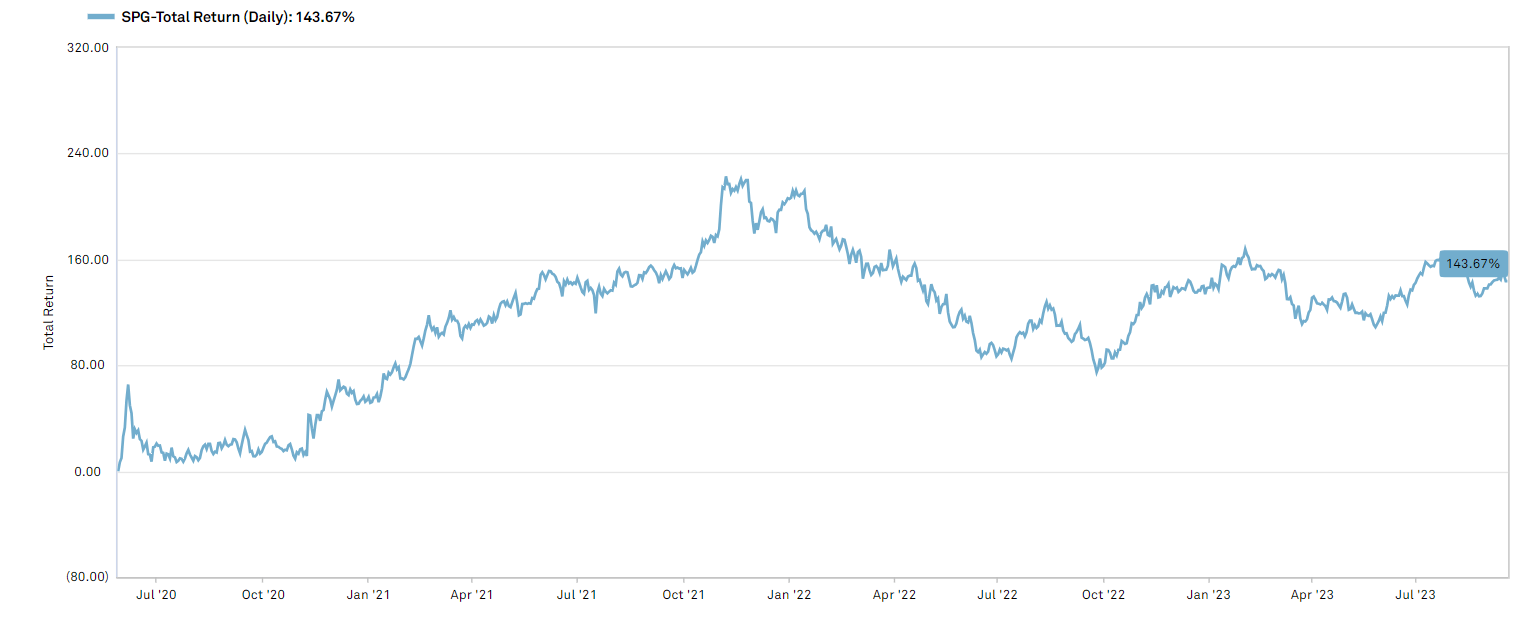
There were 3 times in the last 30 years where SPG traded as cheaply as it is today.
- 2000
- 2008
- 2020.
If one bought during any of those times, it was a great purchase.
S&P Global Market Intelligence S&P Global Market Intelligence S&P Global Market Intelligence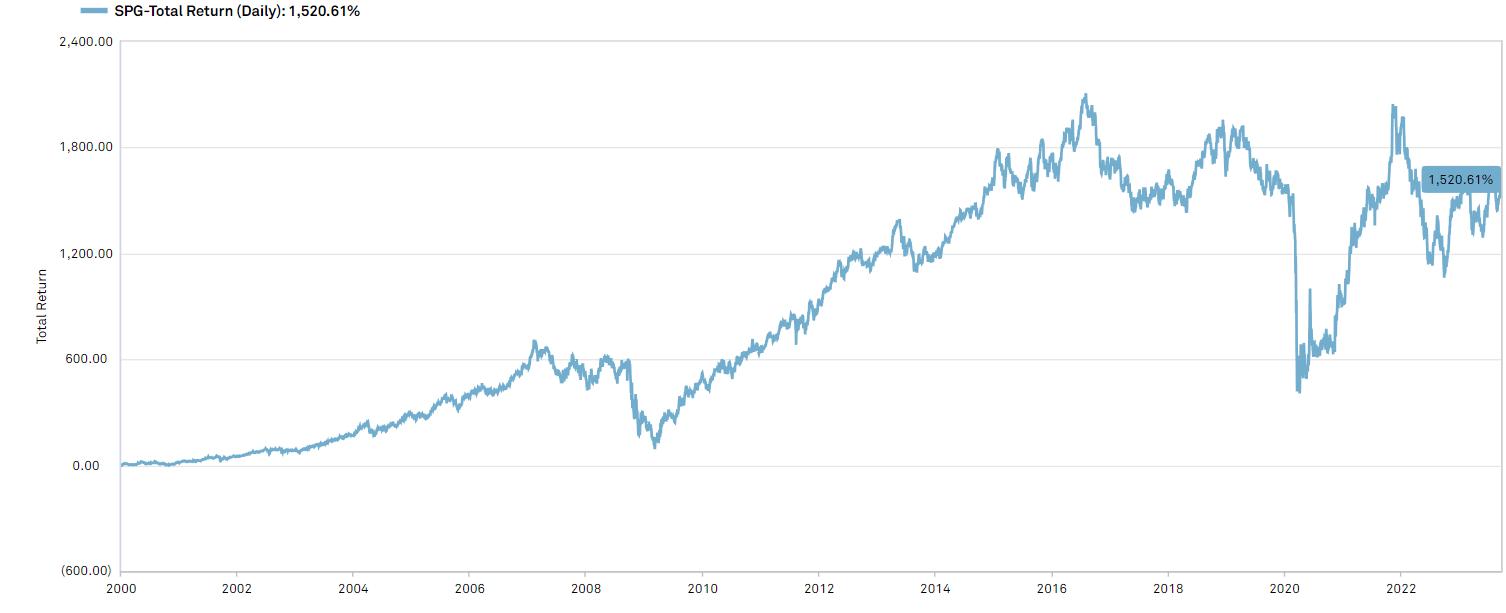
Today, the forward outlook looks rather similar. I think FFO/share will resume its upward trajectory. Analysts covering SPG seem to think so as well.
S&P Global Market Intelligence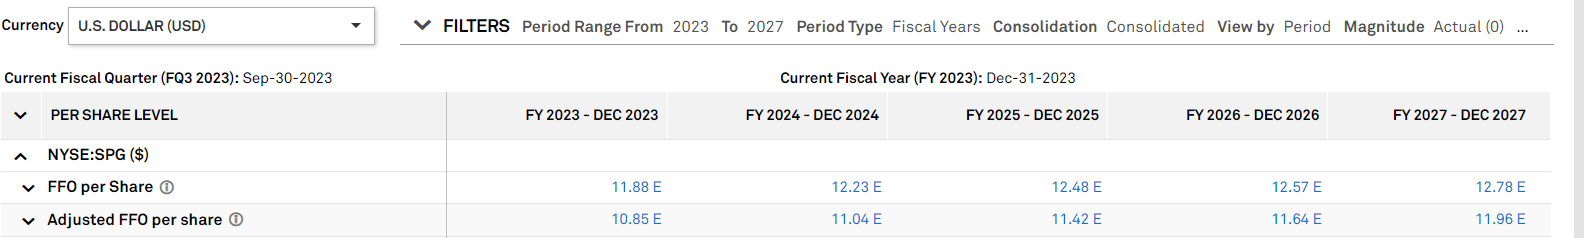
This sort of FFO/share growth is par-for-the-course in SPG’s 30+ year history.
The opportunity
This slow and steady growth would typically correspond to a 13X-15X multiple. Given SPG’s balance sheet, size, and track record, I think the 15X end is about right.
SPG’s consensus growth trajectory is incompatible with its 9.38X FFO multiple. Either the analysts are wrong about the growth, or the market is wrong to trade it this cheaply.
I think Simon Property Group, Inc. stock is substantially mispriced and intend to capture the return to a more historically normal multiple.
Yes, there are headwinds, but there have always been headwinds and they just don’t stop SPG from growing FFO/share.
Opportunistic Market Sale: 20% off for a limited time!
Right now there are abnormally great investment opportunities. With the market crash, some fundamentally strong stocks have gotten outrageously cheap and I want to show you how to take advantage and slingshot out of the dip.
To encourage readers to get in at this time of enhanced opportunity we are offering a limited time 20% discount to Portfolio Income Solutions. Our portfolio is freshly updated and chock full of babies that were thrown out with the market bathwater.
Grab your free trial today while these stocks are still cheap!