Some may have to pay the price. Roy Rochlin/Getty Images Entertainment
Get ready for charts, images, and tables because they are better than words. Your continued feedback is greatly appreciated, so please leave a comment with suggestions.
This one is going to be short and sweet. The volatility in Treasuries is creating havoc for analysts as it pushes share prices and interferes with fundamentals.
We recently had a special event!
Less than half of the yield on the 5-year Treasury is projected to be compensating for inflation. We can use the 5-year TIPS (Treasury Inflation-Protected Security) to break the yield on the 5-year Treasury into two batches:
- Yield on TIPS.
- Breakeven Inflation Rate (market-implied inflation projection).
Though we've seen the Federal Reserve having a fit about inflation, the market forecast for inflation has hardly changed in the last six months:
FRED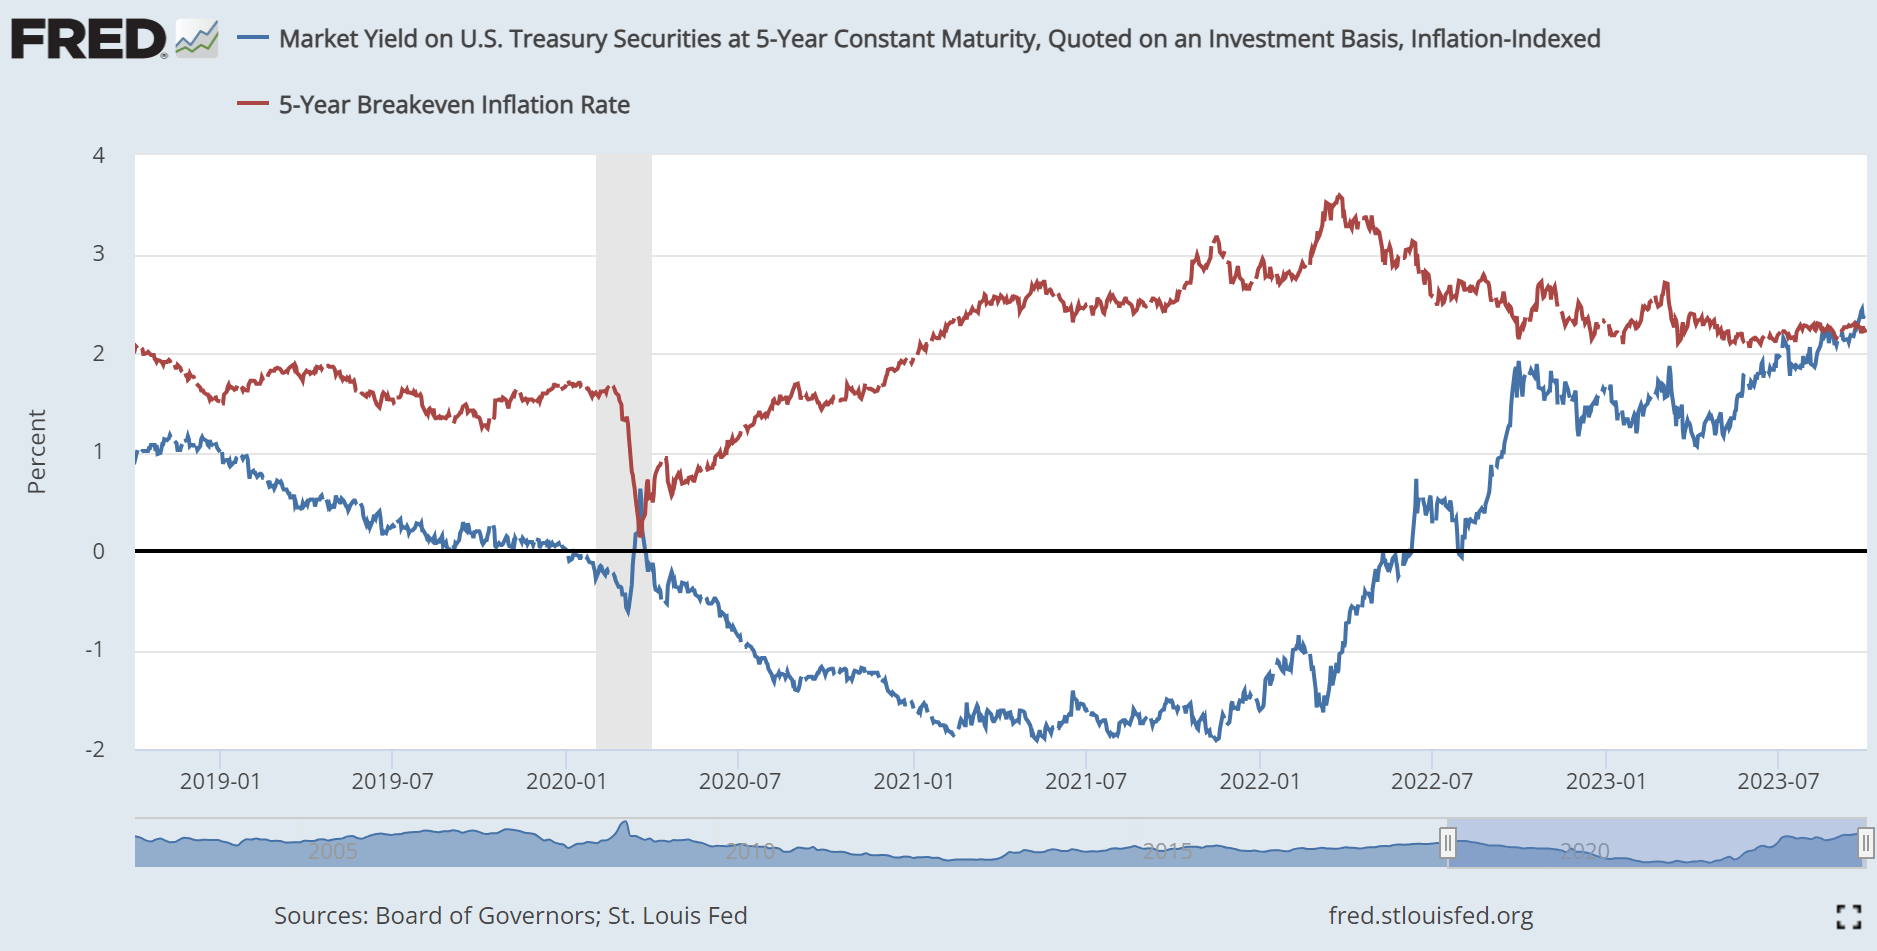
That's special. The market believes inflation already is going to be under control. That's particularly impressive given that the inflation metrics are still getting inflation from CPI: Shelter. The lagged shelter data is still propping up inflation. However, there's some pressure on inflation again thanks to higher oil prices. Of course, we can always stimulate oil production with higher interest rates, right?
No, the plan is to jack up rates until unemployment rises. Because the Federal Reserve can't fix supply, so it wants to reduce demand. The theory goes like this:
- Some people become unemployed, so total production goes down.
- The unemployed people can't afford to buy stuff, so demand goes down.
- Hope you're not one of those people.
- Some employed people try to save up more cash because they're living in fear of being the next unemployed.
- Consumers split a smaller pie.
Brilliant! That's just like capitalism was envisioned:
- The free market produces stuff seeking profits.
- The government interferes by running a huge deficit (which produces more dollars) while restricting supply.
- Inflation kicks into high gear as the money cycles throughout the economy.
- The Federal Reserve jacks up rates on debt to weaken the economy.
- The Federal Reserve aims to reduce employee bargaining positions to ensure wages don't catch inflation.
That's how we do capitalism now. Why?
Because of these processes:
- Production.
- Distribution.
- Pricing of goods and services.
Those processes are apparently just too important to entrust to the free market.
What Happened to Mortgage REITs?
Many of them own assets that are exposed to interest rate risk. Here's the pricing for a 30-year fixed-rate agency mortgage-backed security with a 6% coupon rate:
MBSLive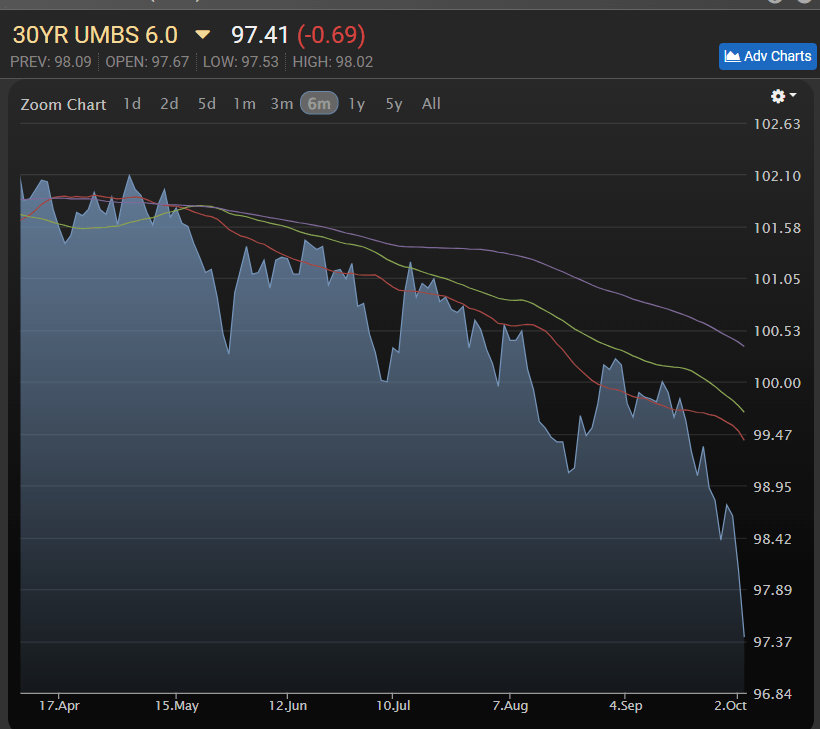
Imagine that you own a leveraged position in those and hedge part (not all, not almost all) of the duration risk.
Feels awful, right?
Of course, most mortgage REITs also own many positions with lower coupon rates. Did those plunge also?
MBSLive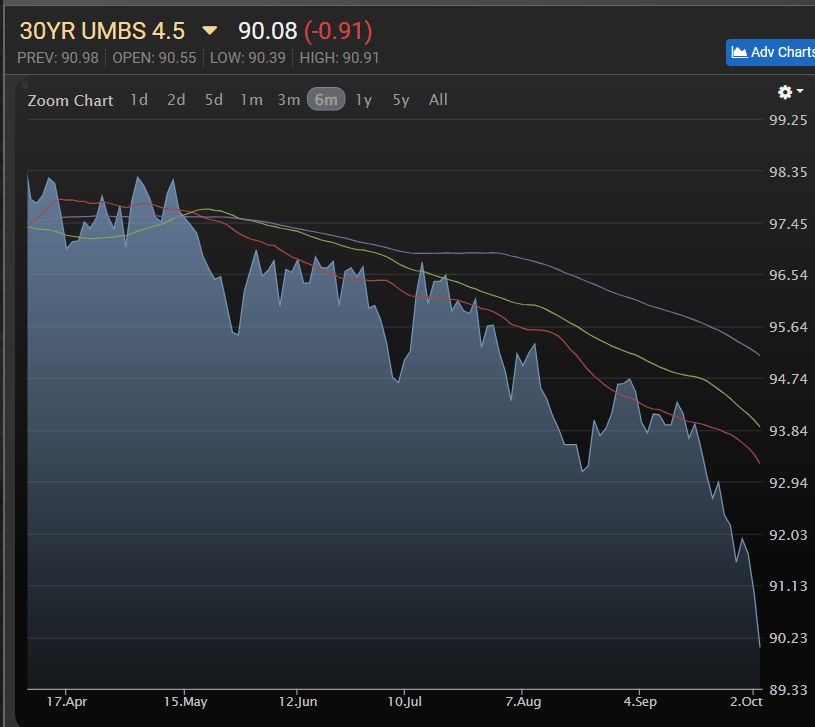
Yes. Obviously, they got hit also.
Inflation
What's pressing inflation?
Well, one factor is oil. High oil prices are bad for just about everything.
MarketWatch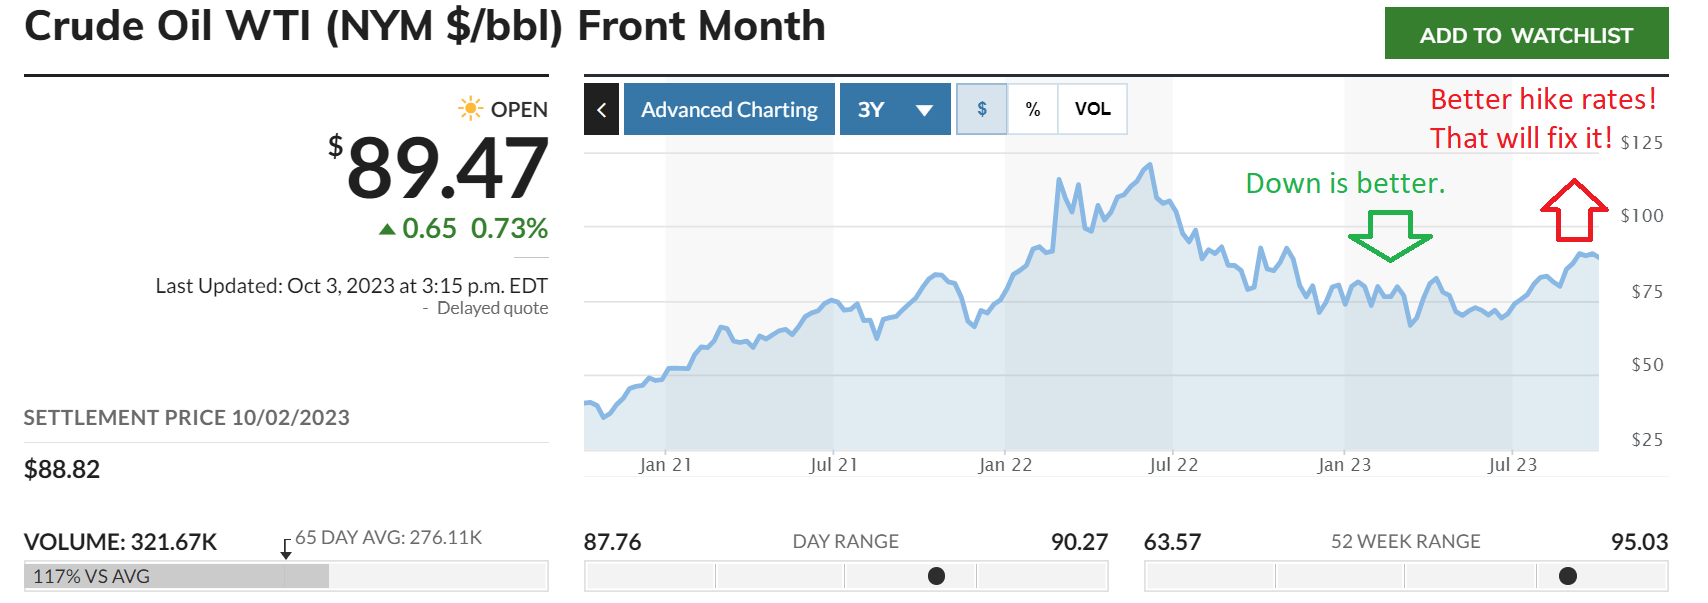
Clearly, hiking rates won't fix this.
Damage to Mortgage REIT Book Values
We have our estimates for the end of the quarter. Expect book values to decline in the range of 1.5% to 18.5%. Yes, that's a huge gap. I'm not posting all the individual estimates in the article. However, I'll allow voting in the comments. I'll pick one of the most mentioned tickers and post our projections for BV and earnings.
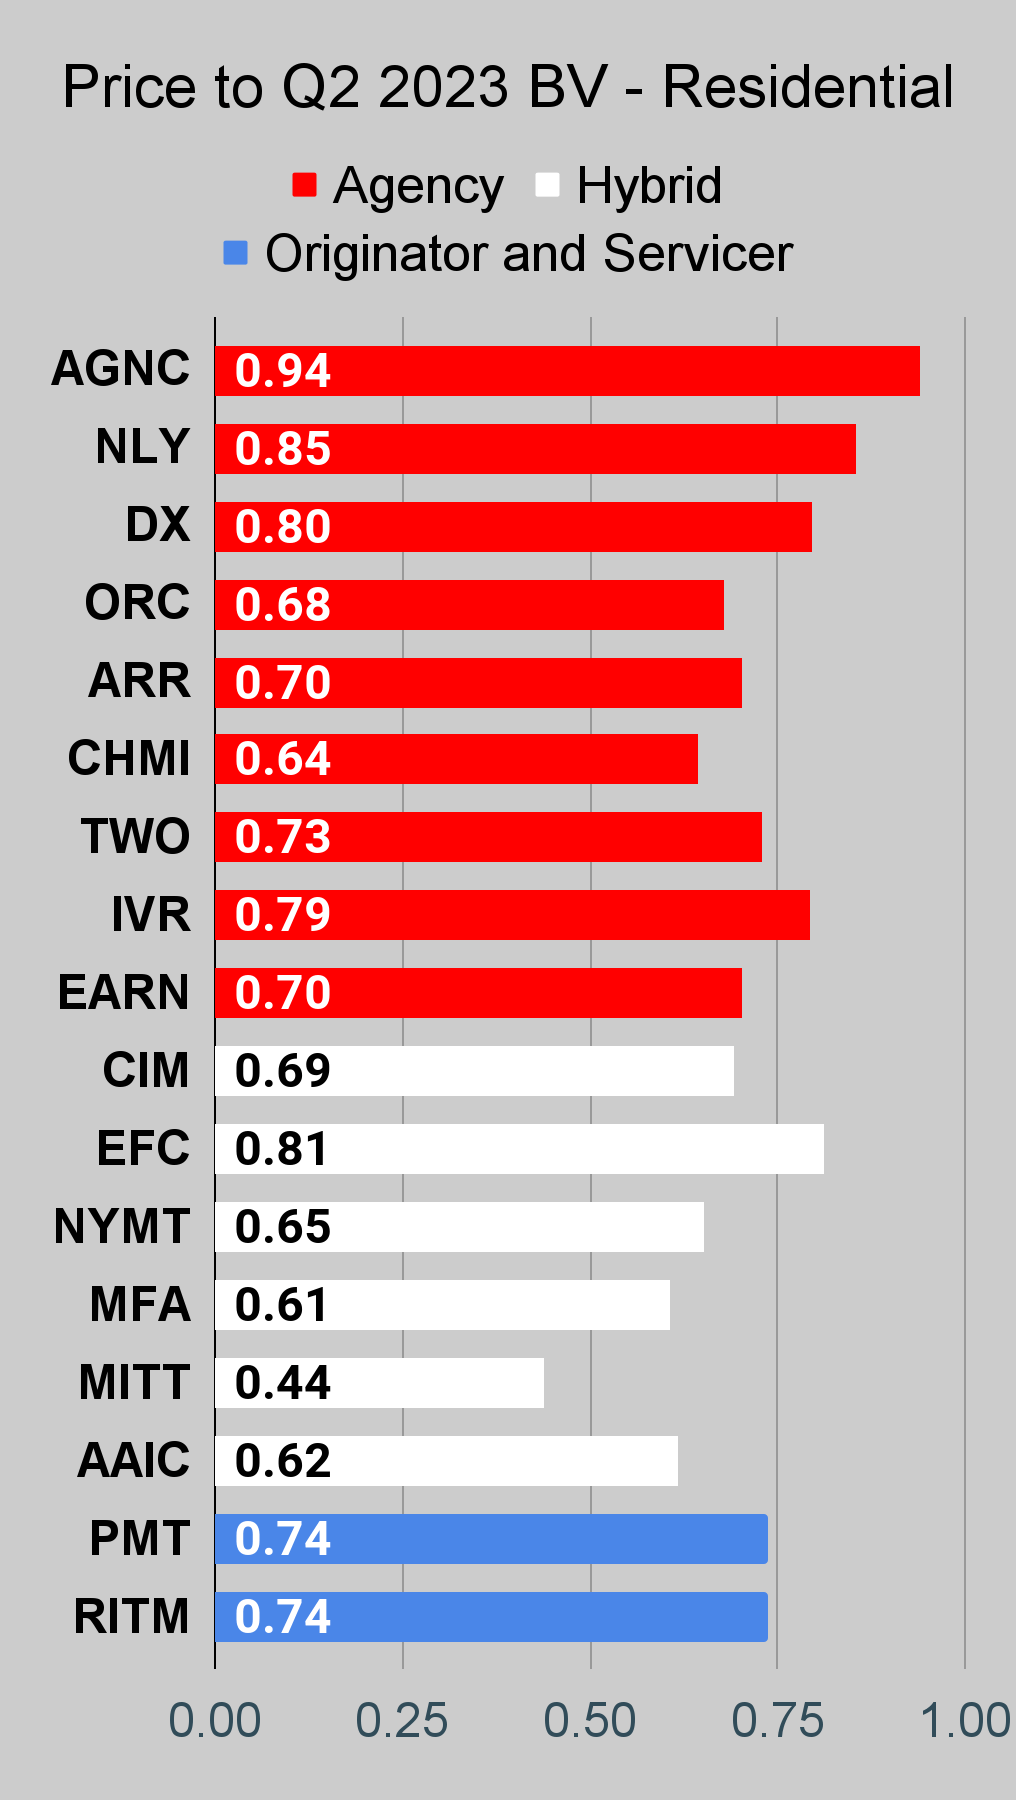
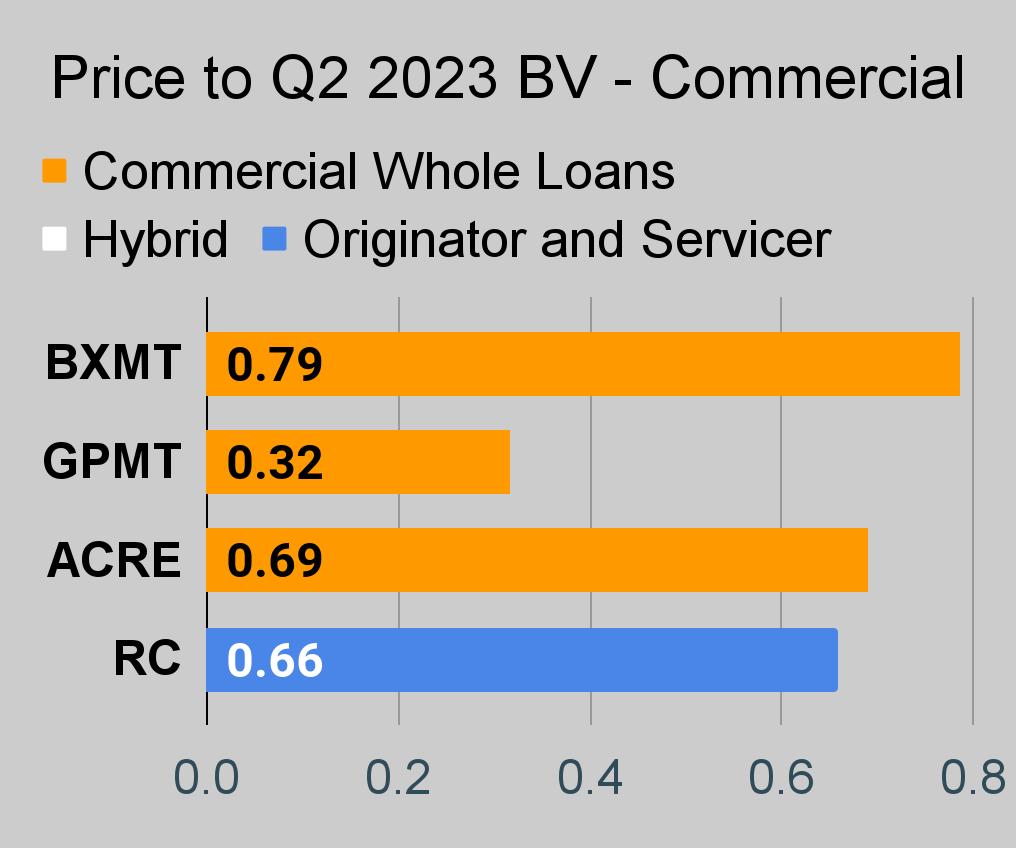
In general, the biggest losses in book value are in agency mortgage REITs. Projected losses for originator / servicer mortgage REITs (like RITM, PMT, and RC) are smaller. Hybrid mortgage REITs are in between. Commercial mortgage REIT projected losses are still generally small, but assets aren't marked to market so take that with a bit of salt.
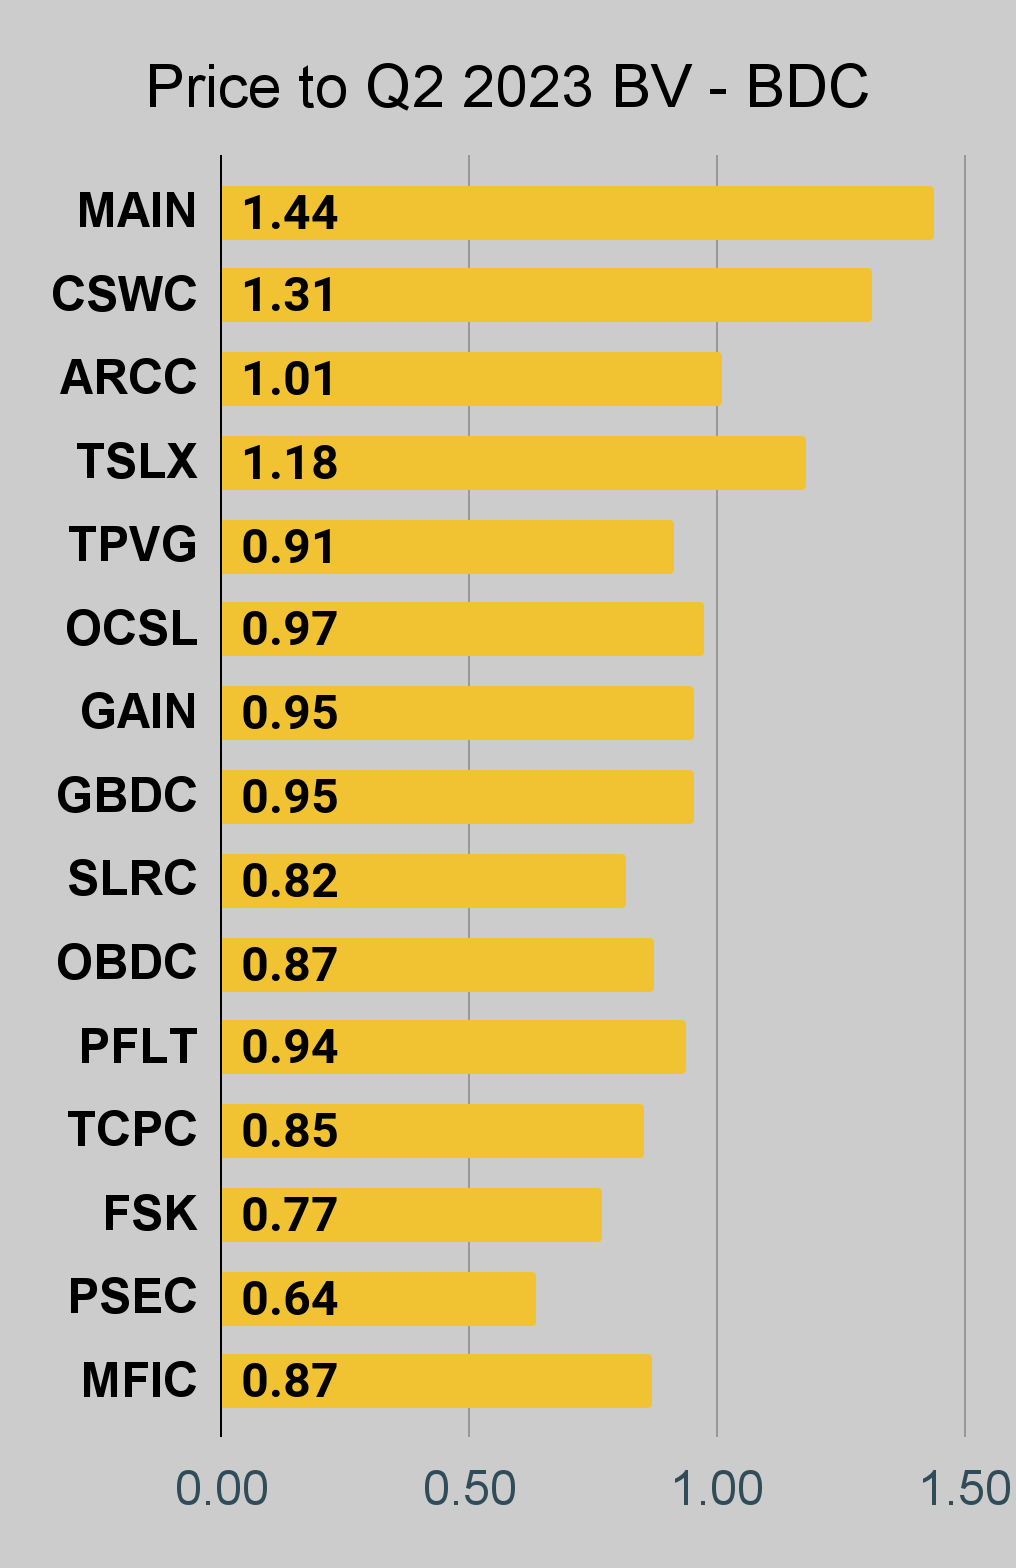
In general, BDC book values should be fine. Expect most to land between +1.5% and -3%. Which one is projected to have the best quarterly change in book value per share? MAIN. Projected change of +1.5%.
How much are mortgage REITs down? Quite a bit, depending on the starting point and which shares you choose. Here's a chart showing how much needed to be invested on any prior day to have $100k today. I included one of my favorite targets for trashing:
The REIT Forum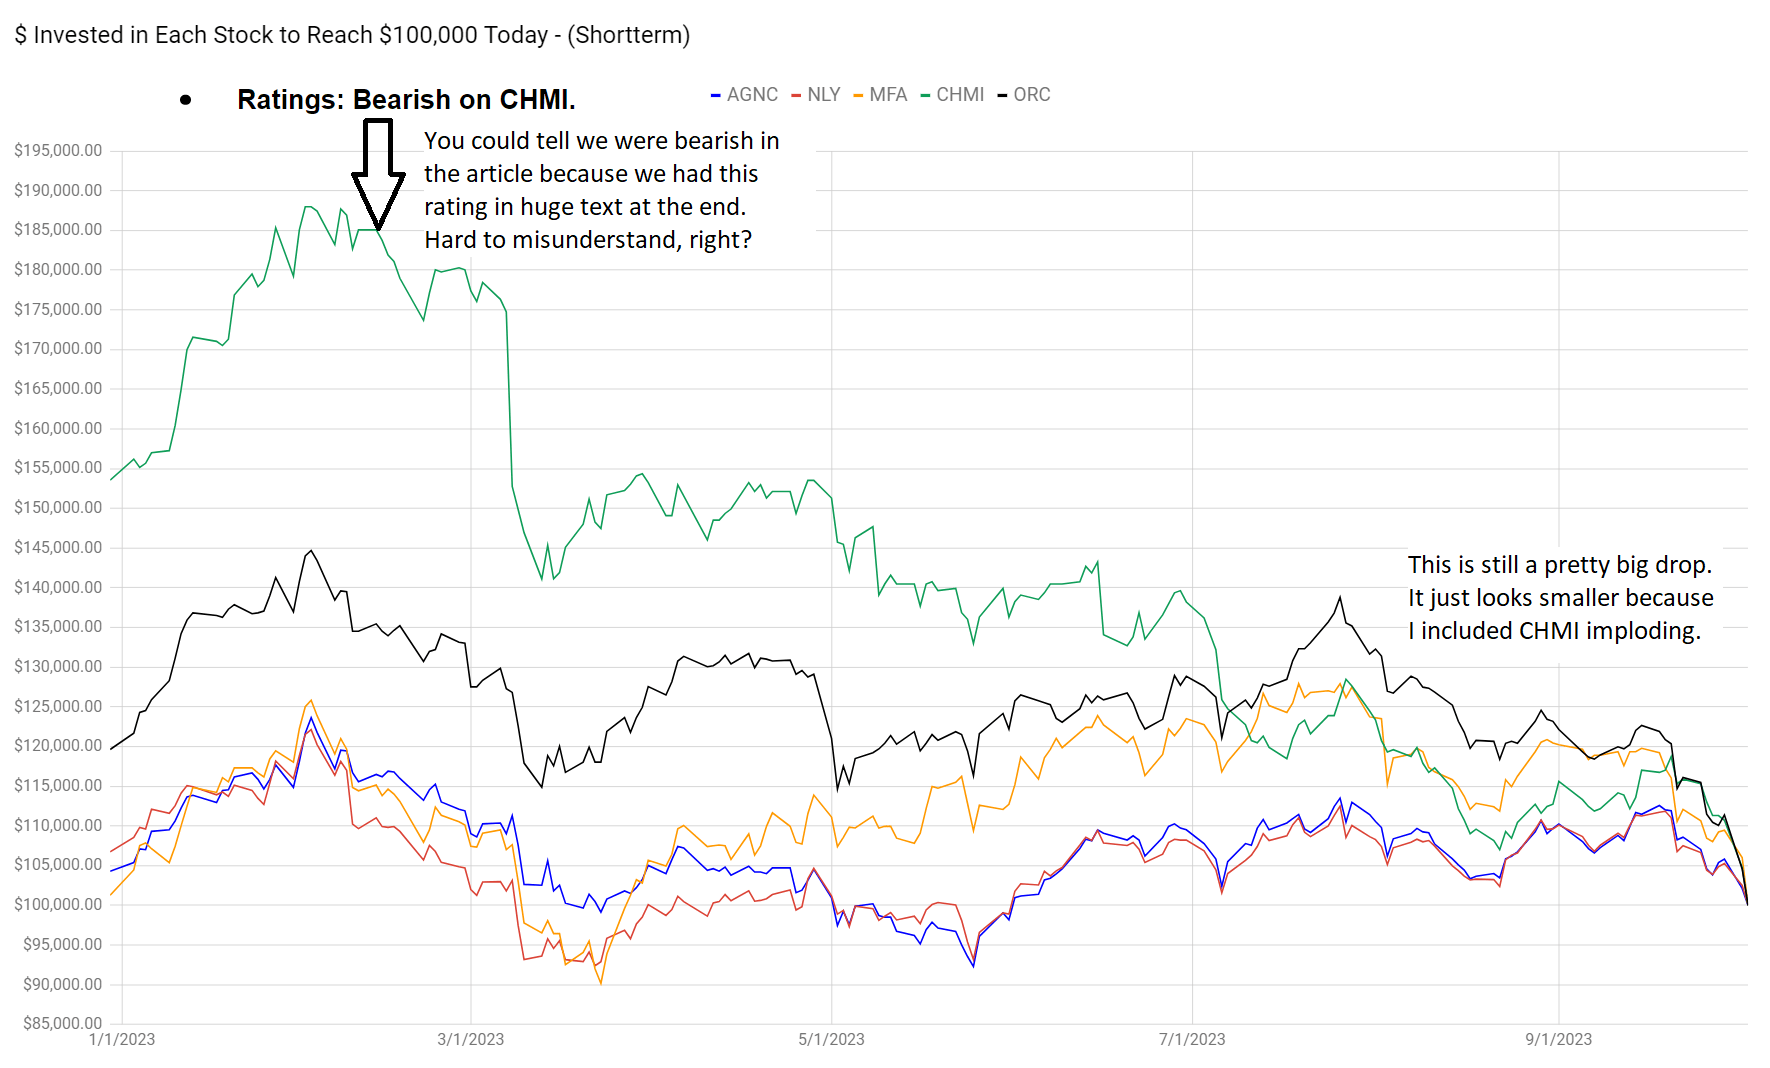
Stock Table
We will close out the rest of the article with the tables and charts we provide for readers to help them track the sector for both common shares and preferred shares.
We're including a quick table for the common shares that will be shown in our tables:
Type of REIT or BDC | ||||
Residential Agency | Residential Hybrid | Residential Originator and Servicer | Commercial | BDC |
If you're looking for a stock and I haven't mentioned it yet, you'll still find it in the charts below. The charts contain comparisons based on price-to-book value, dividend yields, and earnings yield. You won't find these tables anywhere else.
For mortgage REITs, please look at the charts for AGNC, NLY, DX, ORC, ARR, CHMI, TWO, IVR, EARN, CIM, EFC, NYMT, MFA, MITT, AAIC, PMT, RITM, BXMT, GPMT, WMC, and RC.
For BDCs, please look at the charts for MAIN, CSWC, ARCC, TSLX, TPVG, OCSL, GAIN, GBDC, SLRC, OBDC, PFLT, TCPC, FSK, PSEC, and MFIC.
This series is the easiest place to find charts providing up-to-date comparisons across the sector.
Warning
Book values changed dramatically during Q3 2023. Relying on mortgage REIT trailing book value would be very unwise. Especially for agency mortgage REITs. The values for BDCs didn't change much.
Residential Mortgage REIT Charts
Note: The chart for our public articles uses the book value per share from the latest earnings release. Current estimated book value per share is used in reaching our targets and trading decisions. It's available in our service, but those estimates are not included in the charts below. PMT and NYMT are not showing an earnings yield metric as neither REIT provides a quarterly "Core EPS" metric. Presently, a few other REITs also have no consensus estimate.
Second Note: Due to the way historical amortized cost and hedging is factored into the earnings metrics, it's possible for two mortgage REITs with similar portfolios to post materially different metrics for earnings. I would be very cautious about putting much emphasis on the consensus analyst estimate (which is used to determine the earnings yield). In particular, throughout late 2022 the earnings metric became less comparable for many REITs.
 The REIT Forum | 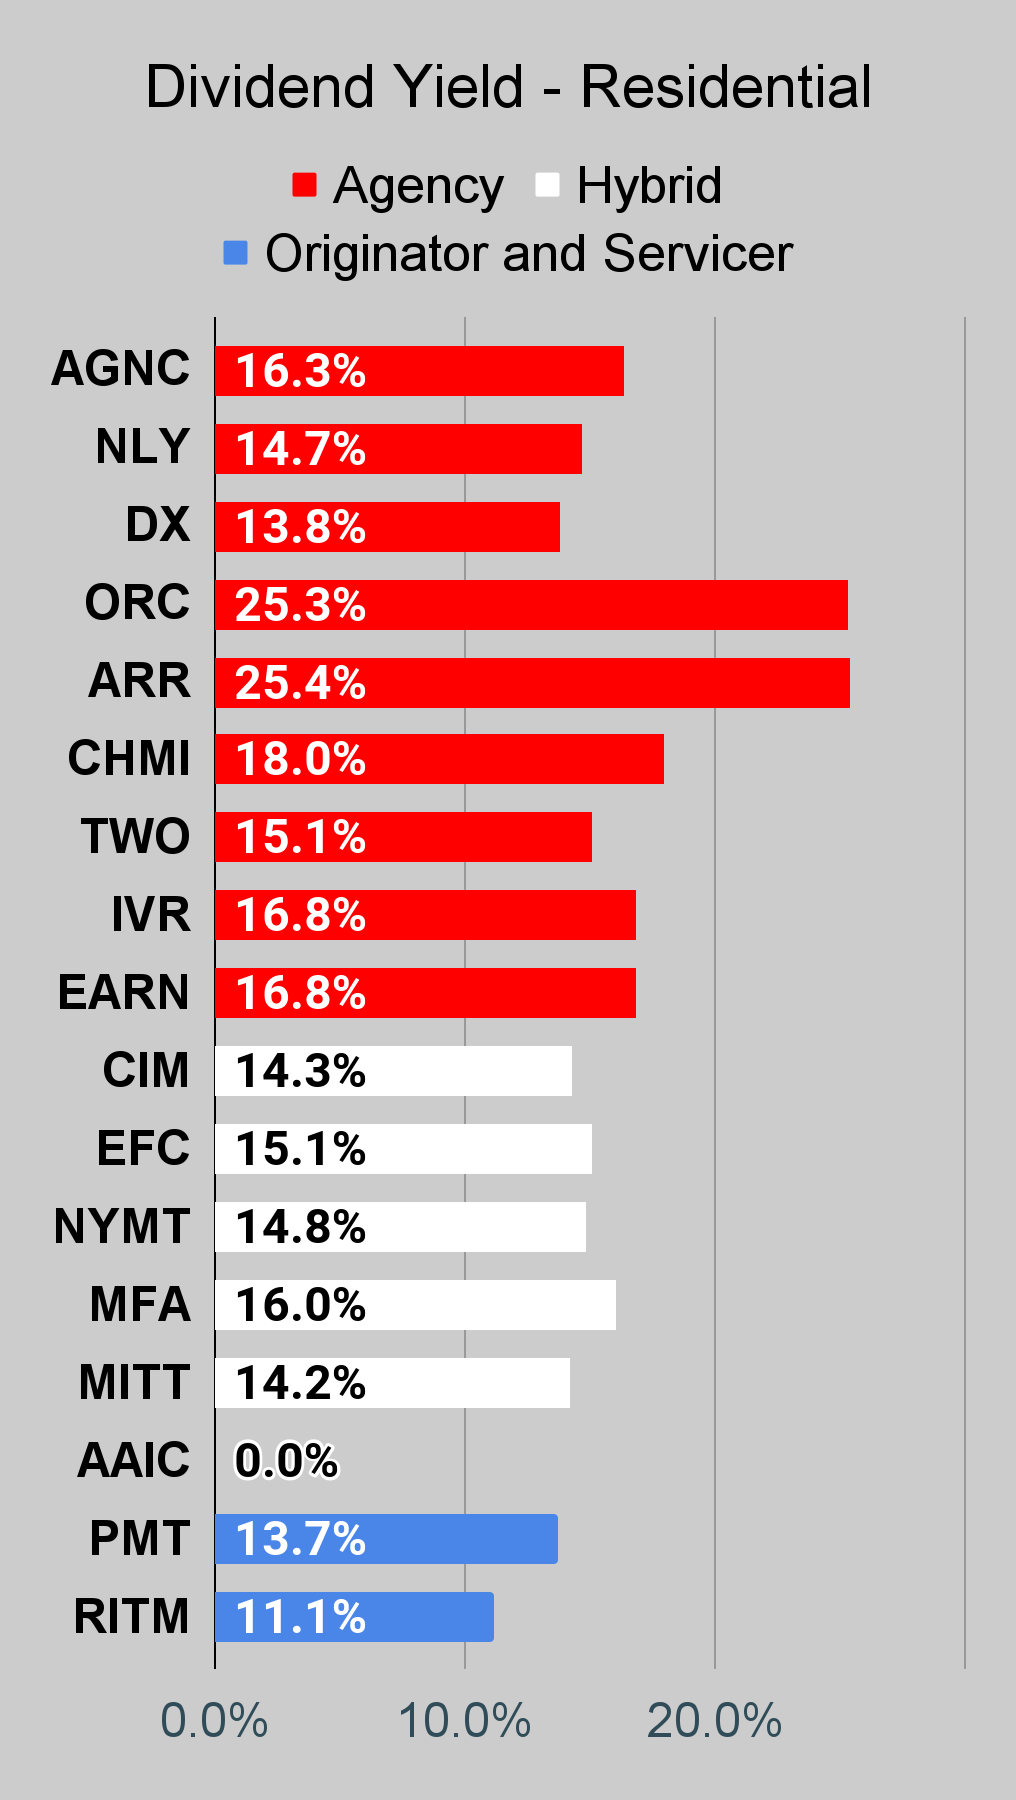 The REIT Forum | 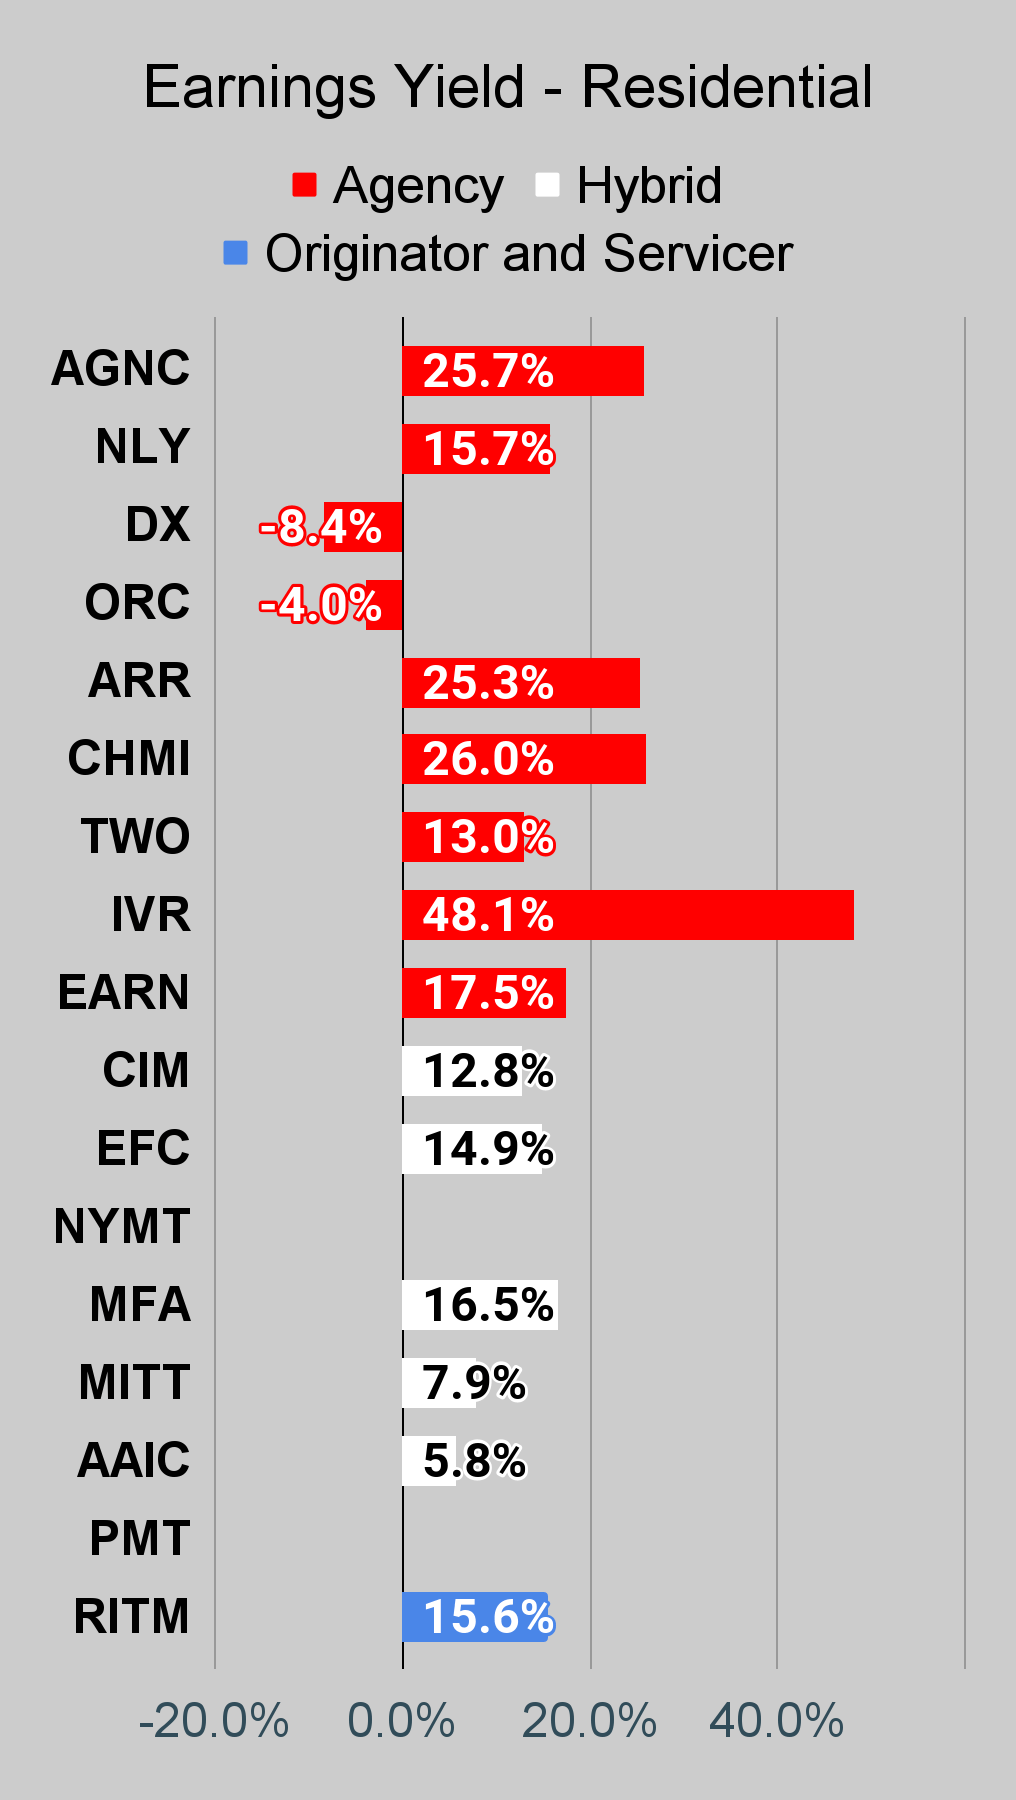 The REIT Forum |
Commercial Mortgage REIT Charts
 The REIT Forum | 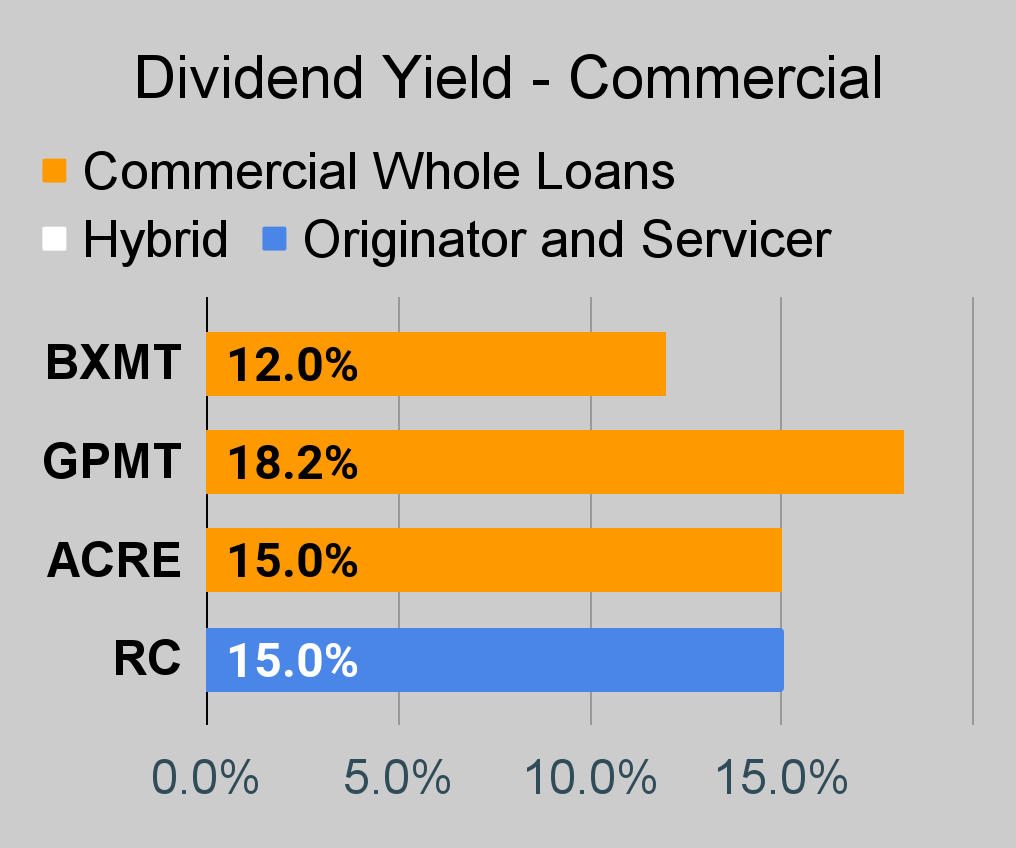 The REIT Forum | 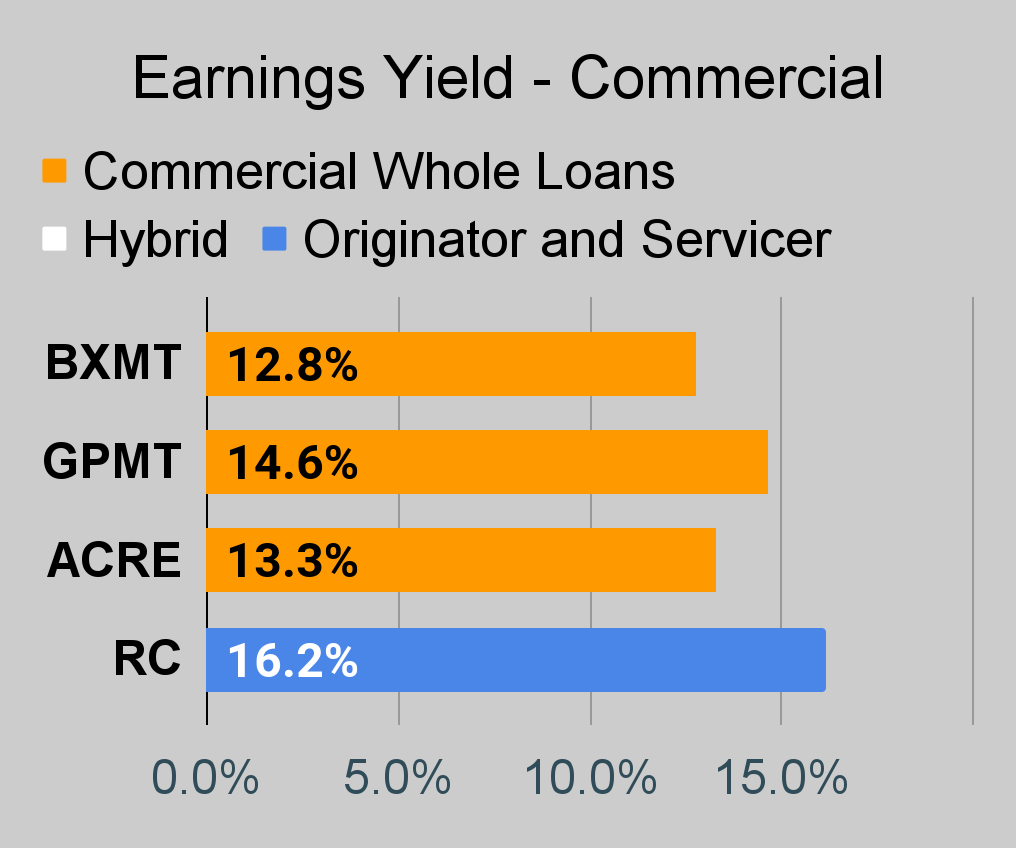 The REIT Forum |
BDC Charts
 The REIT Forum | 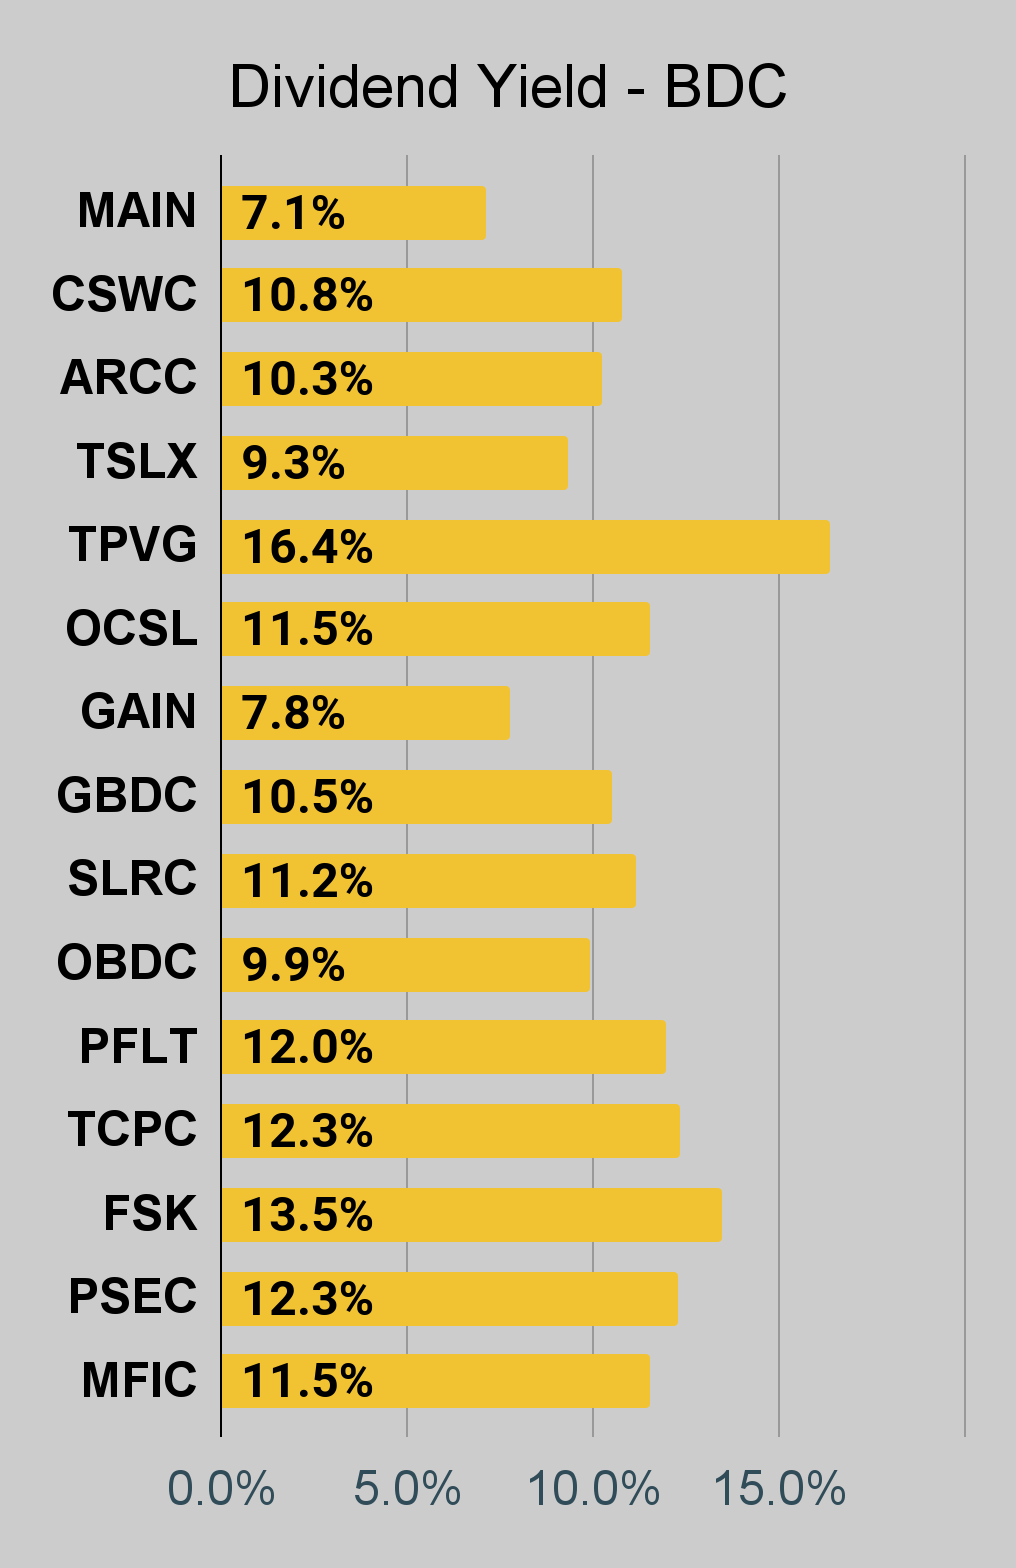 The REIT Forum | 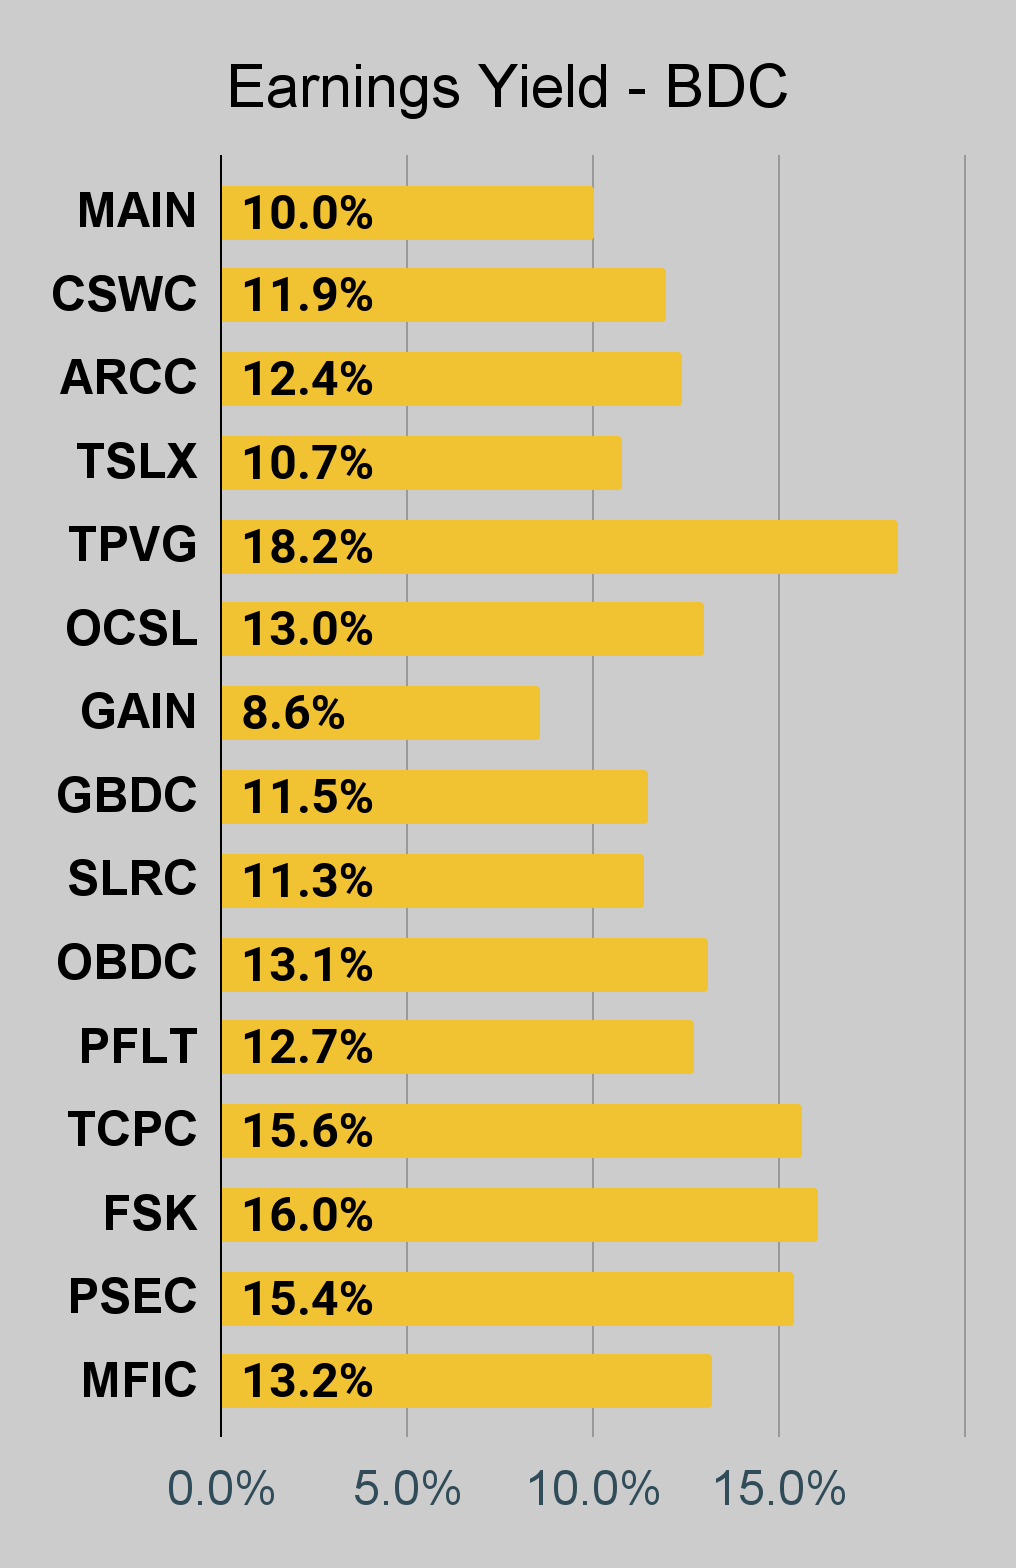 The REIT Forum |
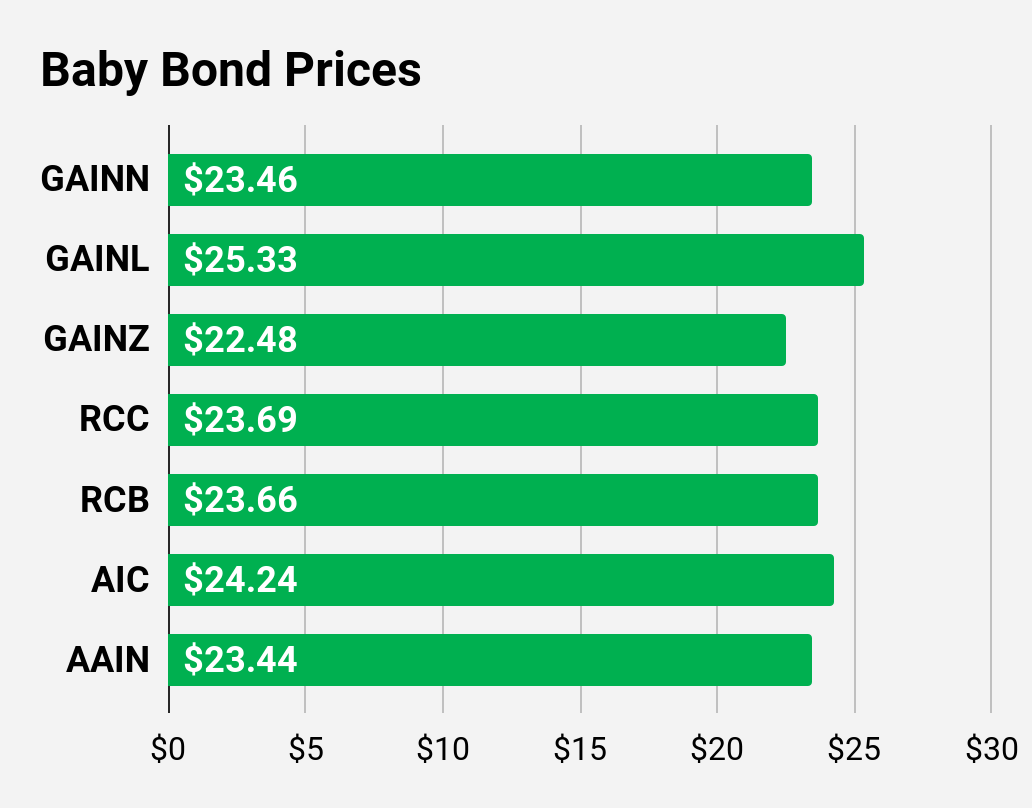
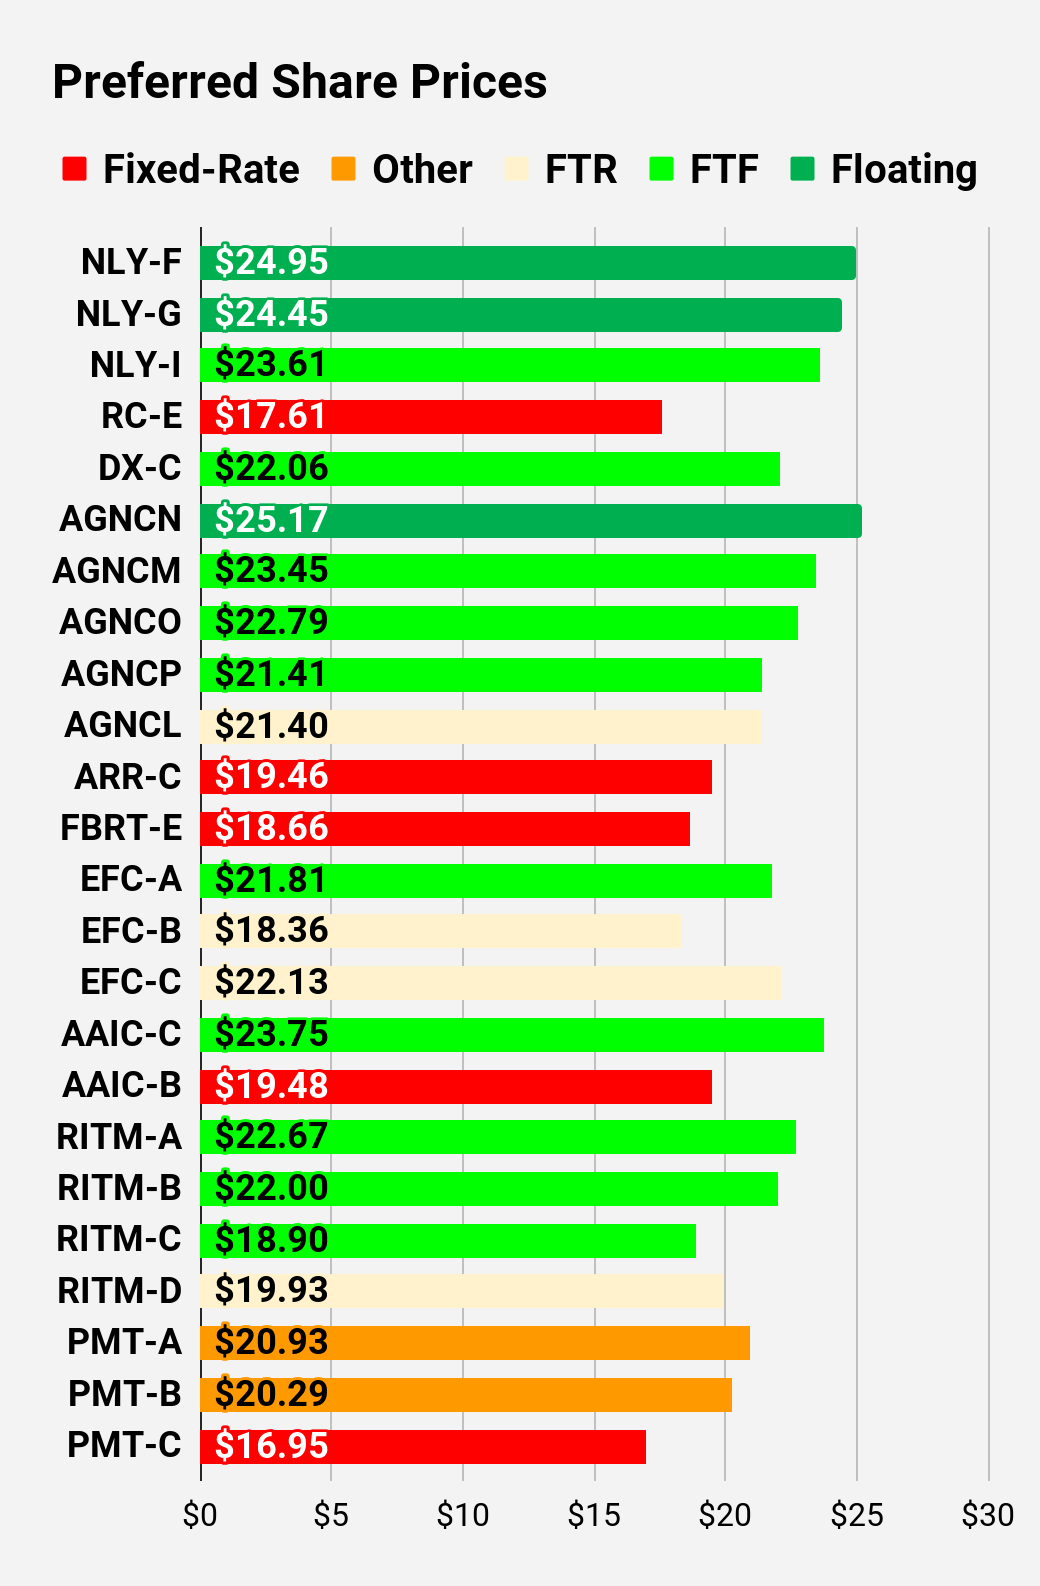
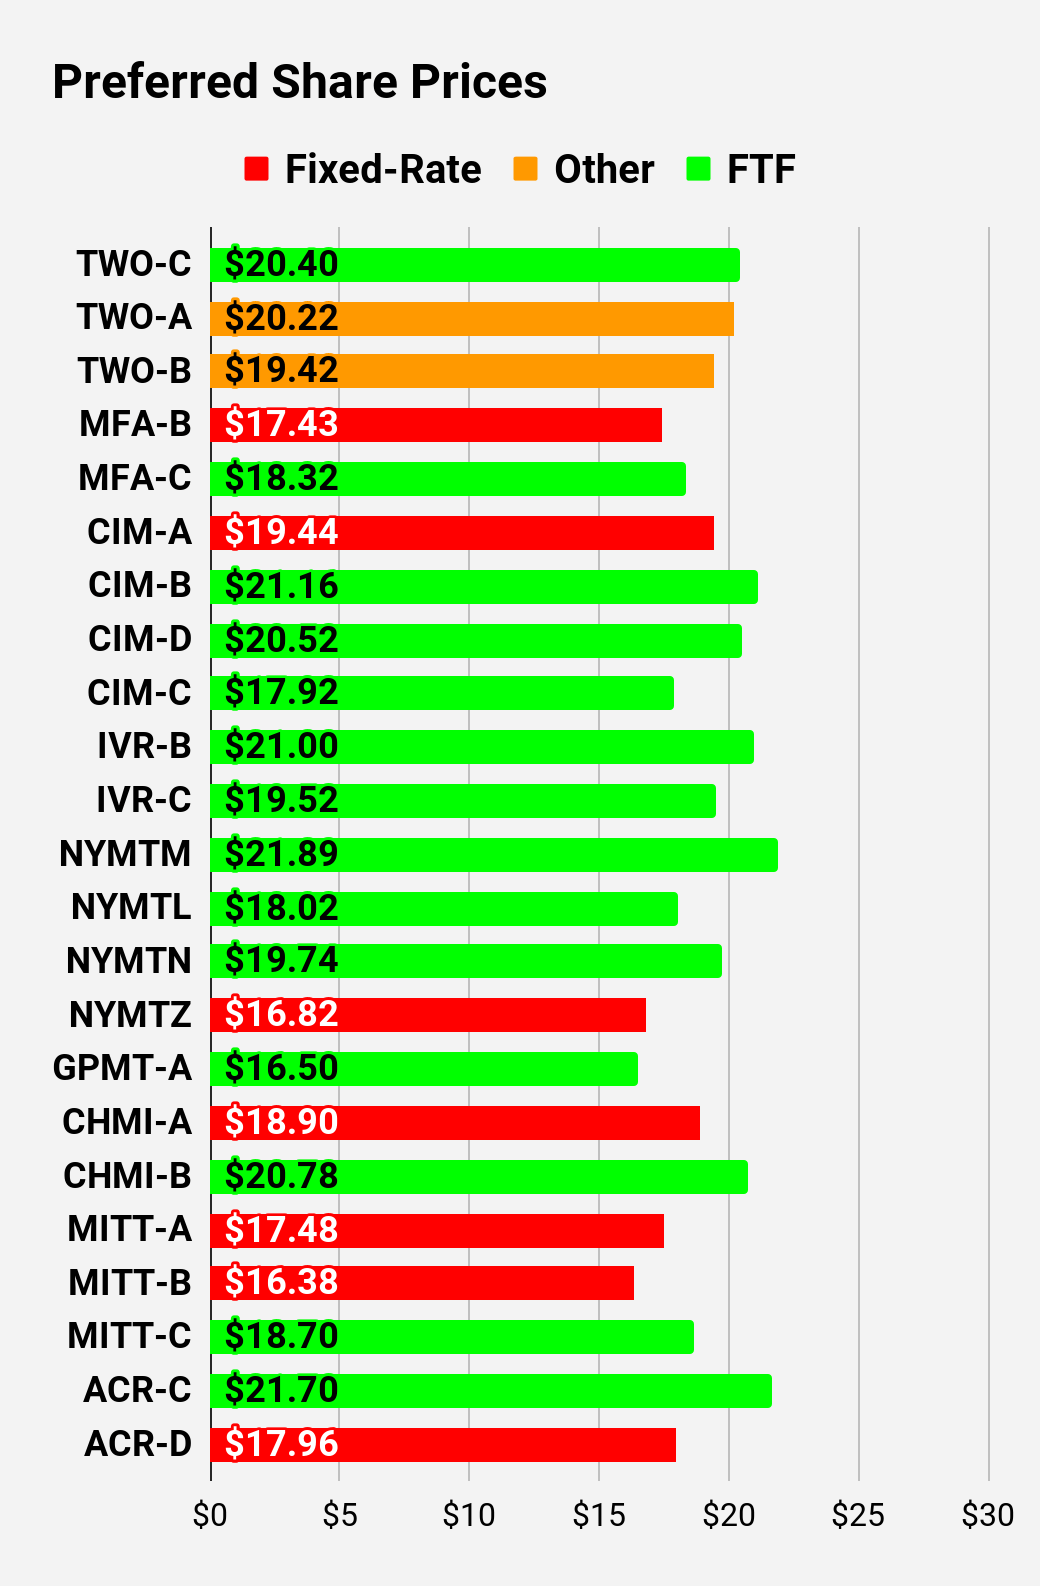
Preferred Share and Baby Bond Charts
I changed the coloring a bit. We needed to adjust to include that the first fixed-to-floating shares have transitioned over to floating rates. When a share already is floating, the stripped yield may be different from the "Floating Yield on Price" due to changes in interest rates. For instance, NLY-F already has a floating rate. However, the rate is only reset once per three months. The stripped yield is calculated using the upcoming projected dividend payment and the "Floating Yield on Price" is based on where the dividend would be if the rate reset today. In my opinion, for these shares the "Floating Yield on Price" is clearly the more important metric.
 The REIT Forum | 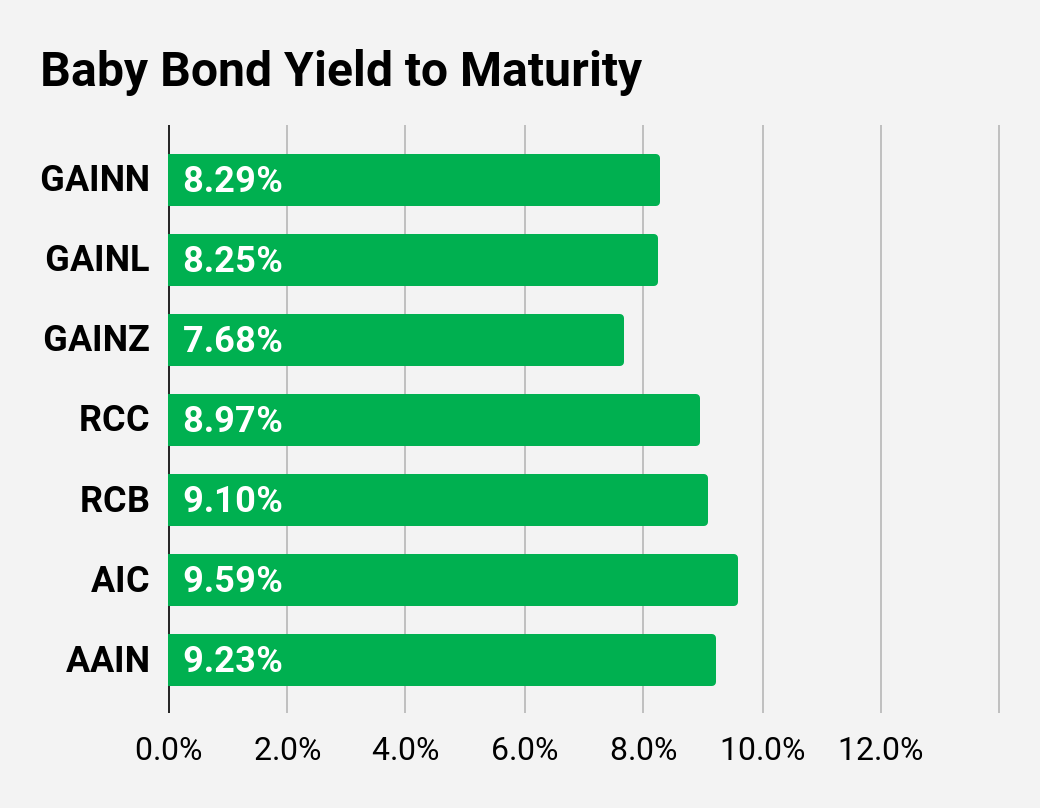 The REIT Forum | 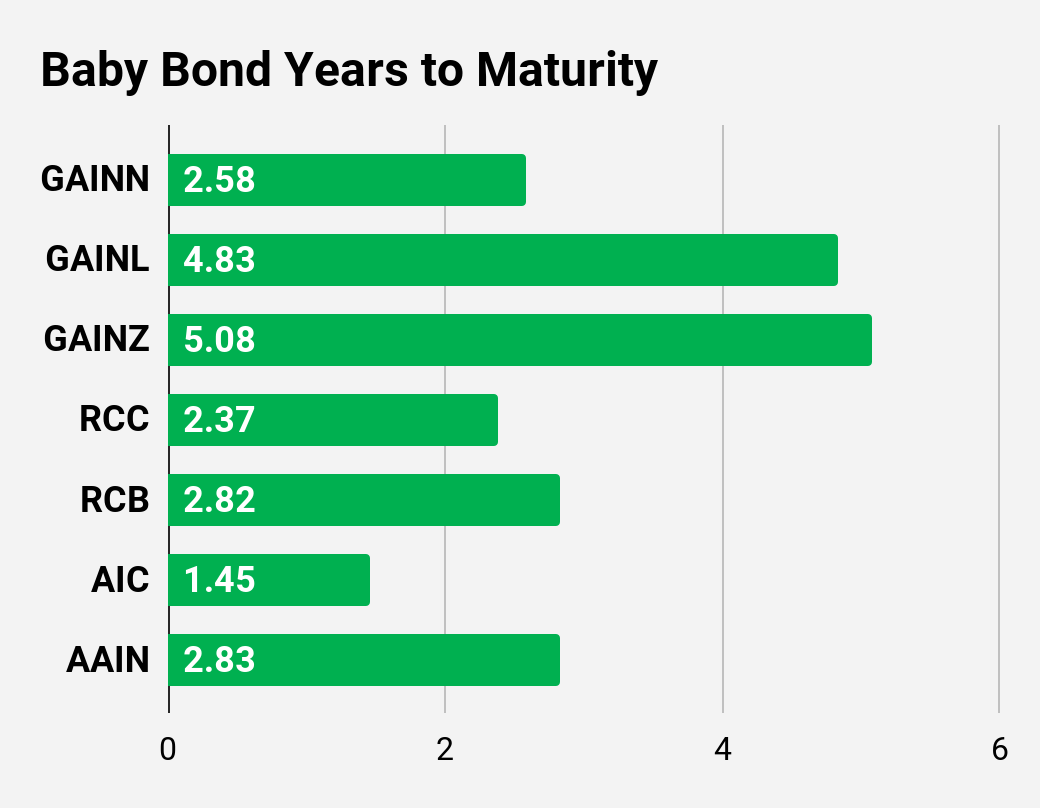 The REIT Forum |
 The REIT Forum | 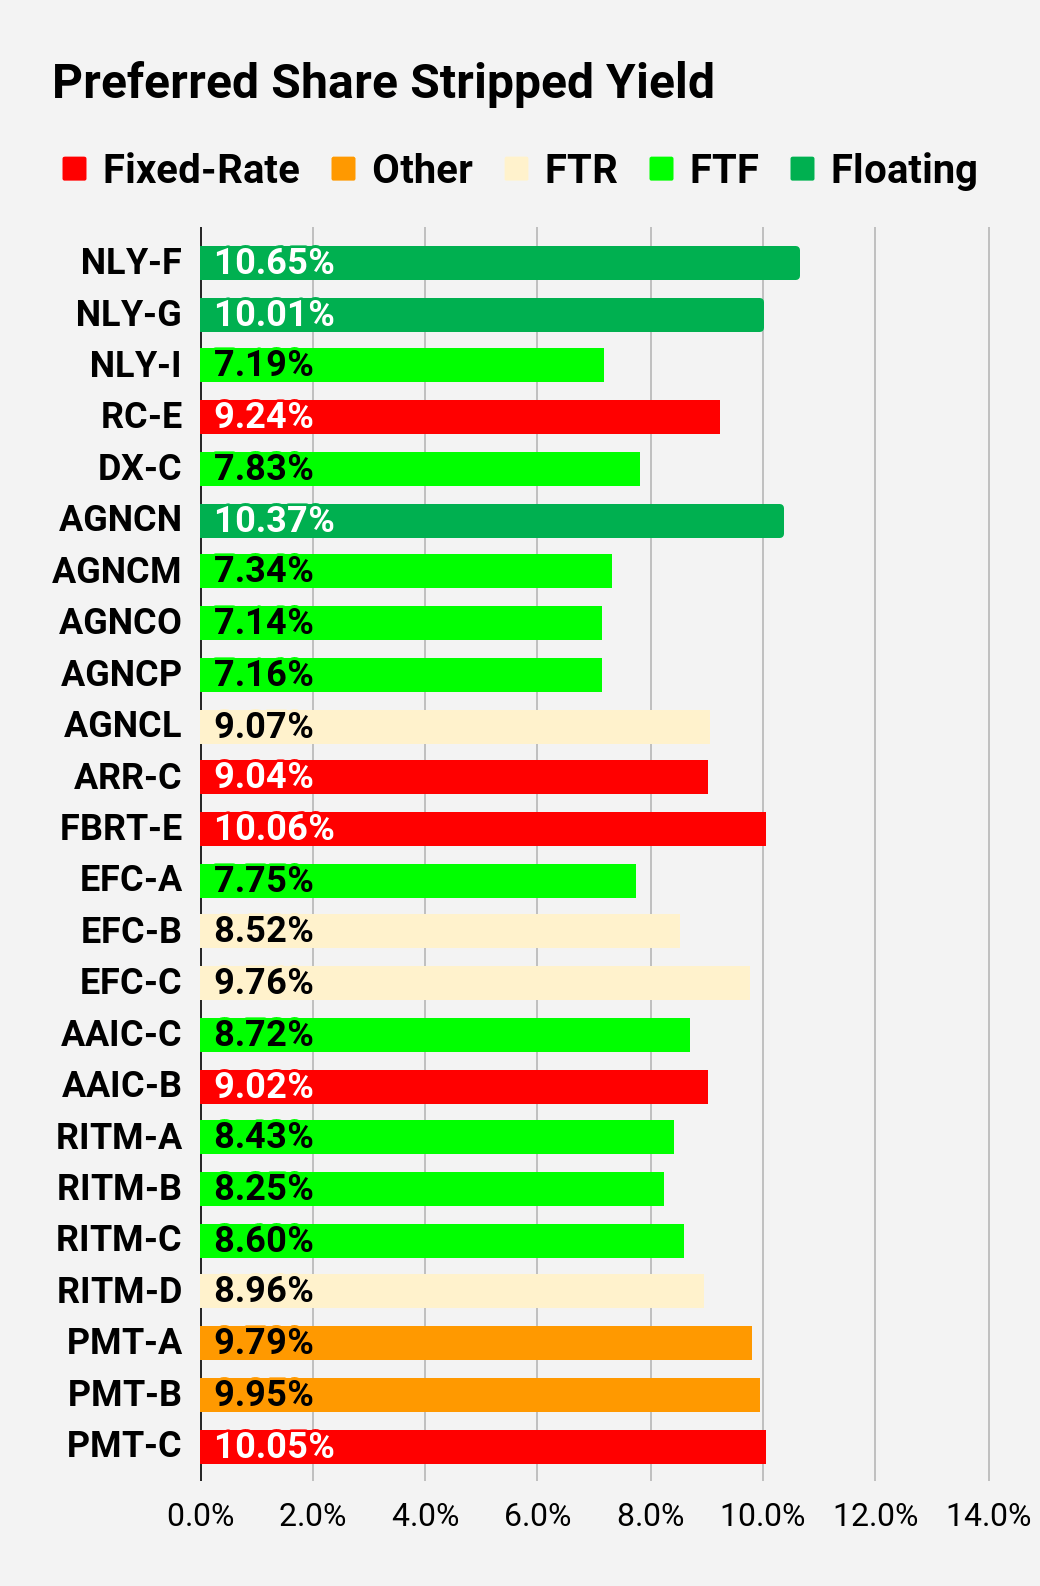 The REIT Forum | 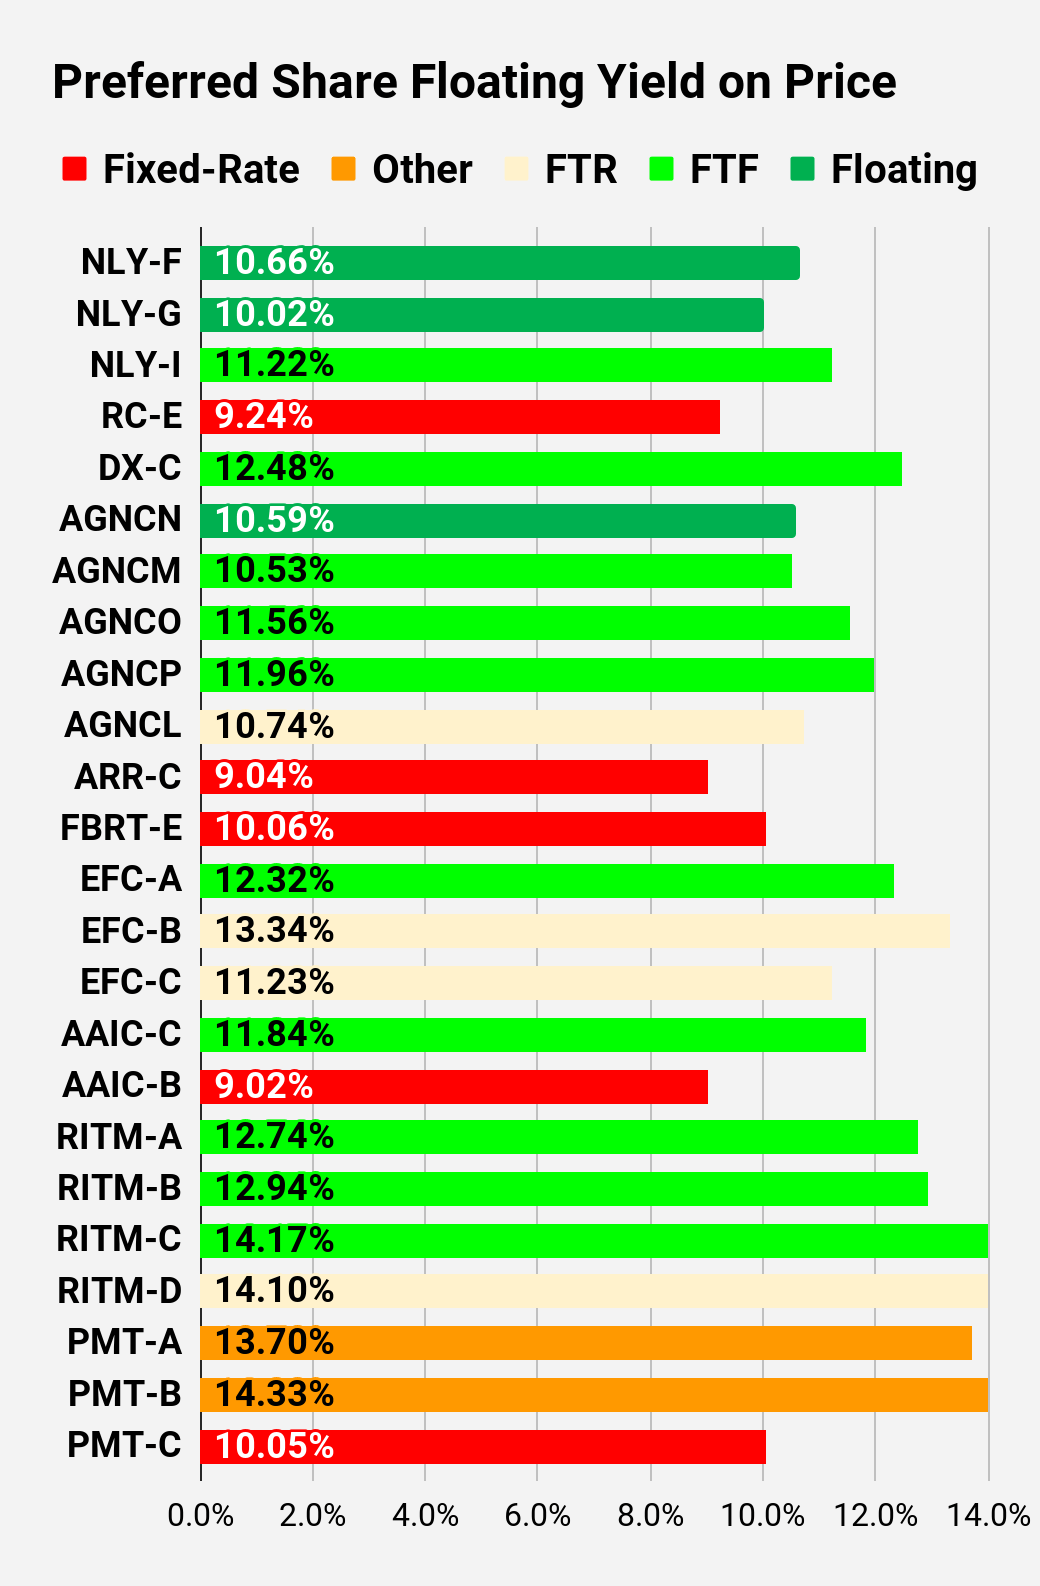 The REIT Forum |
 The REIT Forum | 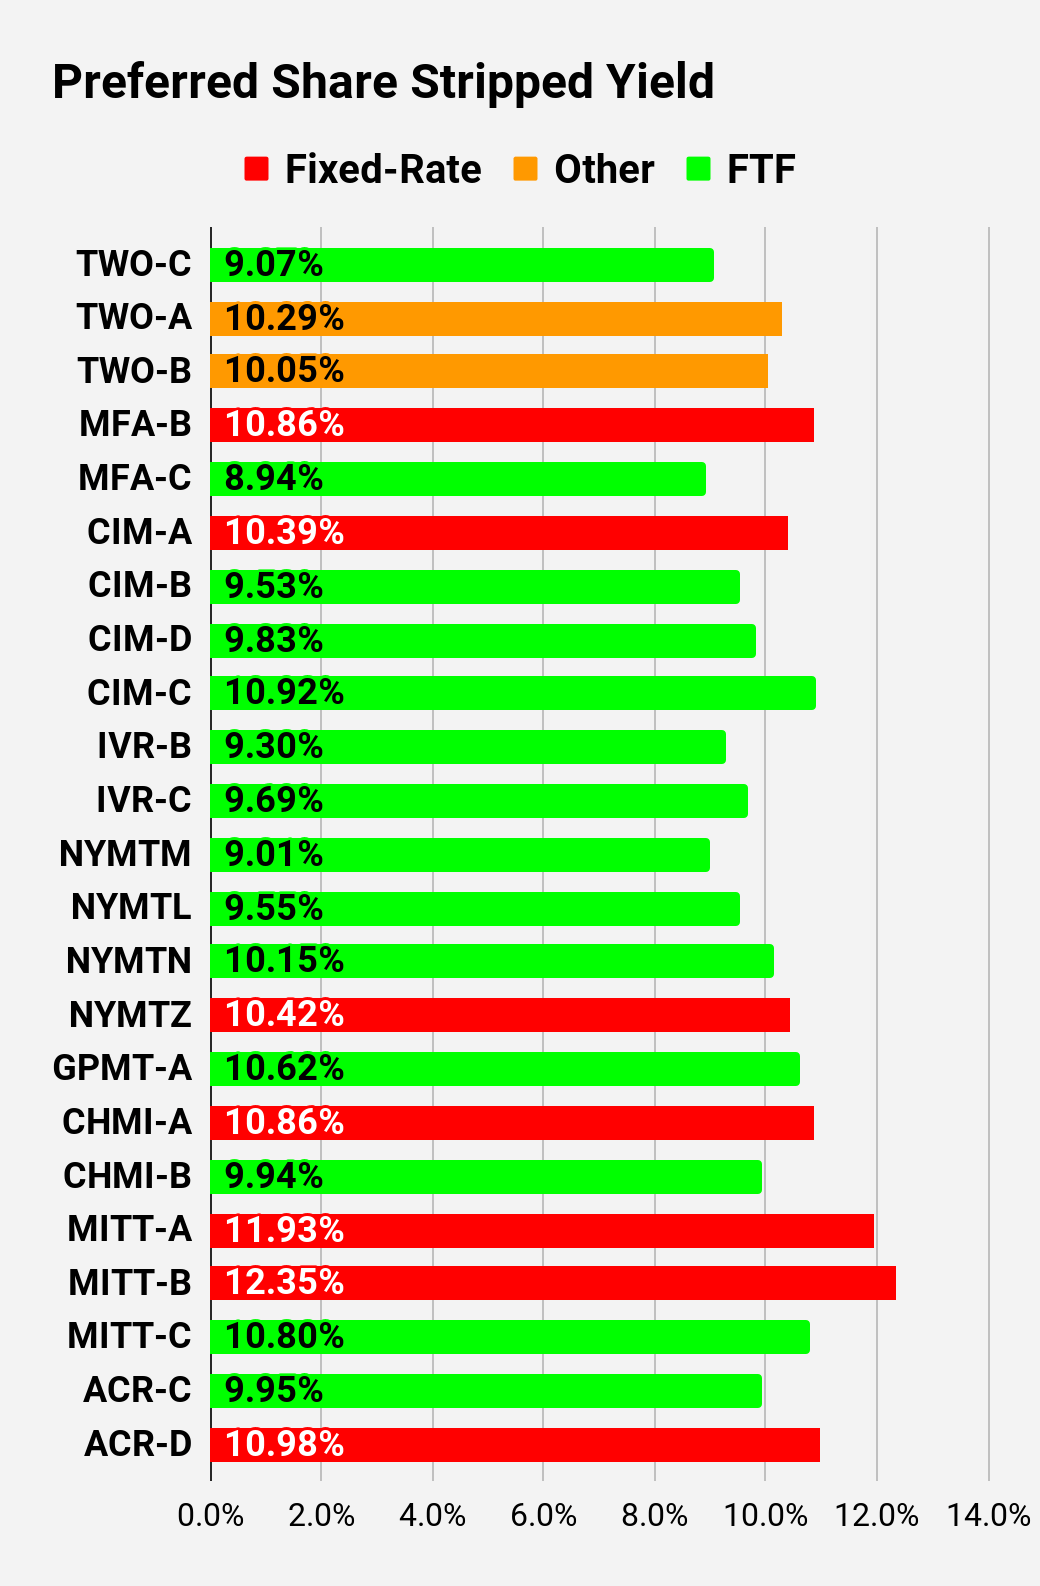 The REIT Forum | 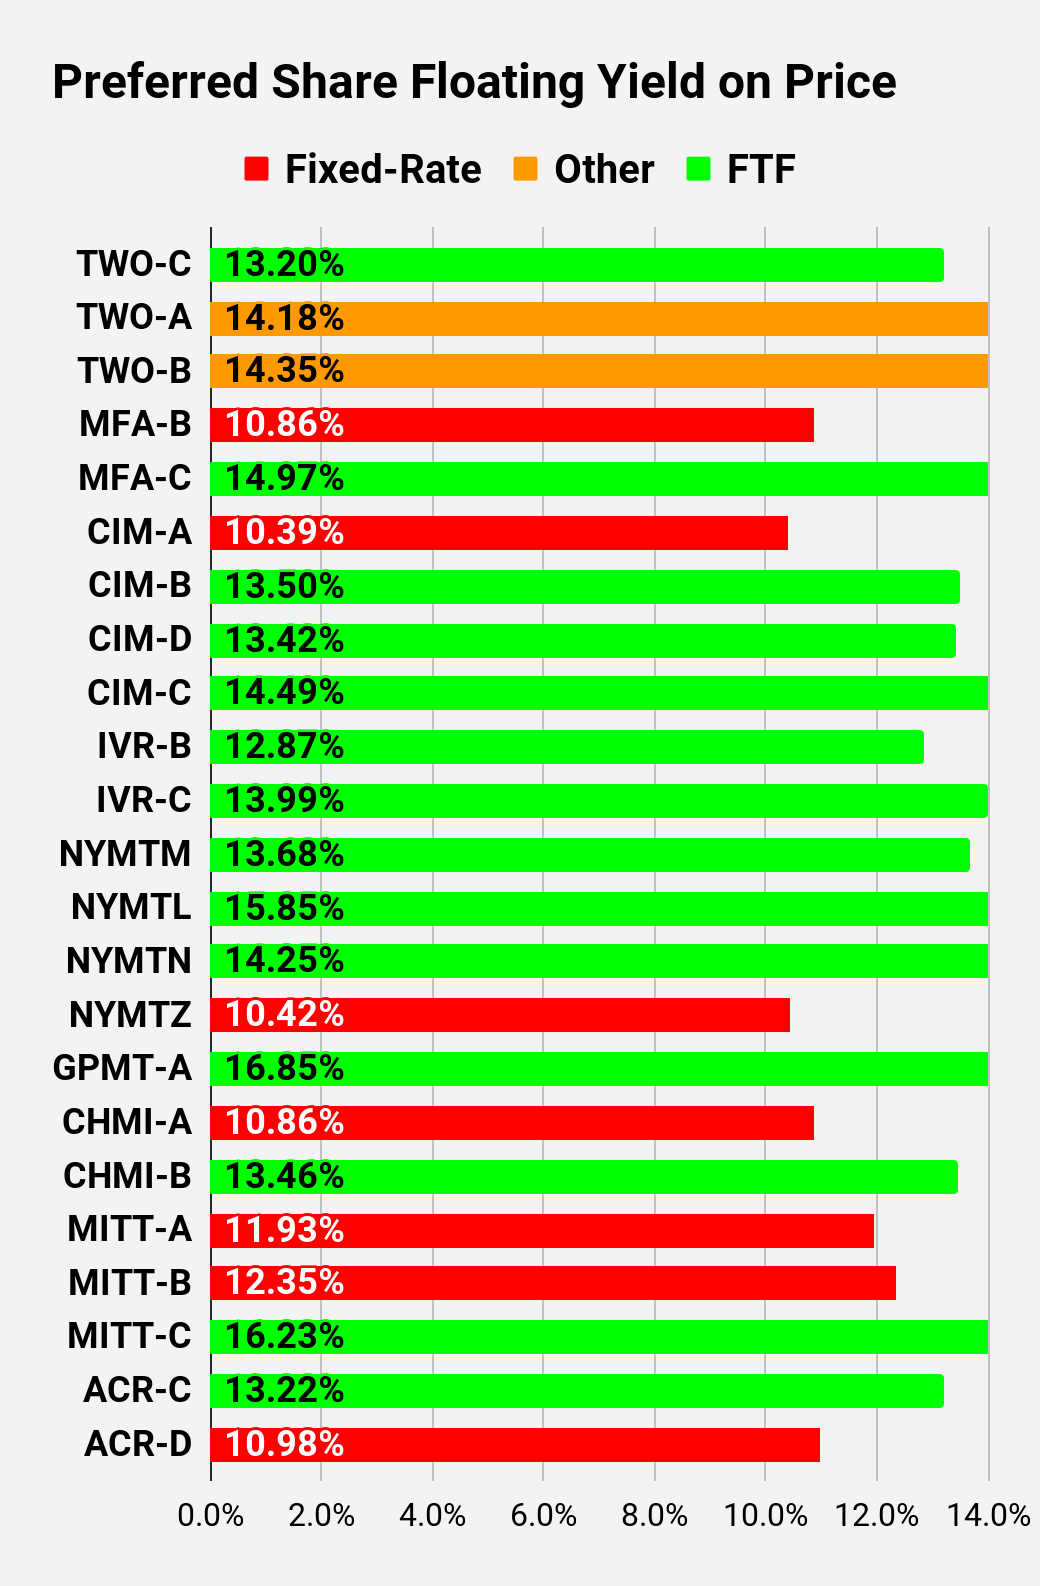 The REIT Forum |
Note: Shares that are classified as "Other" are not necessarily the same. Within The REIT Forum, we provide further distinction. For the purpose of these charts, I lumped all of them together as "Other."
Preferred Share Data
Beyond the charts, we're also providing our readers with access to several other metrics for the preferred shares.
After testing out a series on preferred shares, we decided to try merging it into the series on common shares. After all, we're still talking about positions in mortgage REITs. We don't have any desire to cover preferred shares without cumulative dividends, so any preferred shares you see in our column will have cumulative dividends. You can verify that by using Quantum Online. We've included the links in the table below.
To better organize the table, we needed to abbreviate column names as follows:
- Price = Recent Share Price - Shown in Charts
- S-Yield = Stripped Yield - Shown in Charts
- Coupon = Initial Fixed-Rate Coupon
- FYoP = Floating Yield on Price - Shown in Charts
- NCD = Next Call Date (the soonest shares could be called)
- Note: For all FTF issues, the floating rate would start on NCD.
- WCC = Worst Cash to Call (lowest net cash return possible from a call)
- QO Link = Link to Quantum Online Page
Ticker | Price | S-Yield | Coupon | FYoP | NCD | WCC | QO Link | P-Link |
$23.46 | $0.08 | $0.05 | 8.29% | 11/2/2023 | $1.86 | |||
$25.33 | $0.08 | $0.08 | 8.25% | 8/1/2025 | $3.69 | |||
$22.48 | $0.08 | $0.05 | 7.68% | 11/2/2023 | $2.84 | |||
$23.69 | $0.09 | $0.06 | 8.97% | 11/2/2023 | $1.68 | |||
$23.66 | $0.09 | $0.06 | 9.10% | 11/2/2023 | $1.74 | |||
$24.24 | $0.10 | $0.07 | 9.59% | 11/2/2023 | $0.97 | |||
$23.44 | $0.09 | $0.06 | 9.23% | 11/2/2023 | $1.94 |
Second batch:
Ticker | Price | S-Yield | Coupon | FYoP | NCD | WCC | QO Link | P-Link |
$24.95 | $0.11 | $0.11 | 10.66% | 11/2/2023 | $0.29 | |||
$24.45 | $0.10 | $0.10 | 10.02% | 11/2/2023 | $0.77 | |||
$23.61 | $0.07 | $0.07 | 11.22% | 6/30/2024 | $2.66 | |||
$17.61 | $0.09 | $0.07 | 9.24% | 6/10/2026 | $11.64 | |||
$22.06 | $0.08 | $0.07 | 12.48% | 4/15/2025 | $5.53 | |||
$25.17 | $0.10 | $0.10 | 10.59% | 11/2/2023 | -$0.03 | |||
$23.45 | $0.07 | $0.07 | 10.53% | 4/15/2024 | $2.42 | |||
$22.79 | $0.07 | $0.07 | 11.56% | 10/15/2024 | $3.85 | |||
$21.41 | $0.07 | $0.06 | 11.96% | 4/15/2025 | $5.90 | |||
$21.40 | $0.09 | $0.08 | 10.74% | 10/15/2027 | $11.37 | |||
$19.46 | $0.09 | $0.07 | 9.04% | 1/28/2025 | $7.88 | |||
$18.66 | $0.10 | $0.08 | 10.06% | 11/2/2023 | $6.43 | |||
$21.81 | $0.08 | $0.07 | 12.32% | 10/30/2024 | $4.89 | |||
$18.36 | $0.09 | $0.06 | 13.34% | 1/30/2027 | $11.73 | |||
$22.13 | $0.10 | $0.09 | 11.23% | 4/30/2028 | $12.59 | |||
$23.75 | $0.09 | $0.08 | 11.84% | 3/30/2024 | $2.19 | |||
$19.48 | $0.09 | $0.07 | 9.02% | 11/2/2023 | $5.61 | |||
$22.67 | $0.08 | $0.08 | 12.74% | 8/15/2024 | $4.22 | |||
$22.00 | $0.08 | $0.07 | 12.94% | 08/15/2024 | $4.80 | |||
$18.90 | $0.09 | $0.06 | 14.17% | 02/15/2025 | $8.51 | |||
$19.93 | $0.09 | $0.07 | 14.10% | 11/15/2026 | $10.78 | |||
$20.93 | $0.10 | $0.08 | 13.70% | 3/15/2024 | $5.08 | |||
$20.29 | $0.10 | $0.08 | 14.33% | 6/15/2024 | $6.21 | |||
$16.95 | $0.10 | $0.07 | 10.05% | 8/24/2026 | $13.02 |
Third batch:
Ticker | Price | S-Yield | Coupon | FYoP | NCD | WCC | QO Link | P-Link |
$20.40 | $0.09 | $0.07 | 13.20% | 1/27/2025 | $7.33 | |||
$20.22 | $0.10 | $0.08 | 14.18% | 4/27/2027 | $12.40 | |||
$19.42 | $0.10 | $0.08 | 14.35% | 7/27/2027 | $13.21 | |||
$17.43 | $0.11 | $0.08 | 10.86% | 11/2/2023 | $7.74 | |||
$18.32 | $0.09 | $0.07 | 14.97% | 3/31/2025 | $9.12 | |||
$19.44 | $0.10 | $0.08 | 10.39% | 11/2/2023 | $5.82 | |||
$21.16 | $0.10 | $0.08 | 13.50% | 3/30/2024 | $4.92 | |||
$20.52 | $0.10 | $0.08 | 13.42% | 3/30/2024 | $5.56 | |||
$17.92 | $0.11 | $0.08 | 14.49% | 9/30/2025 | $11.04 | |||
$21.00 | $0.09 | $0.08 | 12.87% | 12/27/2024 | $6.45 | |||
$19.52 | $0.10 | $0.08 | 13.99% | 9/27/2027 | $13.01 | |||
$21.89 | $0.09 | $0.08 | 13.68% | 1/15/2025 | $5.58 | |||
$18.02 | $0.10 | $0.07 | 15.85% | 10/15/2026 | $12.14 | |||
$19.74 | $0.10 | $0.08 | 14.25% | 10/15/2027 | $13.26 | |||
$16.82 | $0.10 | $0.07 | 10.42% | 1/15/2027 | $13.88 | |||
$16.50 | $0.11 | $0.07 | 16.85% | 11/30/2026 | $13.96 | |||
$18.90 | $0.11 | $0.08 | 10.86% | 11/2/2023 | $6.13 | |||
$20.78 | $0.10 | $0.08 | 13.46% | 4/15/2024 | $5.18 | |||
$17.48 | $0.12 | $0.08 | 11.93% | 11/2/2023 | $7.74 | |||
$16.38 | $0.12 | $0.08 | 12.35% | 11/2/2023 | $8.83 | |||
$18.70 | $0.11 | $0.08 | 16.23% | 9/17/2024 | $8.27 | |||
$21.70 | $0.10 | $0.09 | 13.22% | 7/30/2024 | $4.92 | |||
$17.96 | $0.11 | $0.08 | 10.98% | 5/21/2026 | $12.08 |
Strategy
Our goal is to maximize total returns. We achieve those most effectively by including "trading" strategies. We regularly trade positions in the mortgage REIT common shares and BDCs because:
- Prices are inefficient.
- Long-term, share prices generally revolve around book value.
- Short-term, price-to-book ratios can deviate materially.
- Book value isn't the only step in analysis, but it is the cornerstone.
We also allocate to preferred shares and equity REITs. We encourage buy-and-hold investors to consider using more preferred shares and equity REITs.
Editor's Note: This article covers one or more microcap stocks. Please be aware of the risks associated with these stocks.

You should try our service. Unlike most services, our service is backed by a real portfolio. Not a "model" portfolio. Not hypothetical positions. Not 7 different portfolios we made up in Google Sheets so we can brag about the good one. None of that crap.
You get real-time alerts on every trade. See current and past positions. I'm sick of analysts who have to retroactively pick a "portfolio" or get creative about defining "returns". Beat the index or get out.
Ask your analyst to share their portfolio value each month so you can verify their returns. When they object, try us.