Non-Exclusive
I want to briefly cover the change in book value across mortgage REITs and BDCs in Q3 2023. You’ll notice:
- Some did much better than others.
- In general, agency mortgage REITs had the worst time.
- BDCs had the easiest time.
These are the book value changes for the mortgage REITs as of Q3 2023 relative to Q2 2023:
The REIT Forum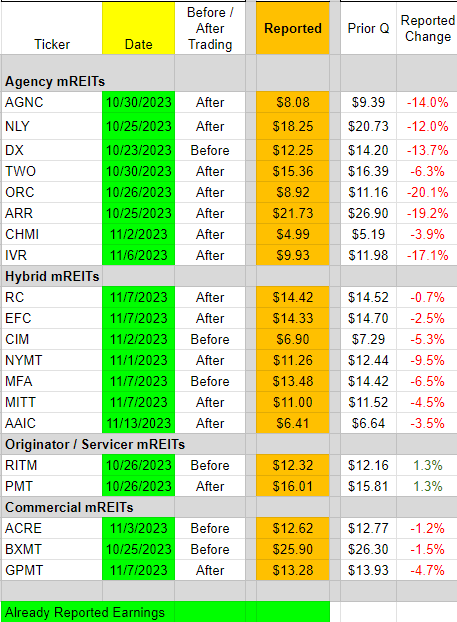
Clearly the originator / servicer mREITs were outperforming. We also saw RC performing much better than many peers. We recently moved RC into the hybrid classification. Previously, it was included in the originator / servicer classification. They acquired another mortgage REIT (Broadmark) which tilted the portfolio into more of a hybrid position.
Here are the changes for the BDCs:
The REIT Forum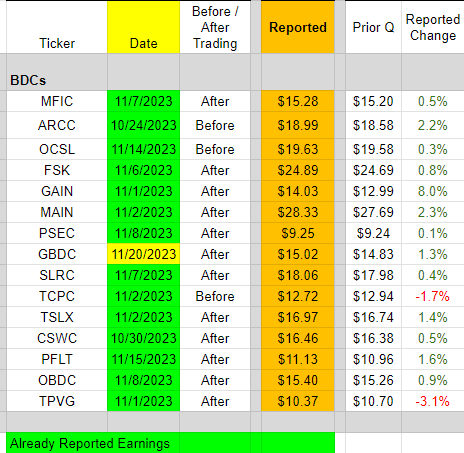
GBDC hasn’t officially announced Q4 results yet, but they provided a preliminary range of $15.00 to $15.04, so we’ve used $15.02 in the results. That’s a tight enough range that I think it makes sense to use it.
How Do BDCs Work?
BDCs primarily invest in or lend to privately-held or small public companies. Their investments can take various forms, including equity stakes, debt financing (like loans), or a mix of both. BDCs often provide capital to companies that are too small to raise funds publicly or too risky for traditional bank loans. BDCs earn income primarily through interest payments on debt investments and, to a lesser extent, from capital gains on equity investments. They also may earn fees for providing managerial assistance or other services to the companies in which they invest. BDCs are regulated as Regulated Investment Companies (RICs), which means they must distribute at least 90% of their taxable income to shareholders. In return, they are generally not required to pay corporate income tax on earnings distributed to shareholders. This structure is similar to that of Real Estate Investment Trusts (REITs).
The Irony in Agency Mortgage REITs
Some of the agency mortgage REITs have very similar portfolios. Consequently, they often produce similar levels of TER (Total Economic Return). TER is the change in book value plus the dividend. It can be expressed in dollars and cents or in percentages. AGNC doesn’t have a big advantage over Annaly Capital Management or Dynex Capital. However, AGNC trades at a materially higher price-to-book ratio. How is AGNC going to generate enough additional returns to compensate for that difference in price-to-book ratio?
It has a much higher “earnings yield,” but it doesn’t have that kind of edge on total economic return. The earnings yield is very heavily influenced by accounting decisions and hedging strategies. The market appears to be pricing shares in the three REITs with a heavy emphasis on “earnings” rather than on generating total returns. Dividend yield could be a factor.
Just keep in mind a mortgage REIT can always choose to declare higher dividends until they cease having the cash. It’s just a return of capital. Using “Core Earnings” just doesn’t give you that information. Many investors wish it did, so they pretend it will. That’s just wrong.
Consequently, investors trying to buy the REITs with a higher “earnings yield” may mislead themselves into thinking transitory factors are lasting benefits.
The Simple Strategy
If you can tell when price-to-book ratios are unusually high, you know when to take a more bearish outlook.
If you can spot them being unusually low, you’ll take a more bullish outlook.
I used that process to hammer AGNC with a bearish rating when they were trading about 20% above tangible book value (using our estimates as of that day). When AGNC preannounced the Q3 2023 results, shares tumbled over 10% (and the total decline increased to more than 20%).
We climbed the turnbuckle and hoisted the belt:
The REIT Forum
That was the end of a great call. Or at least it was a temporary end.
Better Choice
For long-term positions, investors should generally focus on the BDCs and the preferred shares. It’s really simple. Less dividend cuts. However, I do want to emphasize that spreads are unusually wide presently. There are currently quite a few opportunities in mortgage REITs. I wouldn’t want to be tied to them, but some still have attractive valuations. To be fair, I’ve been primarily buying preferred shares.
Since the start of September, I’ve spent $227,485.55 buying preferred shares. That was partially offset by collecting $177,375.83 from preferred share sales. All of the closed positions resulted in gains and all but 1 of the purchases is currently sitting on an unrealized gain. The net impact was adding about $50k to my sector allocation.
As I've mentioned previously, I approach this sector actively. I aim to take advantage of mispricing between shares.
Stock Table
We will close out the rest of the article with the tables and charts we provide for readers to help them track the sector for both common shares and preferred shares.
We’re including a quick table for the common shares that will be shown in our tables:
Type of REIT or BDC | ||||
Residential Agency | Residential Hybrid | Residential Originator and Servicer | Commercial | BDC |
If you’re looking for a stock that I haven’t mentioned yet, you’ll still find it in the charts below. The charts contain comparisons based on price-to-book value, dividend yields, and earnings yield. You won’t find these tables anywhere else.
For mortgage REITs, please look at the charts for AGNC, NLY, DX, ORC, ARR, CHMI, TWO, IVR, EARN, CIM, EFC, NYMT, MFA, MITT, AAIC, PMT, RITM, BXMT, GPMT, WMC, and RC.
For BDCs, please look at the charts for MAIN, CSWC, ARCC, TSLX, TPVG, OCSL, GAIN, GBDC, SLRC, OBDC, PFLT, TCPC, FSK, PSEC, and MFIC.
This series is the easiest place to find charts providing up-to-date comparisons across the sector.
Note on Book Values
I’ve updated the charts to use Q3 2023 book values. These are much closer to current book values. Companies that have not reported values for Q3 2023 will be blank. We don’t want to put Q2 2023 and Q3 2023 BVs in the same charts due to the significant changes.
Residential Mortgage REIT Charts
Note: The chart for our public articles uses the book value per share from the quarter indicated in the chart. We use the current estimated (proprietary estimates) book value per share to determine our targets and trading decisions. It is available in our service, but those estimates are not included in the charts below. PMT and NYMT are not showing an earnings yield metric as neither REIT provides a quarterly “Core EPS” metric. Presently, a few other REITs also have no consensus estimate.
Second Note: Due to the way historical amortized cost and hedging is factored into the earnings metrics, it's possible for two mortgage REITs with similar portfolios to post materially different metrics for earnings. I would be very cautious about putting much emphasis on the consensus analyst estimate (which is used to determine the earnings yield). In particular, throughout late 2022, the earnings metric became less comparable for many REITs.
The REIT Forum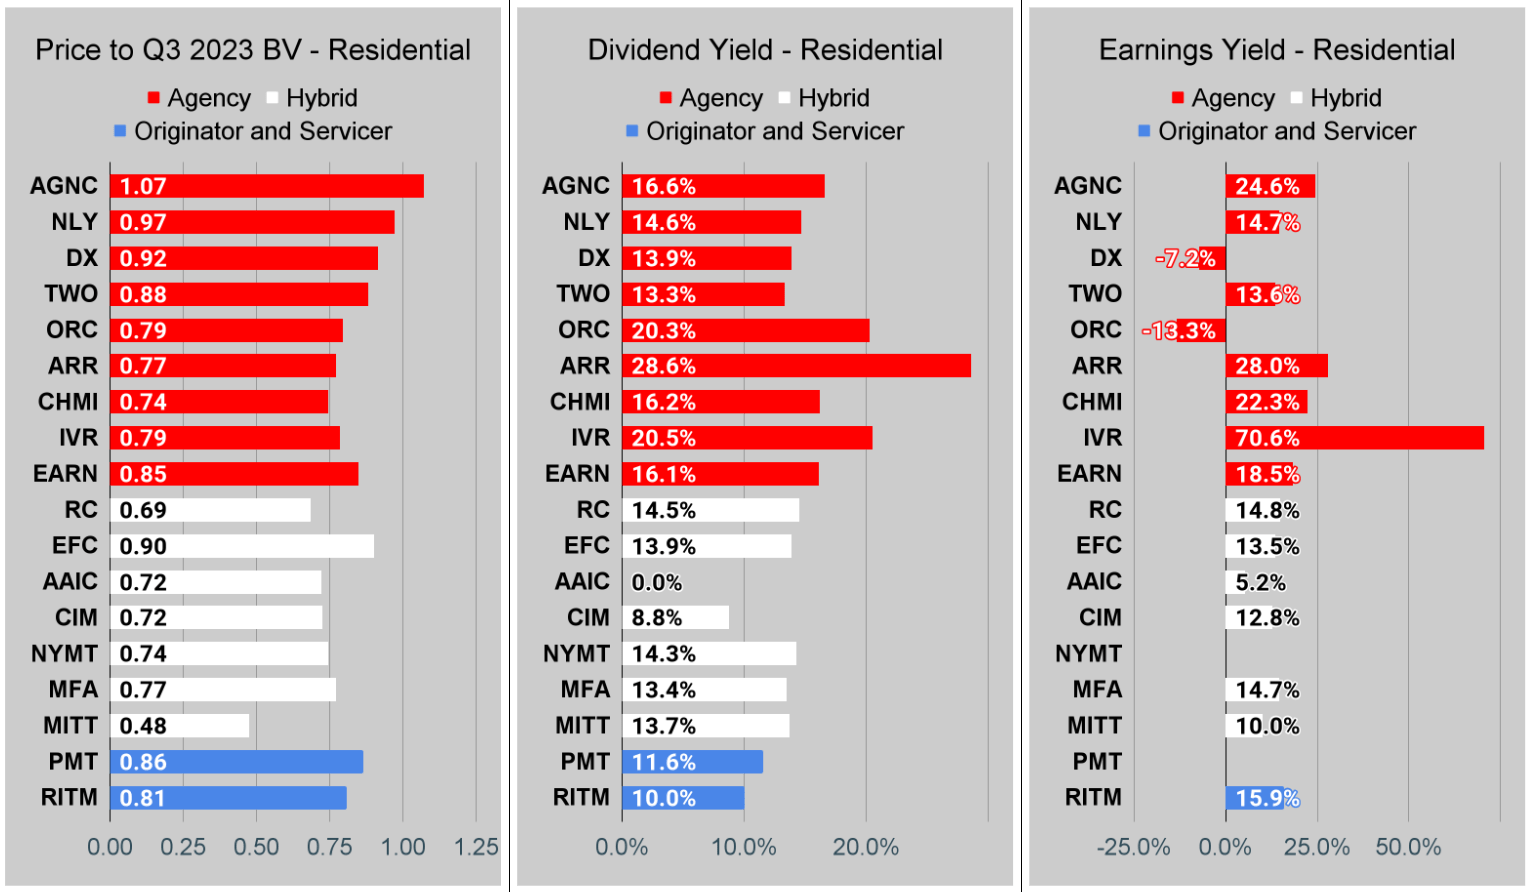
Commercial Mortgage REIT Charts
The REIT Forum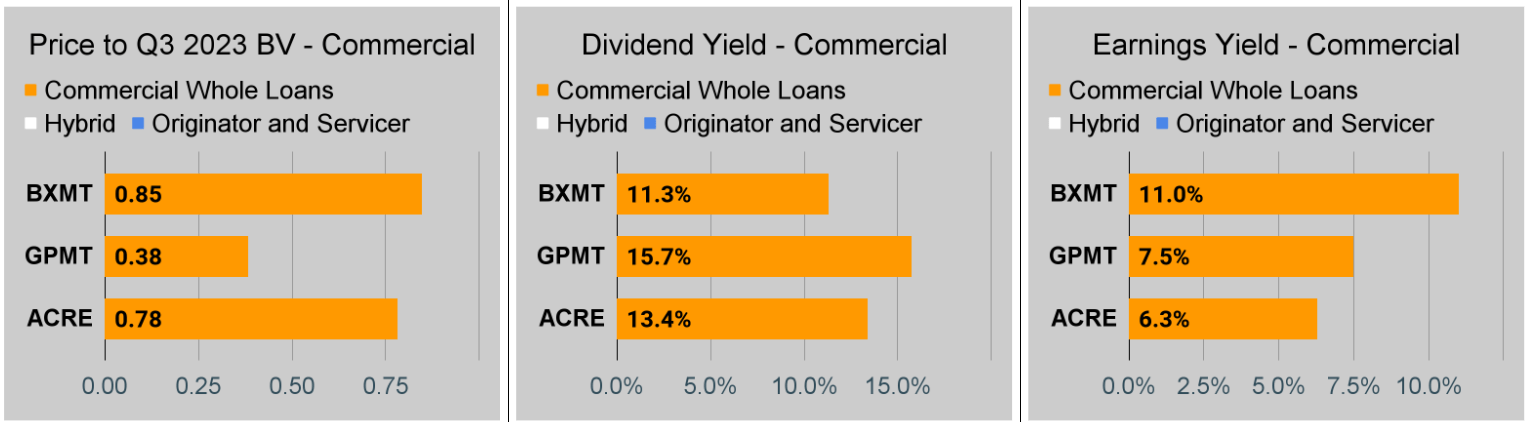
BDC Charts
The REIT Forum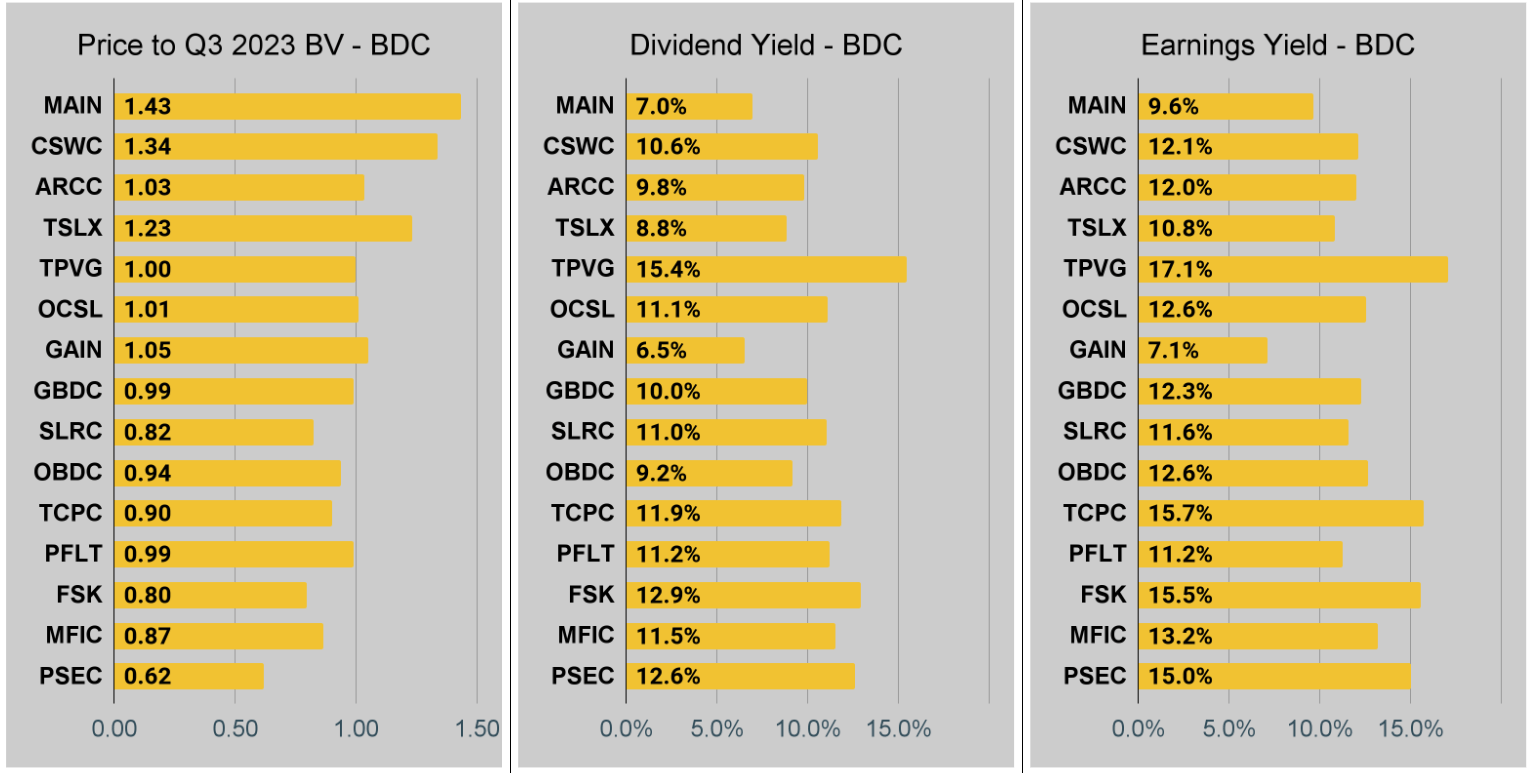
Preferred Share and Baby Bond Charts
I changed the coloring a bit. We needed to adjust to include that the first fixed-to-floating shares have transitioned over to floating rates. When a share is already floating, the stripped yield may be different from the “Floating Yield on Price” due to changes in interest rates. For instance, NLY-F already has a floating rate. However, the rate is only reset once per three months. The stripped yield is calculated using the upcoming projected dividend payment and the “Floating Yield on Price” is based on where the dividend would be if the rate reset today. In my opinion, for these shares the “Floating Yield on Price” is clearly the more important metric.
Baby Bonds
The REIT Forum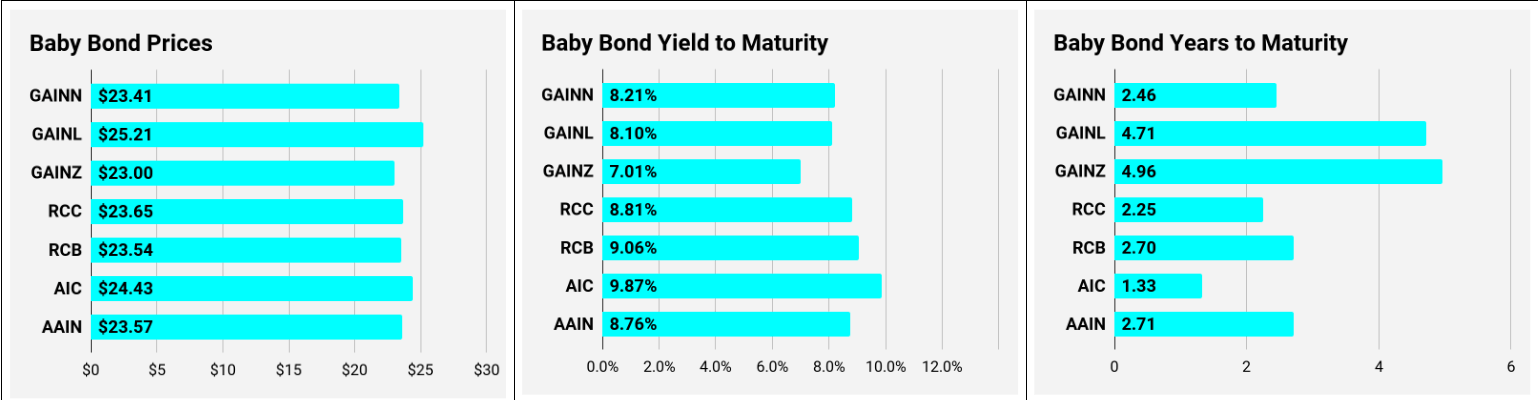
Preferred Shares
The REIT Forum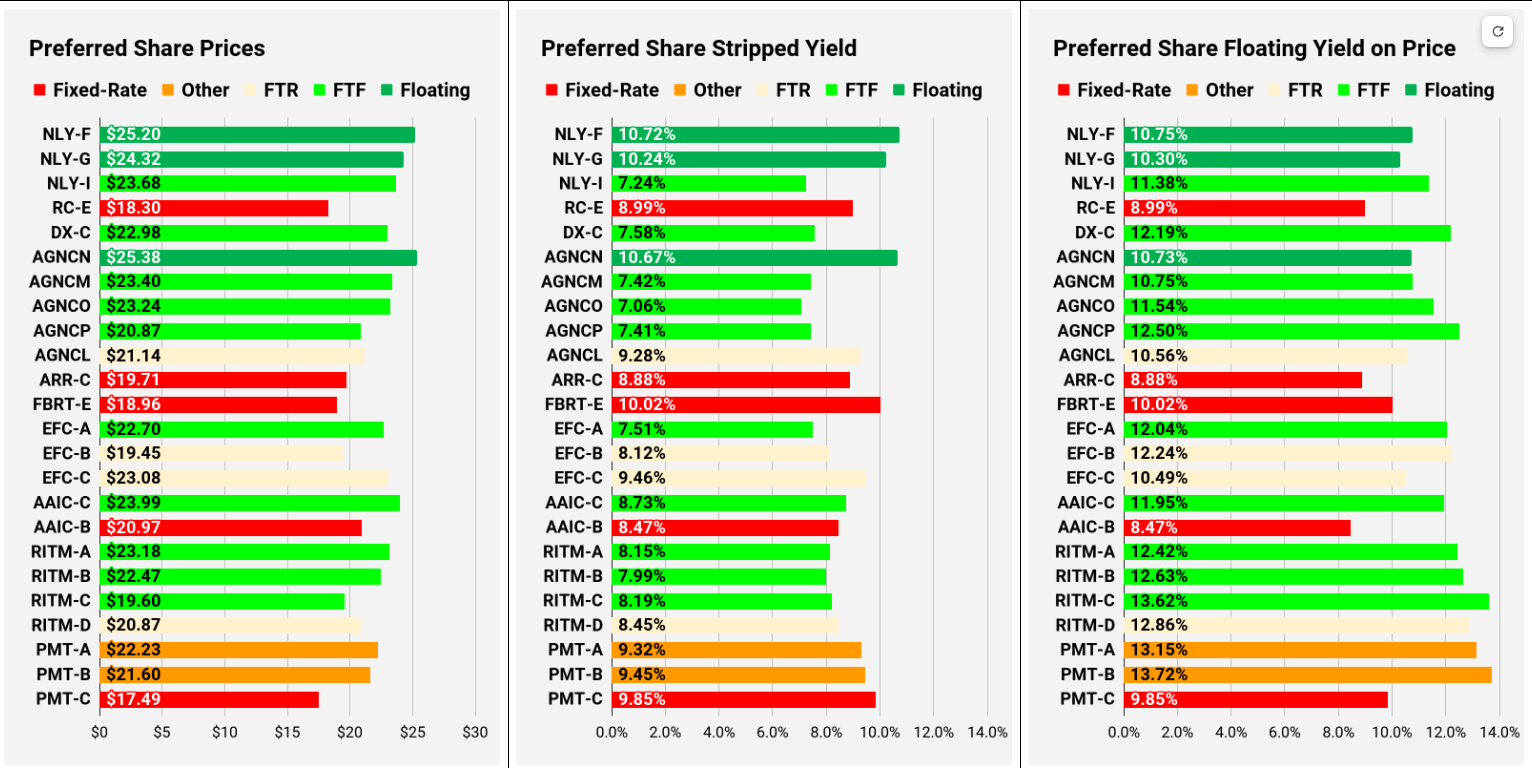
More Preferred Shares
The REIT Forum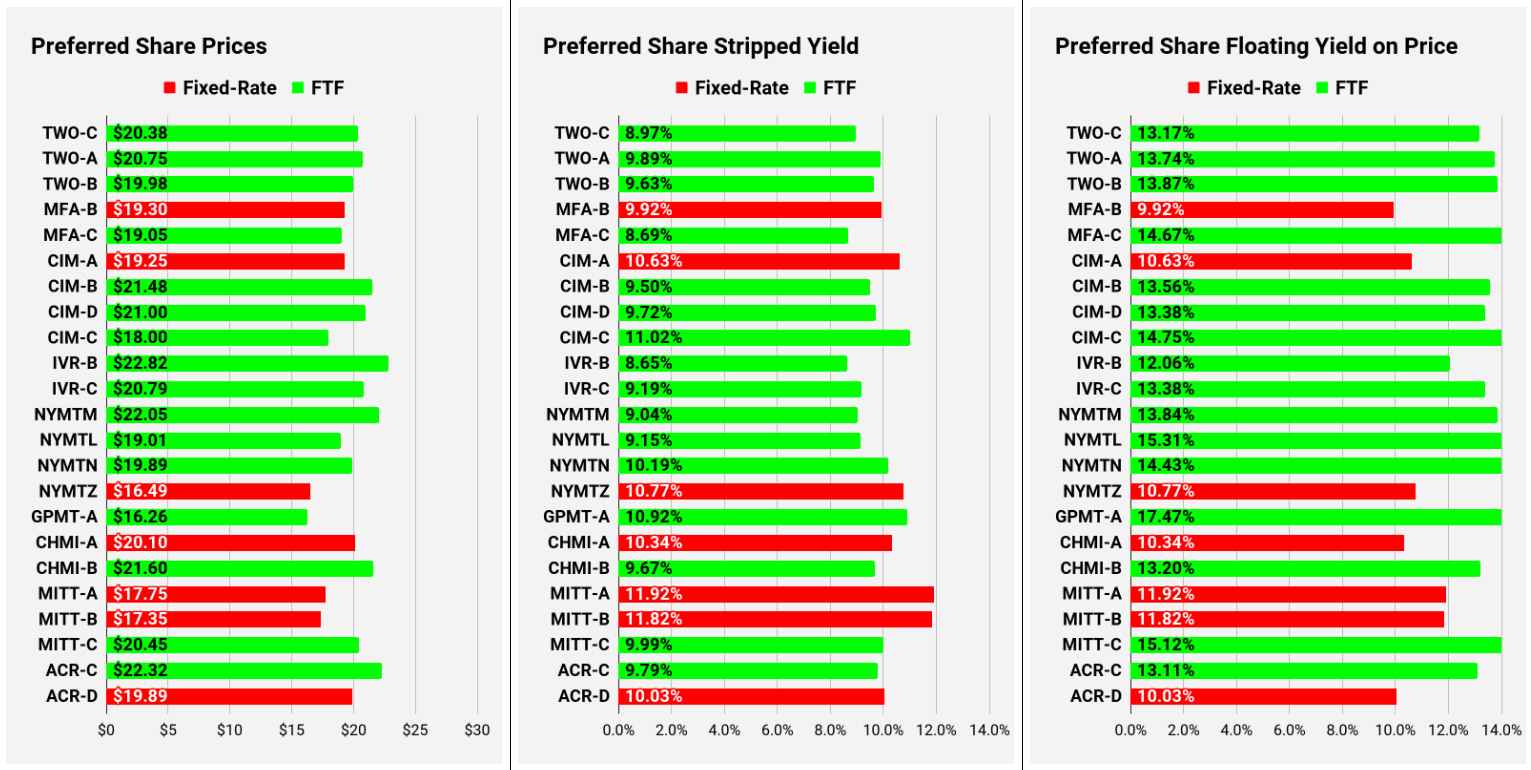
Note: Shares that are classified as “Other” are not necessarily the same. For the purpose of these charts, I lumped all of them together as "Other." Now there are only two left, PMT-A and PMT-B. Those both have the same issue. Management claims the shares will be fixed-rate, even though the prospectus says they should be fixed-to-floating.
Preferred Share Data
Beyond the charts, we’re also providing access to several other metrics for the preferred shares.
After testing out a series on preferred shares, we decided to try merging it into the series on common shares. After all, we're still talking about positions in mortgage REITs. We don’t have any desire to cover preferred shares without cumulative dividends, so any preferred shares you see in our column will have cumulative dividends. You can verify that by using Quantum Online. We’ve included the links in the table below.
To better organize the table, we needed to abbreviate column names as follows:
Price = Recent Share Price - Shown in Charts
S-Yield = Stripped Yield - Shown in Charts
Coupon = Initial Fixed-Rate Coupon
FYoP = Floating Yield on Price - Shown in Charts
NCD = Next Call Date (the soonest shares could be called)
Note: For all FTF issues, the floating rate would start on NCD.
WCC = Worst Cash to Call (lowest net cash return possible from a call)
QO Link = Link to Quantum Online Page
Ticker | Price | S-Yield | Coupon | FYoP | NCD | WCC | QO Link | P-Link |
$23.41 | $0.08 | $0.05 | 8.21% | 12/16/2023 | $1.75 | |||
$25.21 | $0.08 | $0.08 | 8.10% | 8/1/2025 | $3.30 | |||
$23.00 | $0.07 | $0.05 | 7.01% | 12/16/2023 | $2.16 | |||
$23.65 | $0.09 | $0.06 | 8.81% | 12/16/2023 | $1.54 | |||
$23.54 | $0.09 | $0.06 | 9.06% | 12/16/2023 | $1.66 | |||
$24.43 | $0.10 | $0.07 | 9.87% | 12/16/2023 | $0.99 | |||
$23.57 | $0.09 | $0.06 | 8.76% | 12/16/2023 | $1.60 |
Second batch:
Ticker | Price | S-Yield | Coupon | FYoP | NCD | WCC | QO Link | P-Link |
$25.26 | $0.11 | $0.11 | 10.75% | 12/16/2023 | $0.30 | |||
$24.32 | $0.10 | $0.10 | 10.30% | 12/16/2023 | $1.20 | |||
$23.68 | $0.07 | $0.07 | 11.38% | 6/30/2024 | $2.59 | |||
$18.30 | $0.09 | $0.07 | 8.99% | 6/10/2026 | $10.96 | |||
$22.98 | $0.08 | $0.07 | 12.19% | 4/15/2025 | $4.61 | |||
$25.38 | $0.11 | $0.11 | 10.73% | 12/16/2023 | $0.09 | |||
$23.40 | $0.07 | $0.07 | 10.75% | 4/15/2024 | $2.47 | |||
$23.24 | $0.07 | $0.07 | 11.54% | 10/15/2024 | $3.40 | |||
$20.87 | $0.07 | $0.06 | 12.50% | 4/15/2025 | $6.44 | |||
$21.14 | $0.09 | $0.08 | 10.56% | 10/15/2027 | $11.63 | |||
$19.71 | $0.09 | $0.07 | 8.88% | 1/28/2025 | $7.33 | |||
$18.96 | $0.10 | $0.08 | 10.02% | 12/16/2023 | $6.36 | |||
$22.70 | $0.08 | $0.07 | 12.04% | 10/30/2024 | $4.00 | |||
$19.45 | $0.08 | $0.06 | 12.24% | 1/30/2027 | $10.65 | |||
$23.08 | $0.09 | $0.09 | 10.49% | 4/30/2028 | $11.65 | |||
$23.99 | $0.09 | $0.08 | 11.95% | 3/30/2024 | $1.96 | |||
$20.97 | $0.08 | $0.07 | 8.47% | 12/16/2023 | $4.33 | |||
$23.18 | $0.08 | $0.08 | 12.42% | 8/15/2024 | $3.24 | |||
$22.47 | $0.08 | $0.07 | 12.63% | 08/15/2024 | $3.88 | |||
$19.60 | $0.08 | $0.06 | 13.62% | 02/15/2025 | $7.41 | |||
$20.87 | $0.08 | $0.07 | 12.86% | 11/15/2026 | $9.40 | |||
$22.23 | $0.09 | $0.08 | 13.15% | 3/15/2024 | $3.79 | |||
$21.60 | $0.09 | $0.08 | 13.72% | 6/15/2024 | $4.91 | |||
$17.49 | $0.10 | $0.07 | 9.85% | 8/24/2026 | $12.48 |
Third batch:
Ticker | Price | S-Yield | Coupon | FYoP | NCD | WCC | QO Link | P-Link |
$20.38 | $0.09 | $0.07 | 13.17% | 1/27/2025 | $6.89 | |||
$20.75 | $0.10 | $0.08 | 13.74% | 4/27/2027 | $11.36 | |||
$19.98 | $0.10 | $0.08 | 13.87% | 7/27/2027 | $12.17 | |||
$19.30 | $0.10 | $0.08 | 9.92% | 12/16/2023 | $6.10 | |||
$19.05 | $0.09 | $0.07 | 14.67% | 3/31/2025 | $8.40 | |||
$19.25 | $0.11 | $0.08 | 10.63% | 12/16/2023 | $6.26 | |||
$21.48 | $0.10 | $0.08 | 13.56% | 3/30/2024 | $4.60 | |||
$21.00 | $0.10 | $0.08 | 13.38% | 3/30/2024 | $5.08 | |||
$18.00 | $0.11 | $0.08 | 14.75% | 9/30/2025 | $10.96 | |||
$22.82 | $0.09 | $0.08 | 12.06% | 12/27/2024 | $4.63 | |||
$20.79 | $0.09 | $0.08 | 13.38% | 9/27/2027 | $11.74 | |||
$22.05 | $0.09 | $0.08 | 13.84% | 1/15/2025 | $5.42 | |||
$19.01 | $0.09 | $0.07 | 15.31% | 10/15/2026 | $11.15 | |||
$19.89 | $0.10 | $0.08 | 14.43% | 10/15/2027 | $13.12 | |||
$16.49 | $0.11 | $0.07 | 10.77% | 1/15/2027 | $14.21 | |||
$16.26 | $0.11 | $0.07 | 17.47% | 11/30/2026 | $14.20 | |||
$20.10 | $0.10 | $0.08 | 10.34% | 12/16/2023 | $5.18 | |||
$21.60 | $0.10 | $0.08 | 13.20% | 4/15/2024 | $4.36 | |||
$17.75 | $0.12 | $0.08 | 11.92% | 12/16/2023 | $7.72 | |||
$17.35 | $0.12 | $0.08 | 11.82% | 12/16/2023 | $8.11 | |||
$20.45 | $0.10 | $0.08 | 15.12% | 9/17/2024 | $6.52 | |||
$22.32 | $0.10 | $0.09 | 13.11% | 7/30/2024 | $4.31 | |||
$19.89 | $0.10 | $0.08 | 10.03% | 5/21/2026 | $10.15 |
Strategy
Our goal is to maximize total returns. We achieve those most effectively by including “trading” strategies. We regularly trade positions in the mortgage REIT common shares and BDCs because:
Prices are inefficient.
Long term, share prices generally revolve around book value.
Short term, price-to-book ratios can deviate materially.
Book value isn’t the only step in analysis, but it's the cornerstone.
We also allocate to preferred shares and equity REITs. We encourage buy-and-hold investors to consider using more preferred shares and equity REITs.
Editor's Note: This article covers one or more microcap stocks. Please be aware of the risks associated with these stocks.
It's time to try our service.

Don't make me write longer advertisements. I hate advertising. Read the reviews. See the happy customers. The customers who improved their investing. That's all the advertising any analyst should need.
Join before the end of November to have your rate locked in.