Jordan Feeg
While real estate investment trusts, or REITs, tend to have steady revenues, their market prices slosh around quite a bit. Today, I want to examine a particular area of price sloshing: Canada. Charted below is the S&P Canadian REIT index (OTC:IUSPF) versus the U.S. Dow Jones REIT index (RWR).
S&P Global Market Intelligence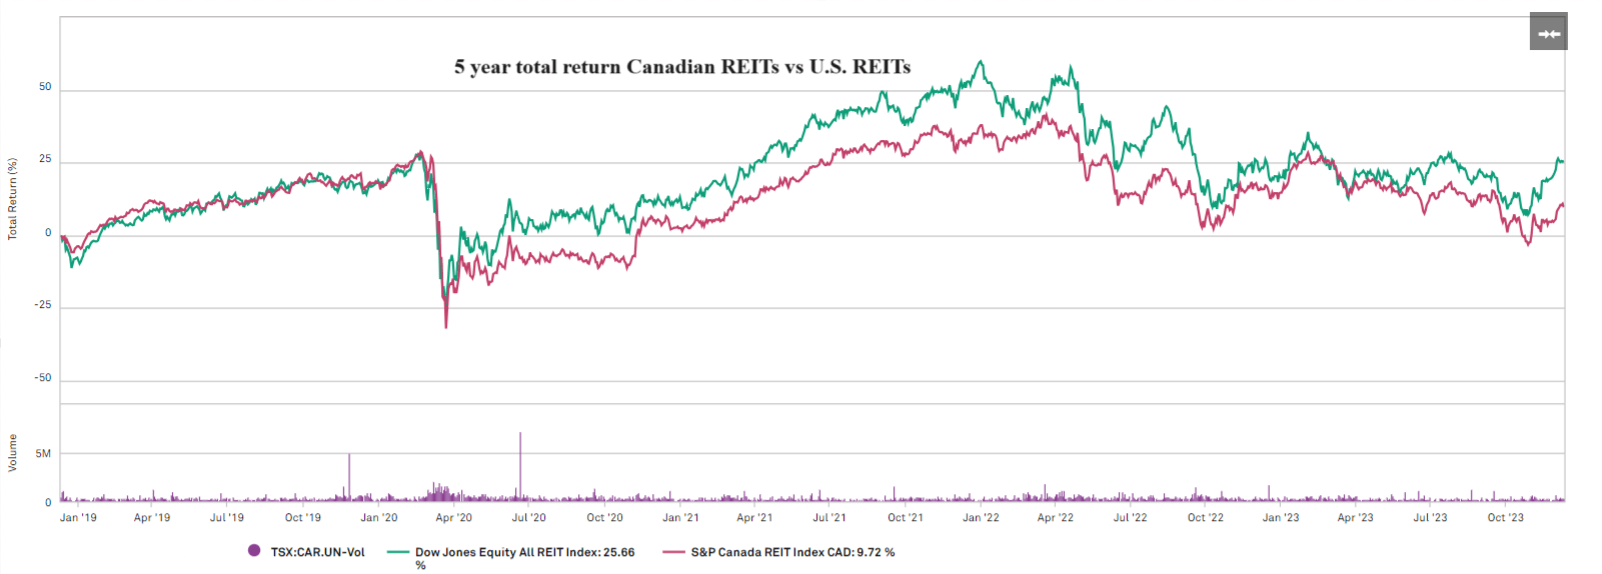
Generally, their returns have tracked quite closely over the past 5 years, but if you look at the last few months on the right hand side of the chart, the gator jaws opened up.
Canadian REITs appear to have largely not participated in the recent REIT rally. Have they become opportunistically cheap, or is there some underlying reason for the lack of rally?
This warrants a deeper dive, so in this article we will provide an overview of the Canadian REIT market and discuss some of the key differences between Canadian and U.S. REITs.
Specifically, we see significant differences in the following categories
- Valuation
- Size
- Leverage
- Property sector exposure.
Valuation
Canadian REITs are significantly cheaper than U.S. REITs, which are already fairly cheap.
- 9.9X Mean Canadian REIT multiple
- 9.3X Median Canadian REIT multiple
- 13.2X Mean U.S. REIT multiple
- 12.3X Median U.S. REIT multiple.
The lower cashflow multiple is backed up by a greater discount to net asset value (NAV).
- Canadian REITs trade at an average of 70.6% of NAV
- U.S. REITs trade at an average of 82.5% of NAV.
Keep in mind that U.S REITs are already substantially cheaper than the S&P 500 (SP500) relative to history.
Thus, Canadian REITs appear to be quite cheap, which could be opportunistic.
Do note, however, that some of the cheapness is a result of substantially different qualitative metrics, which we will cover in the following sections.
Size
Canadian REITs have an aggregate market cap of just over $44B. The largest Canadian REIT is Canadian Apartment Properties (CAR.UN:CA) which weighs in at $6.3B. In the U.S., that would be considered somewhere between a small and mid-cap REIT.
In contrast, there are about 170 U.S. equity REITs with an aggregate market cap of about $1.2 trillion. There used to be 180, but in recent years, mergers have outnumbered IPOs. Within the group, there are quite a few heavyweights over $30B, all the way up to Prologis (PLD) at $112.7B.
S&P Global Market Intelligence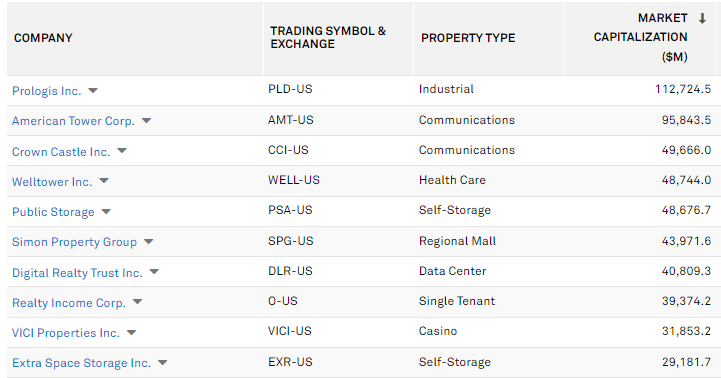
Size is correlated with higher funds from operations ("FFO") multiples, so the drastic size difference explains at least part of the cheaper FFO multiples for Canadian REITs.
Some of the difference in size could be structural. It is significantly cheaper to be a public company in Canada. Regulations in the U.S. have gotten quite excessive since the financial crisis, resulting in onerous overhead expenses to simply exist as a public company.
This sets roughly $100 million as the minimum viable (One could even say $300 million) size to be a publicly traded U.S. REIT. In Canada, nearly half the REITs are below that threshold.
Due to cheaper overhead, Canada is often used as a training grounds for start-up REITs so that they can get to sufficient size to then re-domicile in the U.S. A clear example of this is Flagship Communities REIT (OTCPK:MHCUF), which has chosen to domicile in Canada despite its management and properties being located in the U.S.
Leverage
Following the Financial Crisis, U.S. REITs embarked on a massive effort to reduce leverage. It took a while, but over time their efforts paid off, resulting in substantially lower levels of leverage. The majority of U.S. REITs now have fairly low leverage somewhere around 30% loan to property value.
Canadian REITs tend to operate at substantially higher leverage than U.S. REITs.
With interest expense rising due to treasury yields being higher than in previous years, analysts are increasingly looking at EBITDA coverage of interest expense as an important debt metric. In this regard, the difference is quite clear:
- Canadian REITs average 1.6X recurring EBITDA to interest expense
- U.S. REITs average 3.4X recurring EBITDA to interest expense.
The greater coverage ratio for U.S. REITs makes them lower risk on average. This too could explain part of why Canadian REITs are cheaper on FFO multiple and NAV.
Property sector exposure
We spend a good deal of time asseverating how diversified REITs are. Below are the concentrations of the Vanguard Real Estate Index Fund ETF Shares (VNQ).
VNQ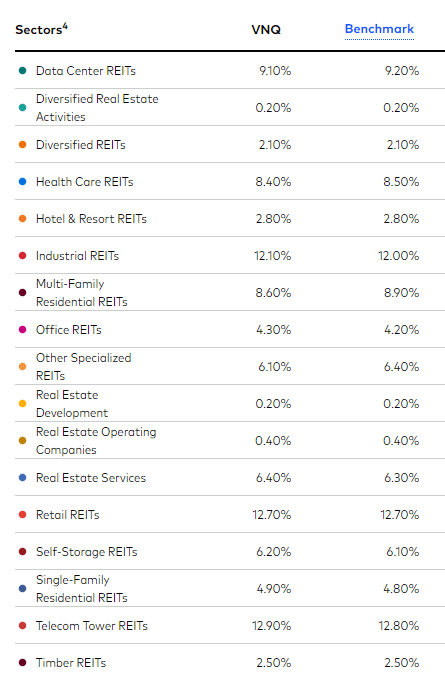
If one buys selectively rather than by market weight, it can be even more diversified across the 20 property sectors.
Canadian REITs are quite a bit more concentrated. Below are the sector weights of the MSCI Canada IMI REIT index.
MSCI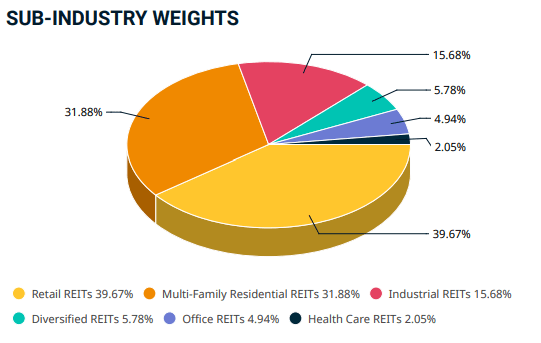
Nearly 90% of the Canadian REIT index is in retail, multifamily or industrial.
This is both good and bad. Clearly it is less diversified, but these are fairly strong sectors, so it is a reasonably good overweight.
I see this as a great opportunity to attempt to dispel the media rumors that REITs are doomed due to office troubles. As seen in the graphics above, U.S. REITs are only 4.2% office and Canadian REITs are only 4.9% office.
The sector concentration differences between U.S. and Canadian REITs are significant, but it is unclear which is better, so I do NOT see this as contributing to the valuation gap.
Summary of valuation gap
Canadian REITs on average are significantly cheaper than U.S. REITs. The discount is likely due to smaller size and higher leverage. At an index level, it is unclear which is more opportunistic at the moment.
Distribution of Valuation
Earlier we just provided the averages with the median Canadian REIT at 9.3X FFO and the median U.S. REIT at 12.3X FFO.
The FFO multiples for the individual REITs have a platykurtic distribution to an extent where it is almost difficult to find the mode.
- Canadian FFO multiples range from 1.3X to 20X
- U.S. FFO multiples range from 2.1X to 25X.
That, in my opinion, is where the opportunity lies. There are big gaps in valuation, even among individual REITs that are not all that different in quality, size, leverage, and sector.
With REITs having been out of favor for the last 2 years, fewer institutional investors are scouring the space, which has resulted in exacerbation of mispricing. As a result, it is an unusually favorable time to be a stock picker within the space.
A good analyst can examine the individual REITs and discern the marginal cost of quality. There are plenty of instances in which one can get a lot of extra quality for only a slight premium and other instances in which one can get buy much deeper value without having to sacrifice much quality. Doing a combination of the two can result in a portfolio that is both higher quality and cheaper valuation than the index.
Another area that is fertile ground for mispricing encompasses the hybrid Canadian/U.S. REITs.
Hybrid Canadian/U.S. REITs
There are quite a few REITs that have U.S. properties, yet the company is listed on the Toronto Stock Exchange. The tickers used below are those of the U.S. foreign ordinary, which allows one to buy it with U.S. dollars though a U.S. exchange.
- Flagship (OTCPK:MHCUF)
- BSR REIT (OTCPK:BSRTF)
- Slate Grocery REIT (OTC:SRRTF)
- Tricon Residential (TCN) – technically not a REIT but they operate through a REIT subsidiary.
And then there are some that have both Canadian and U.S properties.
- Morguard (MRG.UN)
- H&R (HR.UN).
This list is not exhaustive. There are probably more that I am not considering, as I am less familiar with Canadian REITs than U.S. REITs.
The lack of a natural investor base makes these companies often go overlooked by the market. It is awkward for U.S. investors to invest in these due to potential tax complications of holding a foreign security, and it is hard for Canadian investors to analyze as the properties would be located in a foreign country (the U.S.).
I think there is quite a bit of opportunity here. For those interested in investing in the area, use caution when trading, as volumes on the foreign ordinaries can be quite low. Bid/ask spreads can be as much as 10% of the stock’s price making market orders remarkably expensive to execute. Use limit orders and patience. It frequently takes us many days of dangling low-ball limit orders to get a fill.
Wrapping it up
Canadian REIT valuations make them fertile ground for investment, but one must really know what they are doing. Beware the high leverage and small scale. I believe there is ample reward here for those who can discern between the dangers and the opportunities.
Editor's Note: This article discusses one or more securities that do not trade on a major U.S. exchange. Please be aware of the risks associated with these stocks.
So far, Portfolio Income Solutions subscribers consist largely of investment professionals, whether current or retired. That’s great, I love having an educated readership as they ask questions that challenge me to dig deeper. At the same time, I believe financial information should be available to all and that financial education is foundational to success in life. As such, I have launched REIT University, a new branch within Portfolio Income Solutions and am offering a large discount to those who want to learn. It contains a crash course in fundamental investment and goes deep into REIT specific analysis.
Grab a free trial and start learning today!