
Capuski
Before getting into the mortgage REITs, I want to talk about a few other investments with big dividend yields.
Can we start with Medical Properties Trust (MPW)?
I made a mistake with MPW. I had other stuff on my plate, so I walked away after a great bearish rating.
Clearly, it turns out that I should’ve kept writing on the stock and following the research.
On one hand, I had a great rating and it played out as projected. On the other hand, I didn’t follow it long enough.
Thankfully, walking away after a big bearish win (price fell by about half) isn’t a dreadful mistake.
What happened in a single sentence? Tenants were not good.
Did I oversimplify? You try to do it in three words.
Someone will probably do it even better than me (in the comments), but that’s life.
What’s the difference between MPW and Realty Income (O)?
Everything.
Realty Income effectively manages their balance sheet and their cash flows while holding a diversified net lease portfolio with many tenants. To the best of my knowledge, 100% of Realty Income’s tenants are not Steward. So that’s pretty great.
MPW on the other hand, owned some hospitals and three jets.
Sucker Yield ETF
Next up, we have the Invesco KBW Premium Yield Equity REIT ETF (KBWY).
What if you picked equity REITs based on recorded dividend yield without worrying about due diligence?
Sounds foolish to most of my readers, but that’s a quick summary of how KBWY works.
My favorite thing about KBWY is competing against it. You’ve got to evaluate an analyst based on how they perform relative to index ETFs for their sector. After all, that’s the diversified approach many other investors may pick.
Hopefully, all this dreadful performance doesn’t wreck the ETF. Assets under management is only $218 million.
Do we have other equity REIT ETFs that buy sucker yields?
Here’s a nice chart for KBWY:
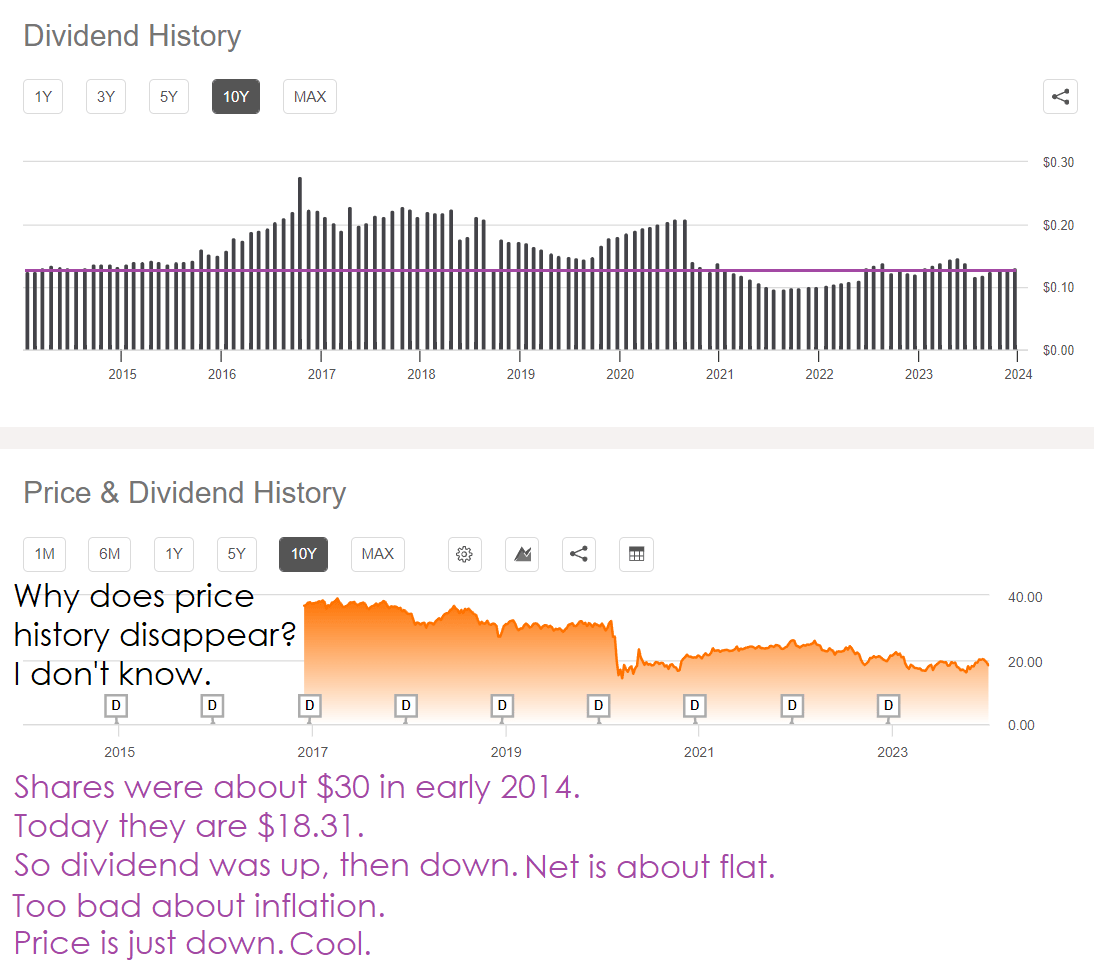
Seeking Alpha
On to smashing other things.
Mortgage REIT
Of course, there’s AGNC Investment Corp. (AGNC). Expecting a big book value gain from a great quarter, but not great enough to offset the big premium in the share price.
Investors are still pumped about the dividend yield, but AGNC’s hedge portfolio will gradually run out. Interest rate volatility is bad.
Try to come up with a reason that AGNC should have a much higher price-to-book ratio than Annaly Capital Management (NLY) and Dynex Capital (DX). If you reference the “dividend yield,” you automatically lose. That’s the amount the board of directors decided to pay out in a prior meeting. Try doing it on fundamentals. Explain how AGNC will actually produce that much more wealth over the long term.
I still like some of AGNC’s preferred shares. I don’t “dislike” any, but some are better deals than others. I think (AGNCN) is a tiny bit expensive (yield to call is around 0%), but shorting it would be stupid. Not just because borrowing preferred shares to short is hard. The preferred share pays a very nice yield that is still over 10%. Shorting that would be stupid.
There are some better alternatives, but investors are going to be prone to like AGNCN for more than just the high yield.
During the last two years, AGNCN’s early floating date allowed the price to be vastly more stable than other preferred shares from the same REIT. Anyone looking at the price history chart to assess “volatility” would probably decide that "AGNCN is less risky than other preferred shares with extremely similar traits." Hurray for historical data on price volatility leading future volatility projections.
Next up, we should discuss EFC-B (EFC.PR.B) vs EFC-C (EFC.PR.C). EFC-B is better because the price is much lower. It wins on future cash flows.
I’m not saying "after you wait four years, EFC-B will catch up on cash flows." No, investors who swap from EFC-C to EFC-B will pocket nearly $4 today.
Currently, the spread is about $3.89. The investor misses out on some “income” over the next several years. But not enough to offset the $3.89 or so they would pocket upfront.
The market has let this failure exist for a bit, which is funny.
BDCs
How about some BDCs?
I’m not going into a bunch of individual ratings. We have more bearish ratings than bullish ratings on BDCs at the moment. They’ve done well with the interest rate environment, but price-to-book ratios are pretty high. Risk of a recession is still elevated. Not feeling great about that.
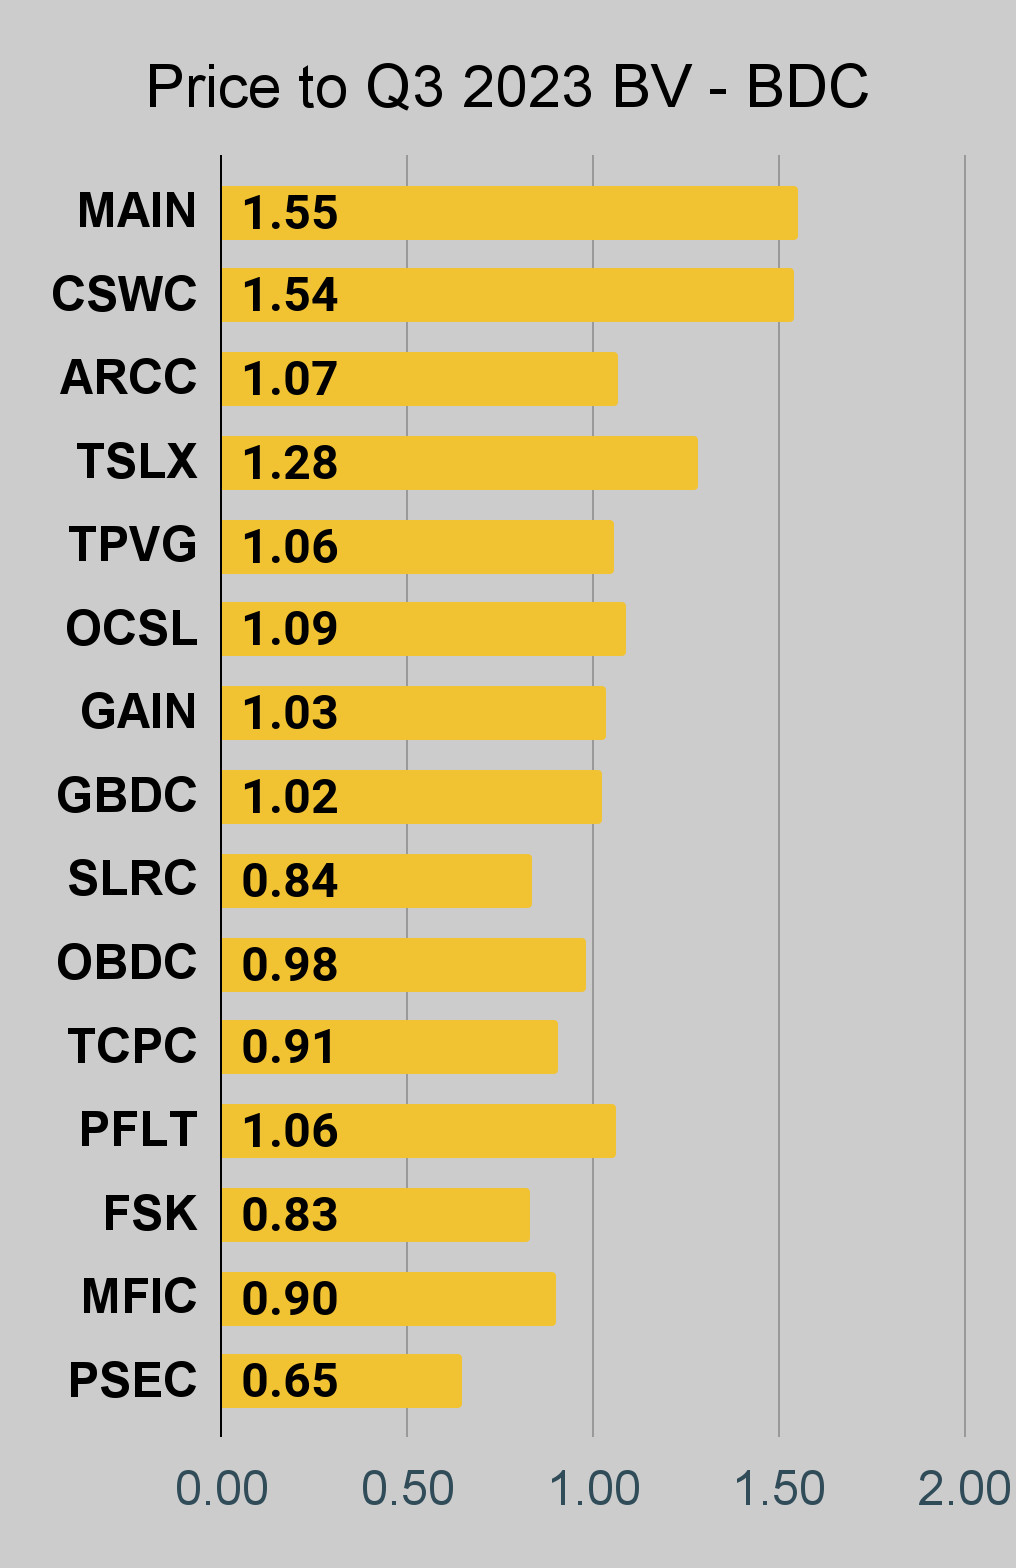
Capital Southwest (CSWC) trades at premium greater than 50% to our NAV (Net Asset Value) estimate. That’s pretty big.
To put that in perspective, Main Street Capital Corp. (MAIN) has a slightly smaller premium. What do they have in common besides the highest price-to-NAV ratios? They are both internally managed. That’s still worth a premium, but I sure wouldn’t pay 150% of NAV for CSWC. No offense to CSWC, but that’s a really big premium. MAIN has a long history as being the very best of the BDCs, so it's hard to ever catch them trading remotely close to NAV.
The only other BDC in our batch that trades at a premium larger than 10% of book value is Sixth Street Specialty Lending (TSLX). We think they deserve a premium to NAV, but the current premium is getting a bit big. It's near the top of our target range (where neutral would turn to bearish).
Stock Table
We will close out the rest of the article with the tables and charts we provide for readers to help them track the sector for both common shares and preferred shares.
We’re including a quick table for the common shares that will be shown in our tables:
Type of REIT or BDC | ||||
Residential Agency | Residential Hybrid | Residential Originator and Servicer | Commercial | BDC |
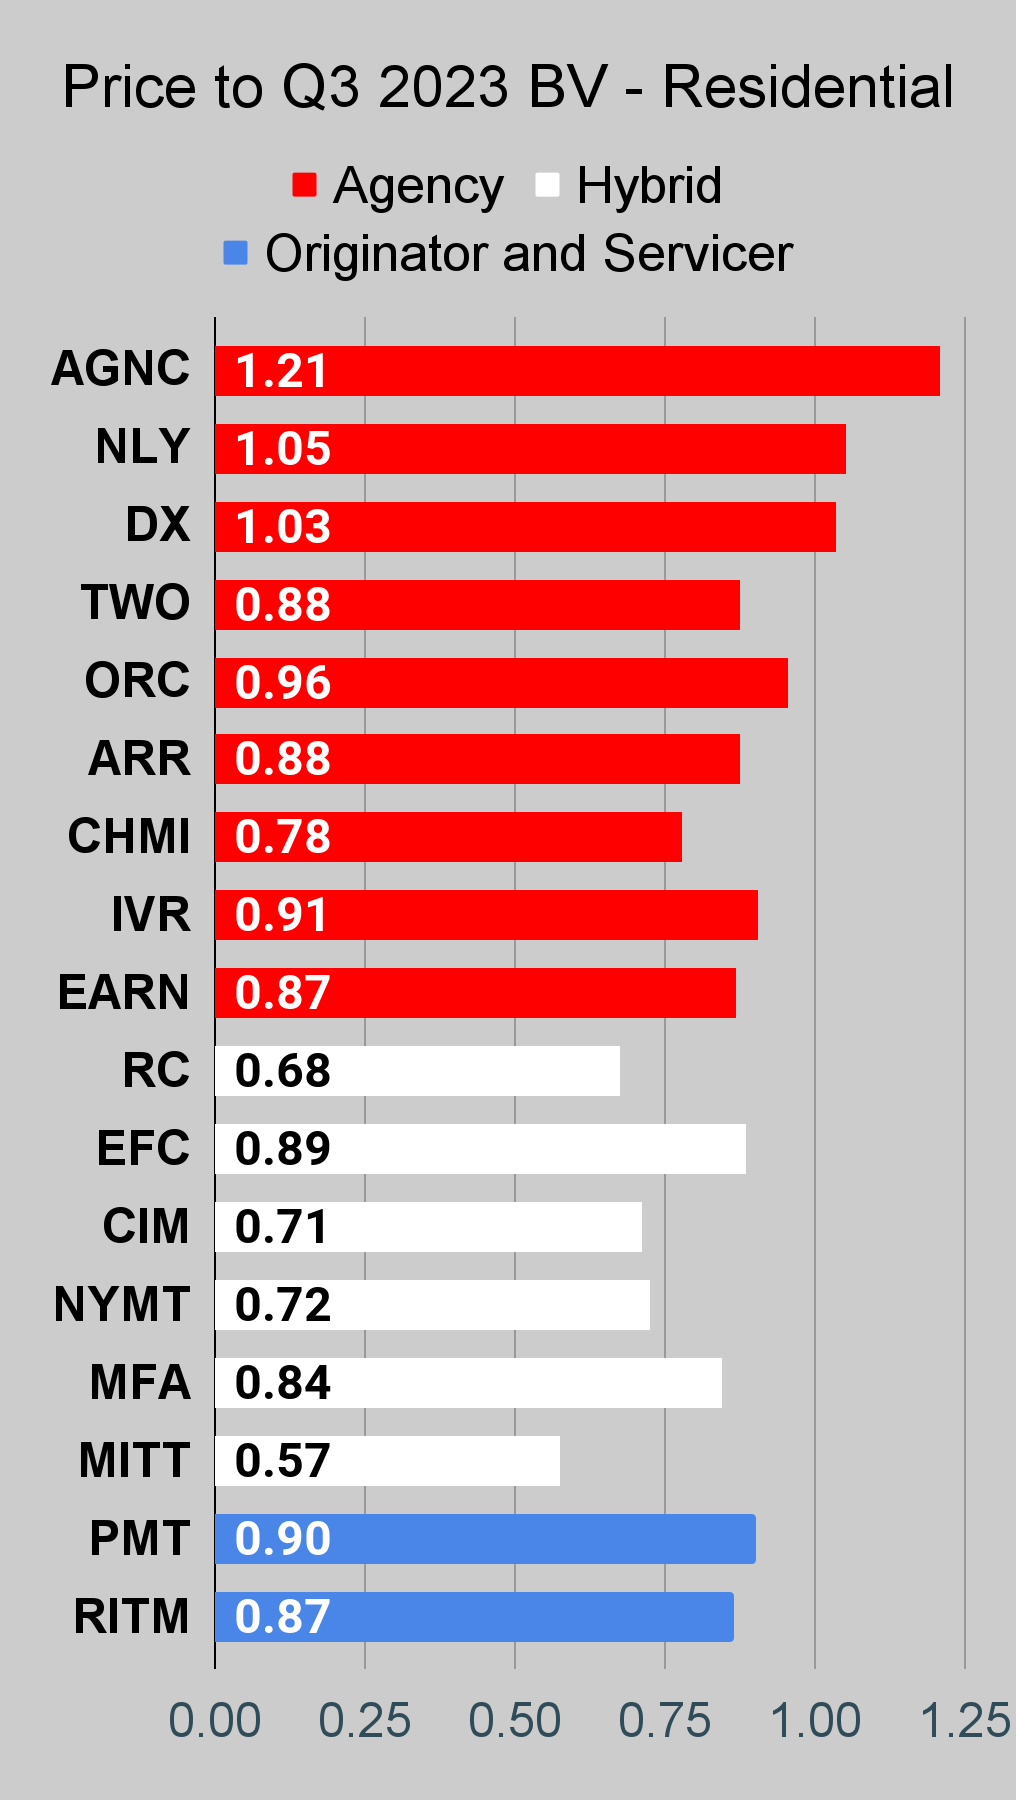
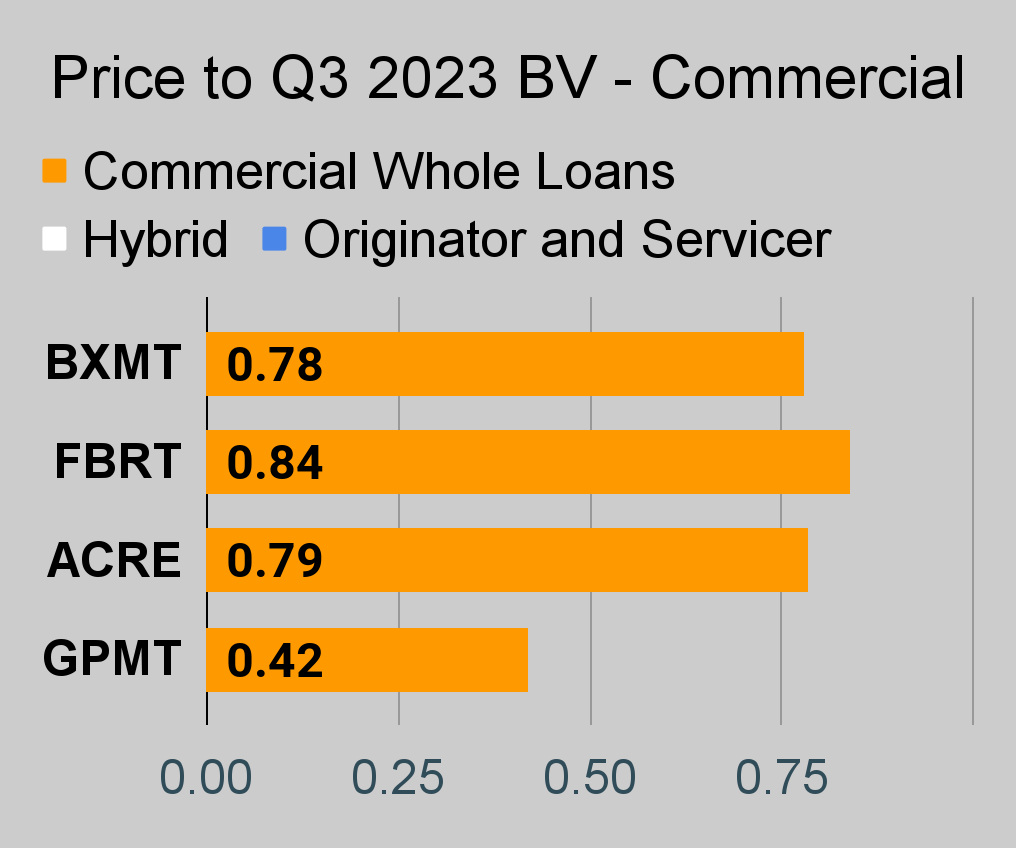
If you’re looking for a stock that I haven’t mentioned yet, you’ll still find it in the charts below. The charts contain comparisons based on price-to-book value, dividend yields, and earnings yield. You won’t find these tables anywhere else.
For mortgage REITs, please look at the charts for AGNC, NLY, DX, ORC, ARR, CHMI, TWO, IVR, EARN, CIM, EFC, NYMT, MFA, MITT, AAIC, PMT, RITM, BXMT, GPMT, WMC, and RC.
For BDCs, please look at the charts for MAIN, CSWC, ARCC, TSLX, TPVG, OCSL, GAIN, GBDC, SLRC, OBDC, PFLT, TCPC, FSK, PSEC, and MFIC.
This series is the easiest place to find charts providing up-to-date comparisons across the sector.
Notes on Chart Sorting
Within each type of security, the sorting is usually based on risk ratings. However, it's quite common to have a few shares that are tied. When the shares are tied for risk rating, the sorting becomes arbitrary. There may occasionally be errors where a share’s position is not updated quickly following a change in the risk rating. That can happen because the charts come from a separate system. When I update the system we use for members, it doesn’t change the order in the charts.
When I say "within each type of security," I’m referencing categories such as "agency mortgage REITs." The “hybrid mortgage REITs” are all listed after the "agency mortgage REITs." However, that does not mean RC (lowest hybrid) has a higher risk rating than the highest agency mortgage REIT. Each batch is presented by themselves.
PMT and RITM are tied for risk rating.
Finally, there’s an outlier. We don’t cover EARN. However, it was frequently requested for this series. Consequently, I added it to the charts. The important part here is that EARN was never assigned a risk rating. Since it has no assigned risk rating, it got lumped in at the top. However, I do not believe EARN would actually get a higher risk rating than IVR.
This could probably be written better. If someone feels inclined to take it upon themselves to write a section that's objectively better at communicating these points, I would be interested in using it. I’m grateful to have the best readers on SA. I attribute this to self-selection bias. I include enough things to offend the dumb people that I’m left with the best readers.
Residential Mortgage REIT Charts
Note: The chart for our public articles uses the book value per share from the quarter indicated in the chart. We use the current estimated (proprietary estimates) book value per share to determine our targets and trading decisions. It's available in our service, but those estimates are not included in the charts below. PMT and NYMT are not showing an earnings yield metric as neither REIT provides a quarterly “Core EPS” metric. Presently, a few other REITs also have no consensus estimate.
Second Note: Due to the way historical amortized cost and hedging is factored into the earnings metrics, it's possible for two mortgage REITs with similar portfolios to post materially different metrics for earnings. I would be very cautious about putting much emphasis on the consensus analyst estimate (which is used to determine the earnings yield). In particular, throughout late 2022 the earnings metric became less comparable for many REITs.
 The REIT Forum | 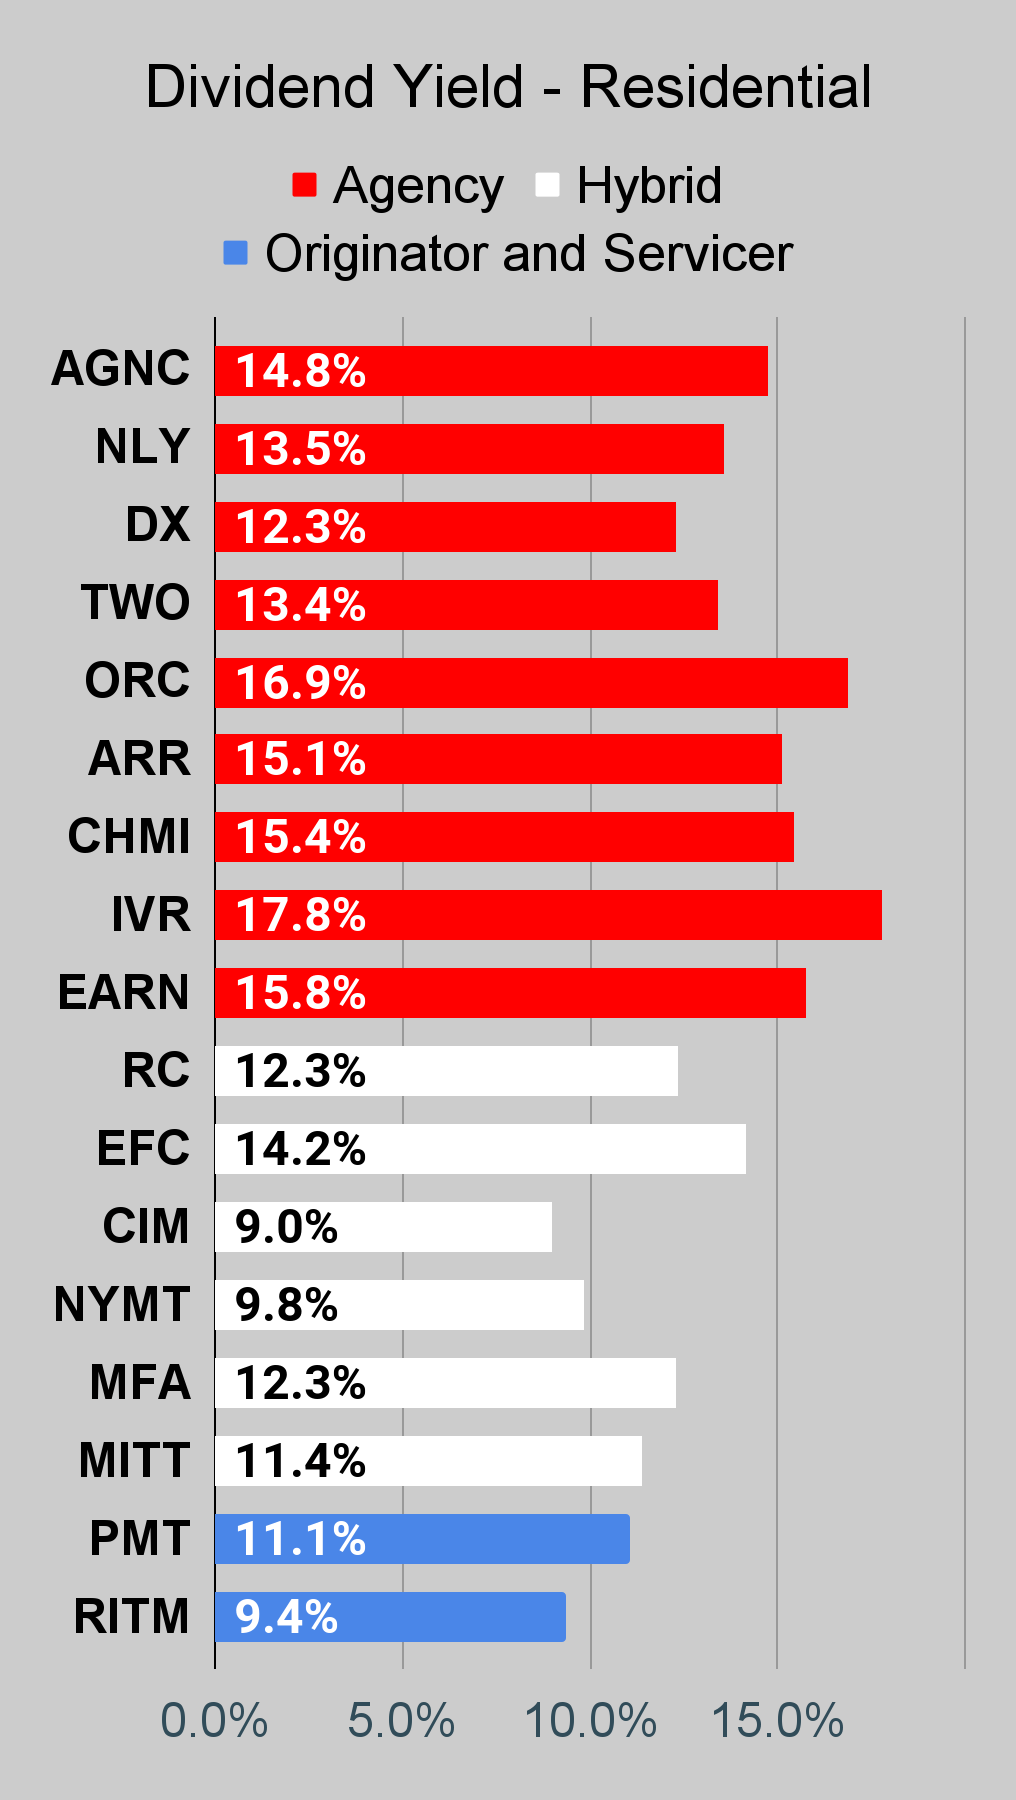 The REIT Forum | 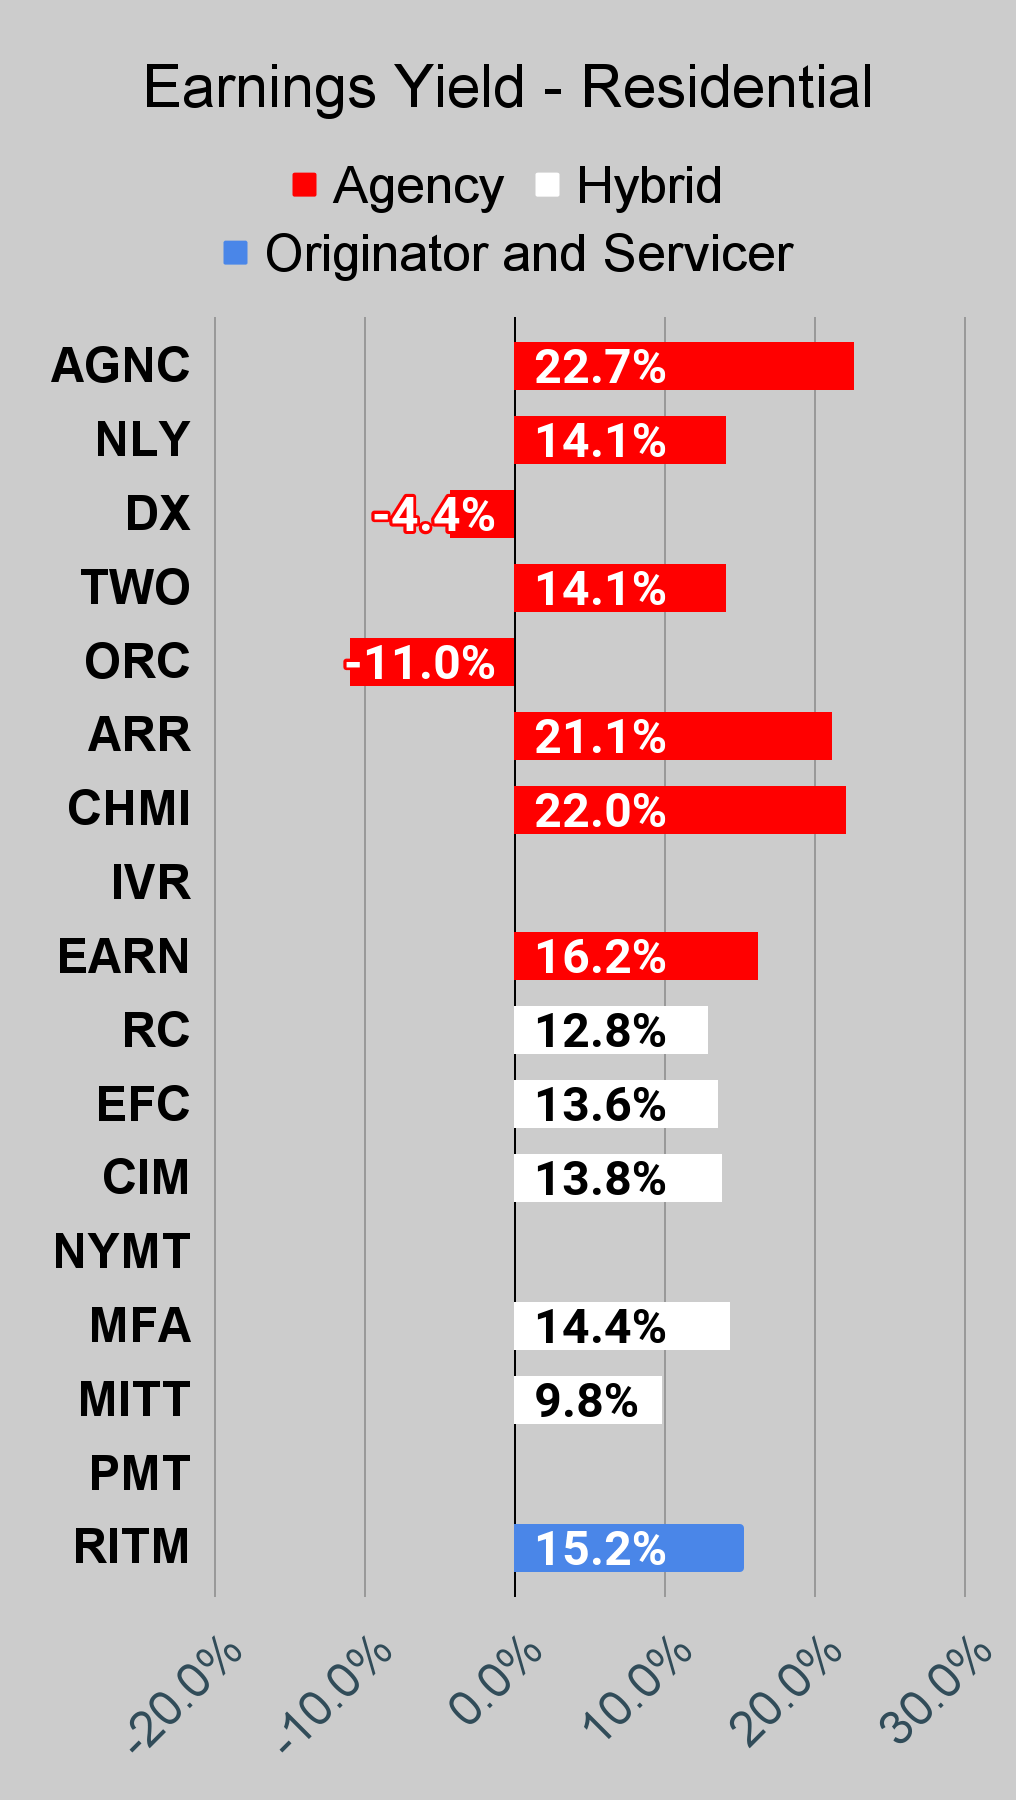 The REIT Forum |
Commercial Mortgage REIT Charts
 The REIT Forum | 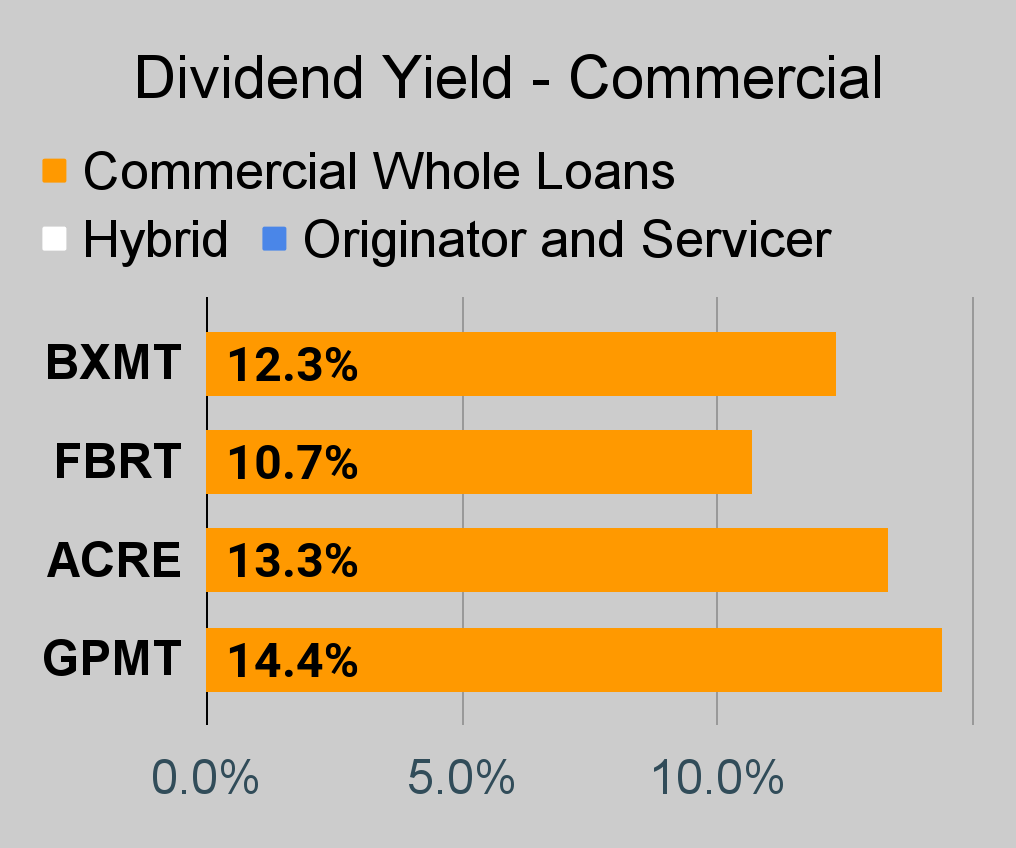 The REIT Forum | 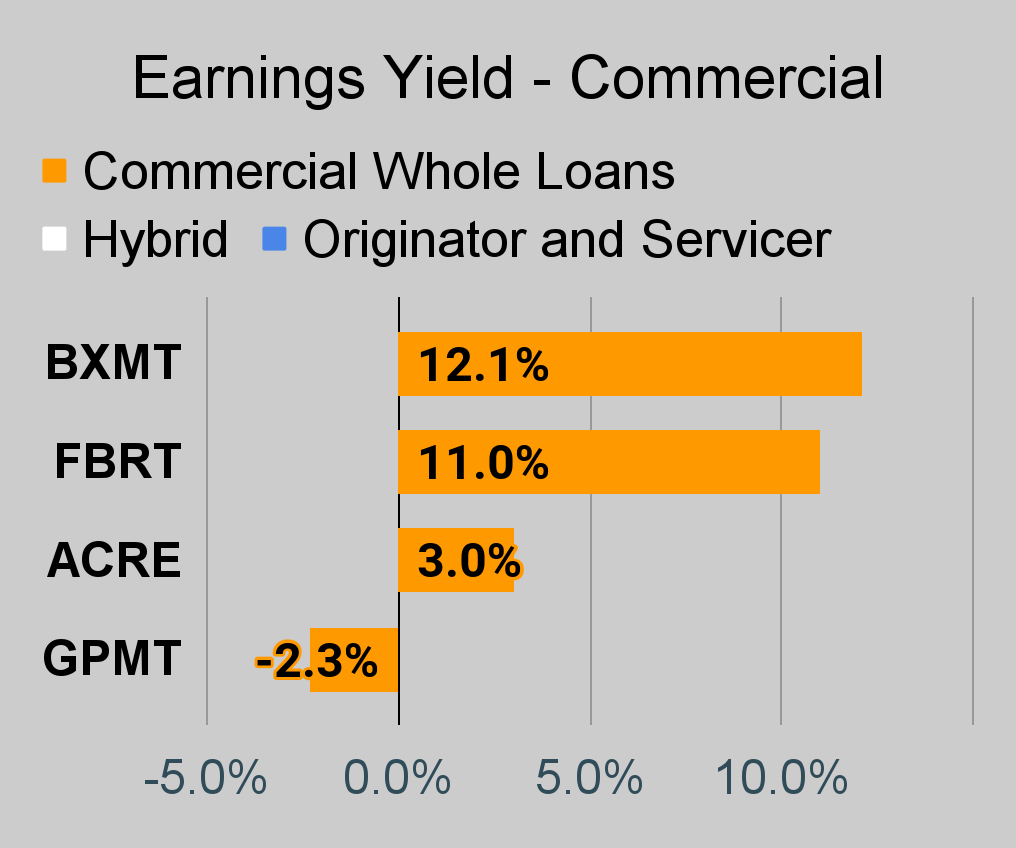 The REIT Forum |
BDC Charts
 The REIT Forum | 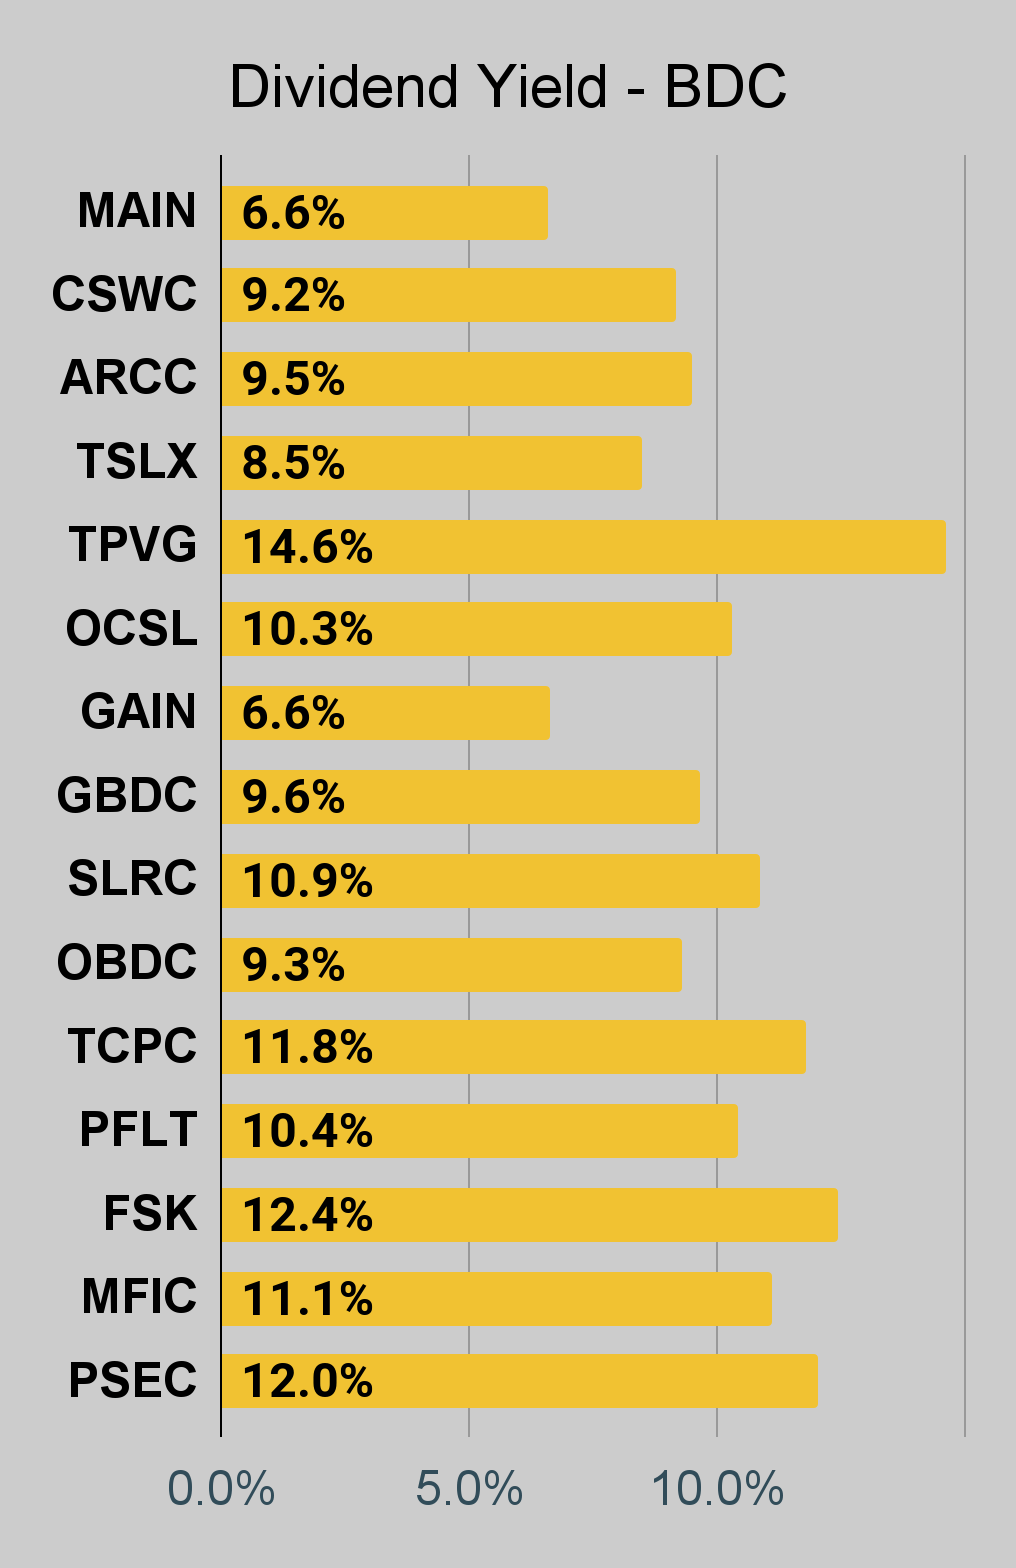 The REIT Forum | 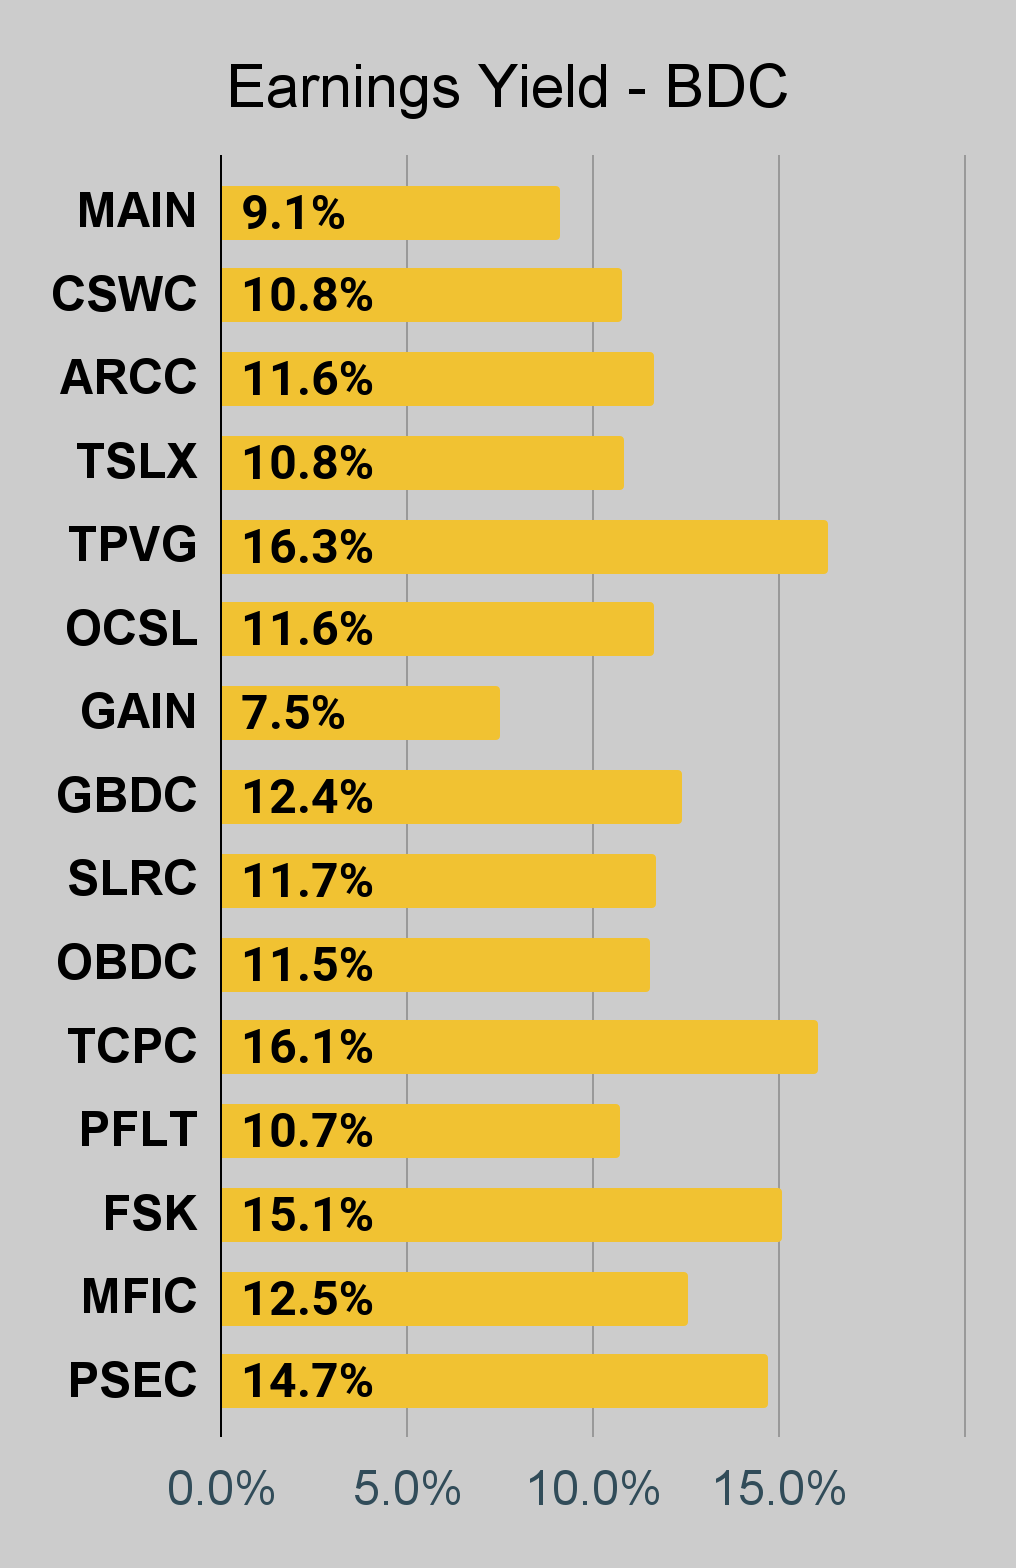 The REIT Forum |
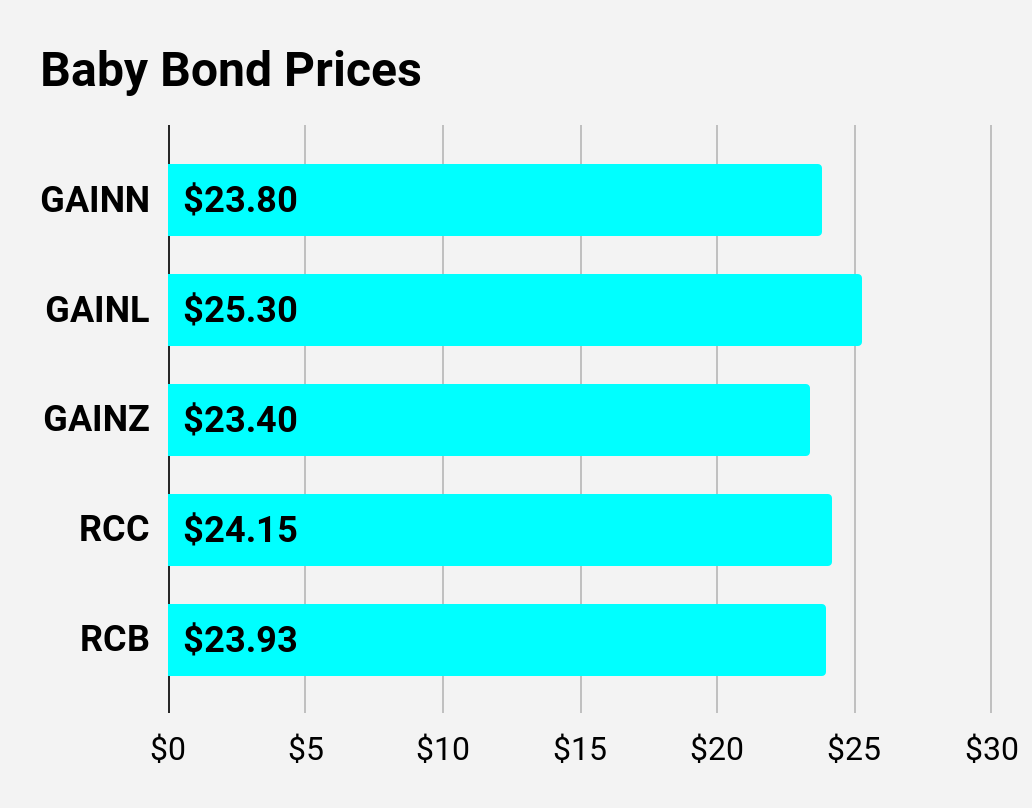
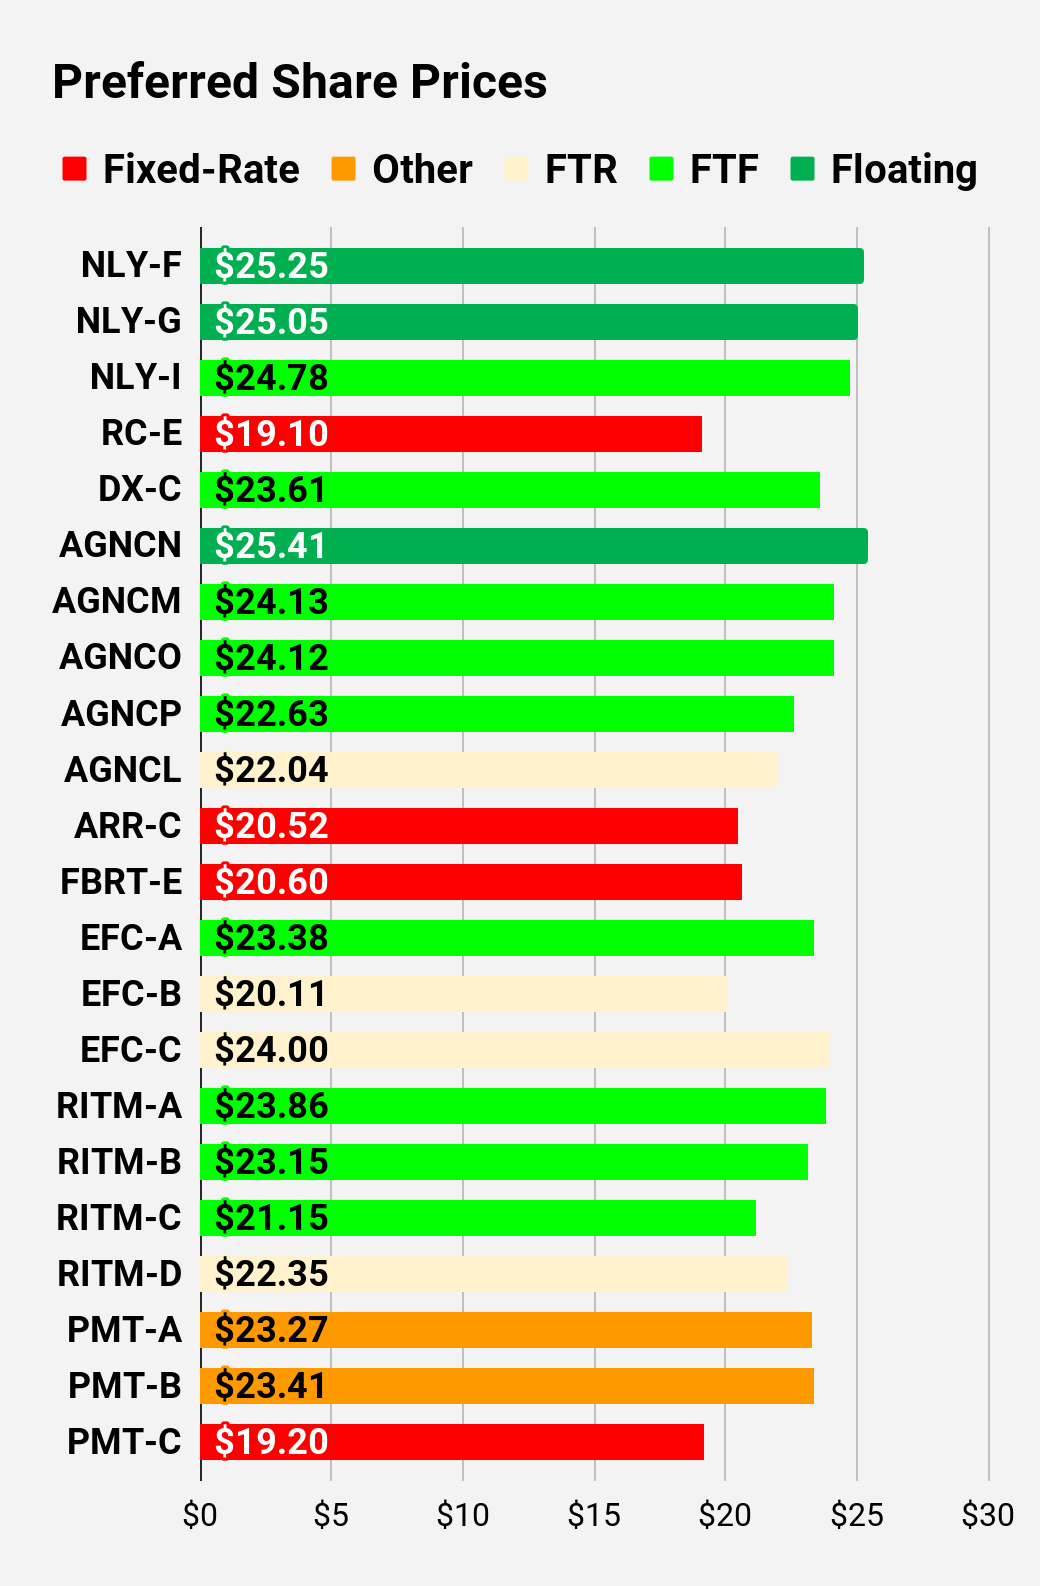
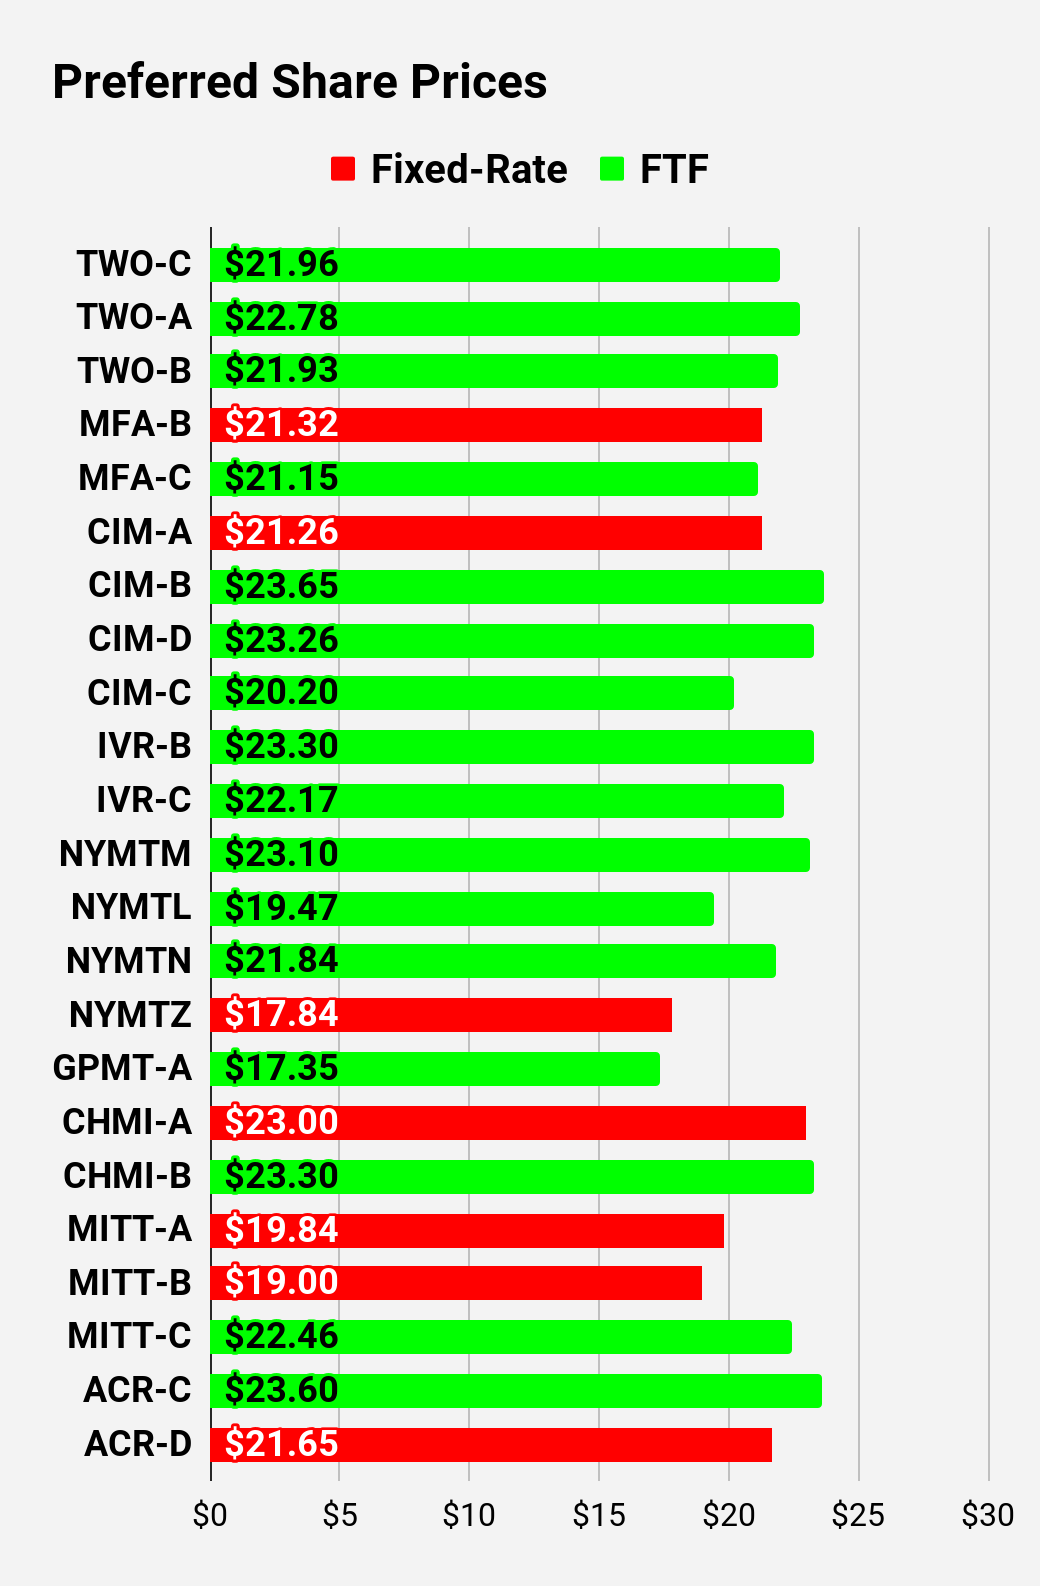
Preferred Share and Baby Bond Charts
I changed the coloring a bit. We needed to adjust to include that the first fixed-to-floating shares have transitioned over to floating rates. When a share is already floating, the stripped yield may be different from the “Floating Yield on Price” due to changes in interest rates. For instance, NLY-F already has a floating rate. However, the rate is only reset once per three months. The stripped yield is calculated using the upcoming projected dividend payment and the “Floating Yield on Price” is based on where the dividend would be if the rate reset today. In my opinion, for these shares the “Floating Yield on Price” is clearly the more important metric.
 The REIT Forum | 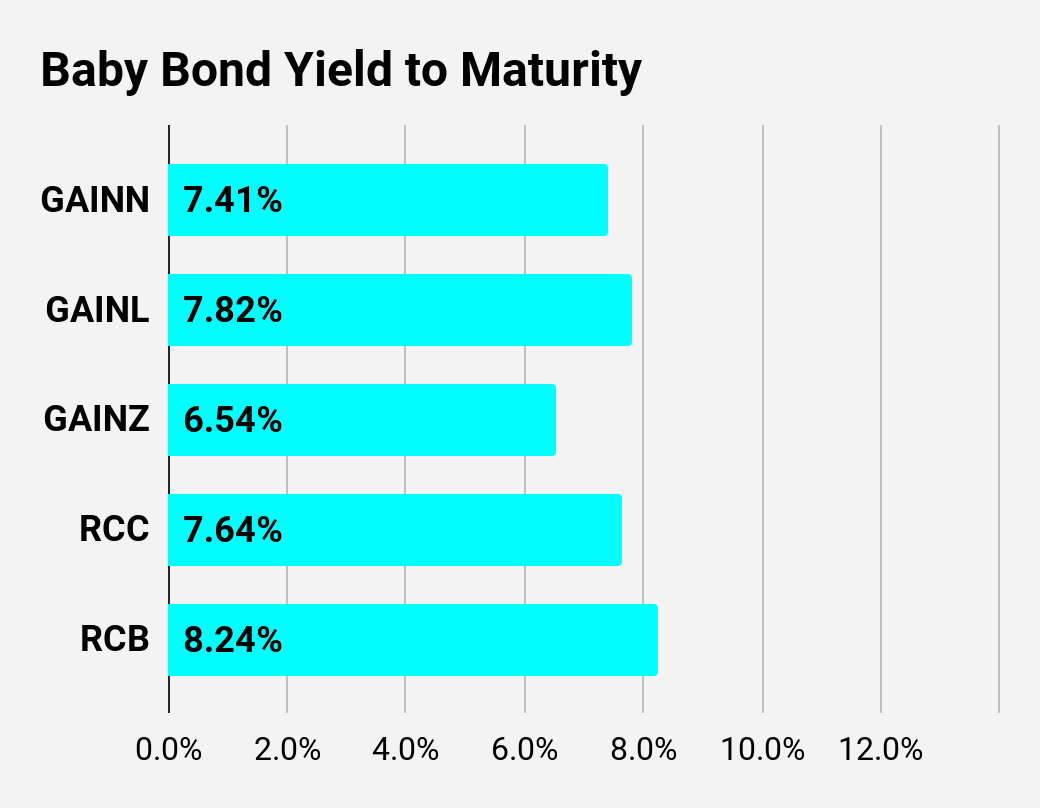 The REIT Forum | 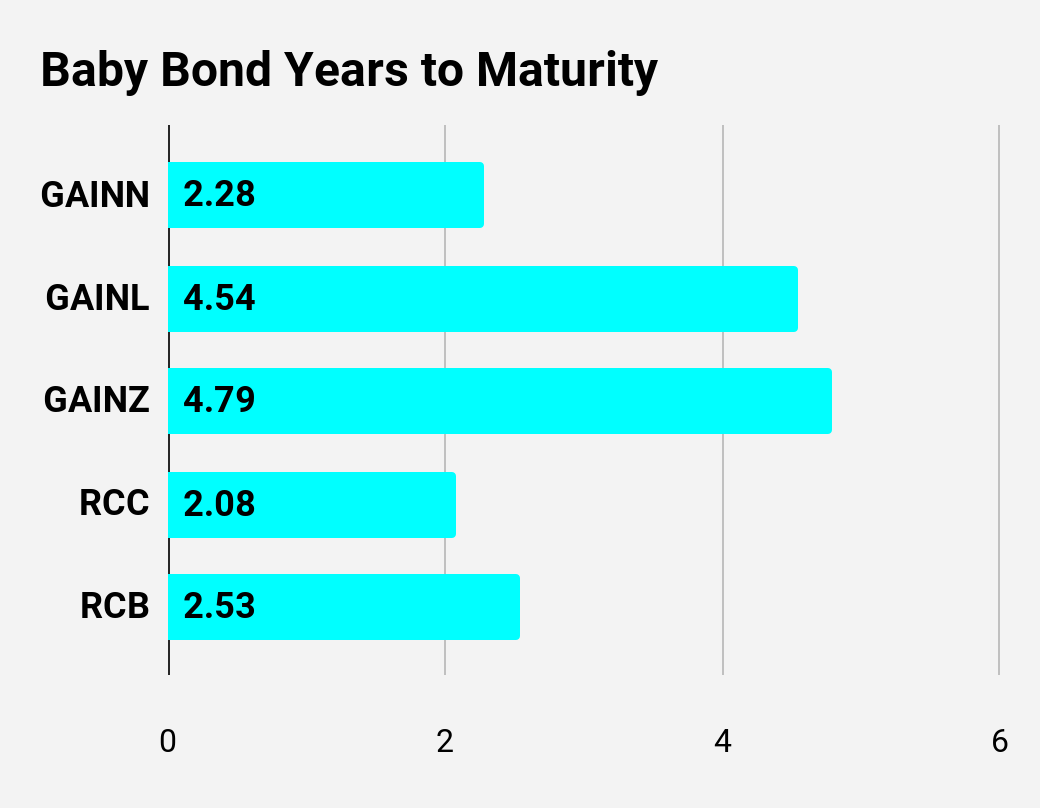 The REIT Forum |
 The REIT Forum | 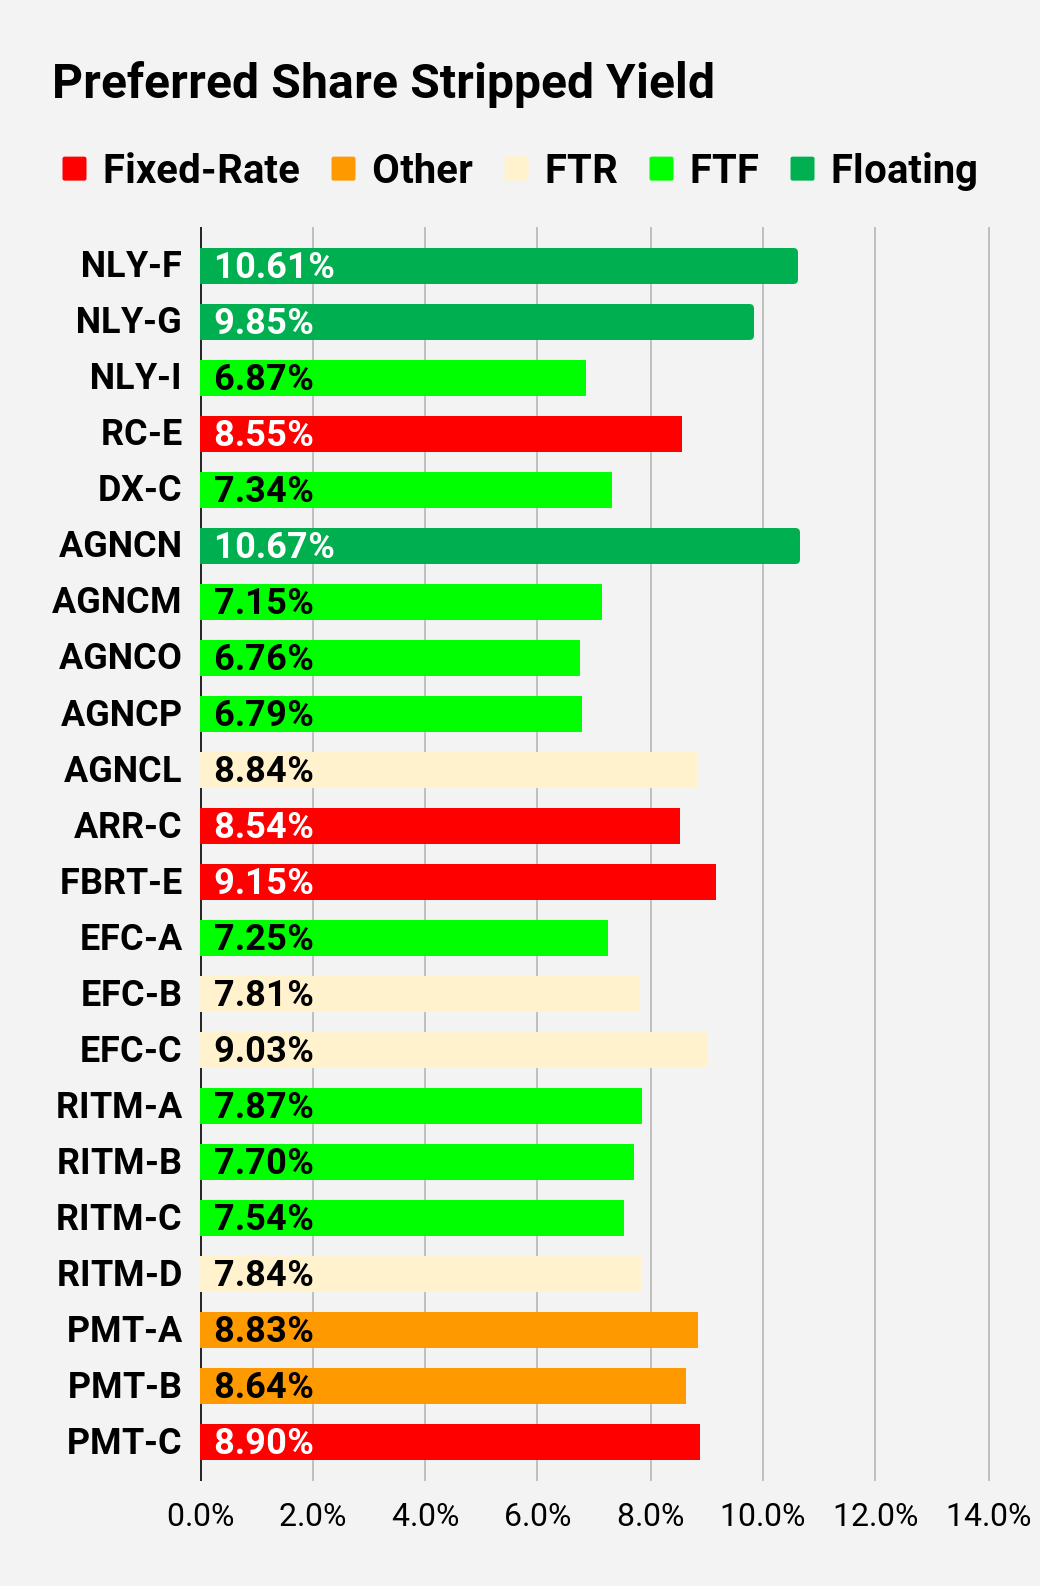 The REIT Forum | 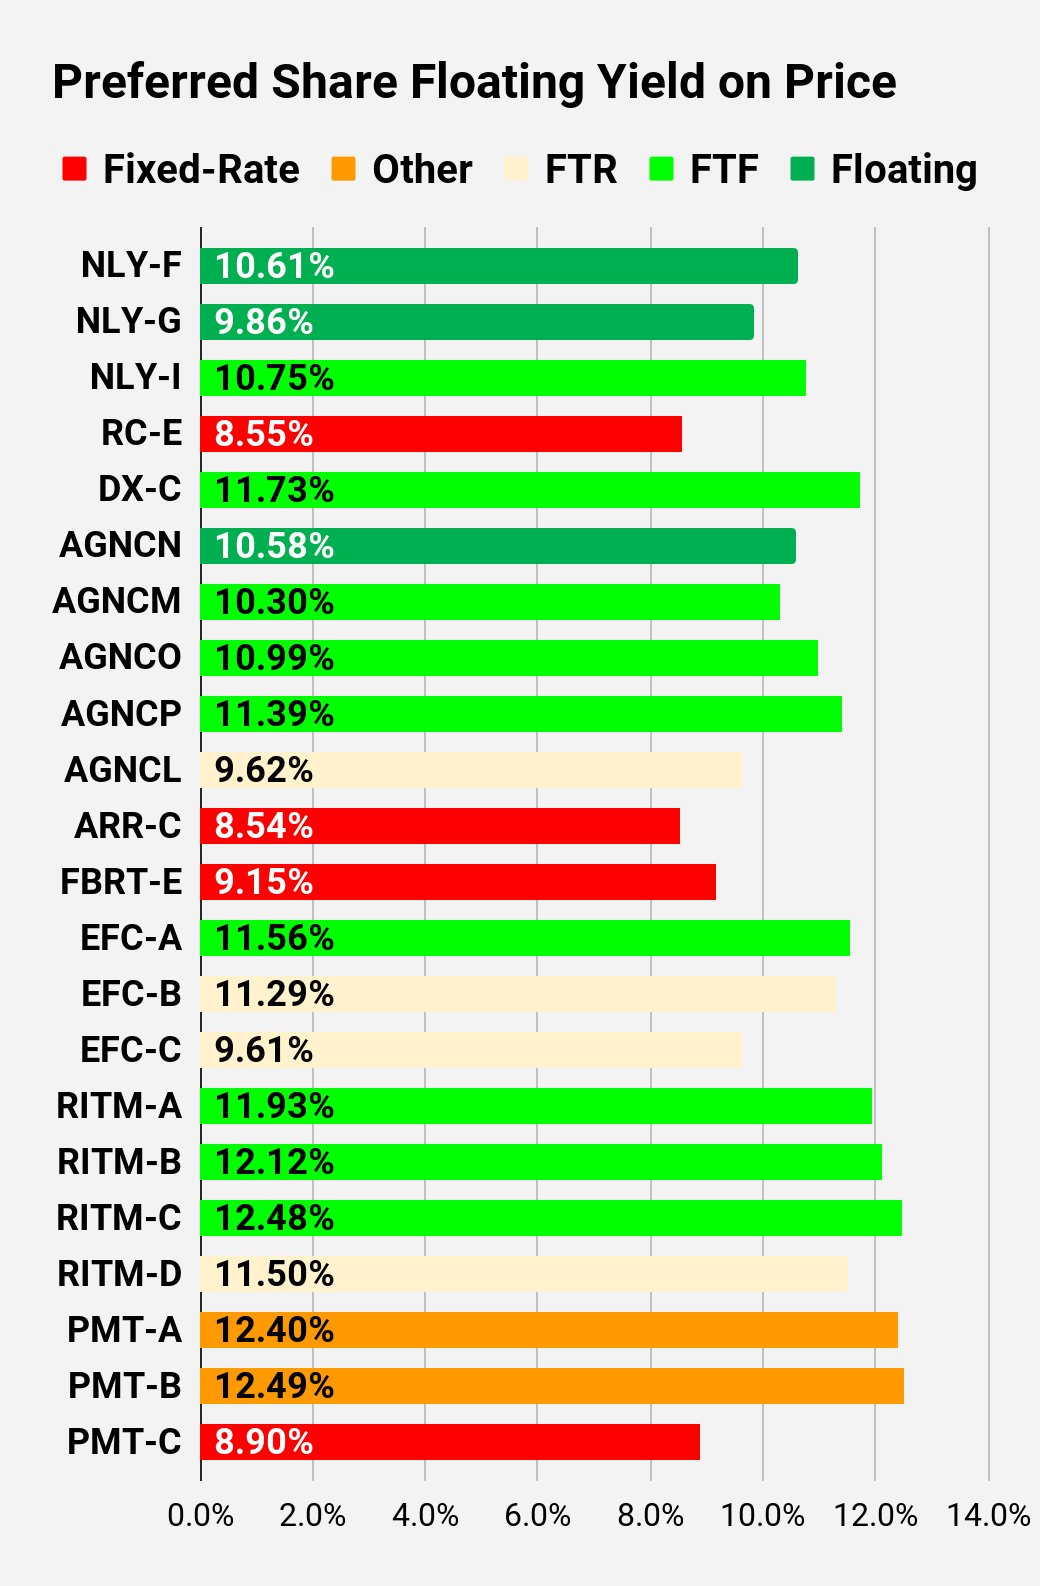 The REIT Forum |
 The REIT Forum | 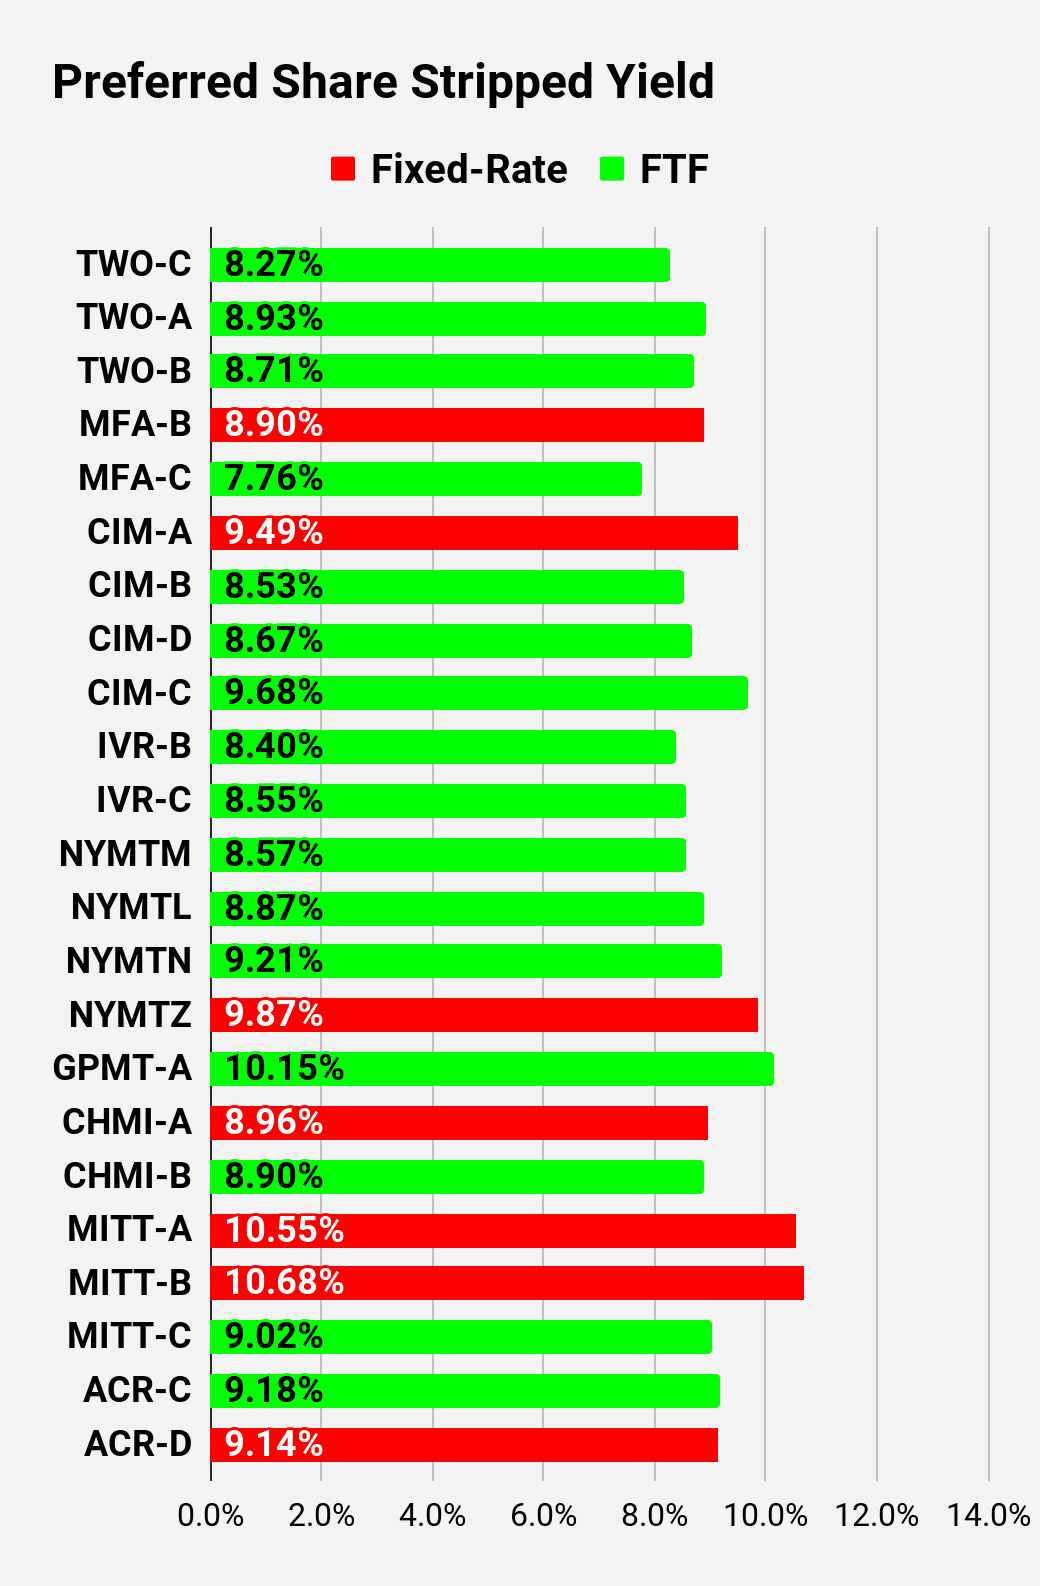 The REIT Forum | 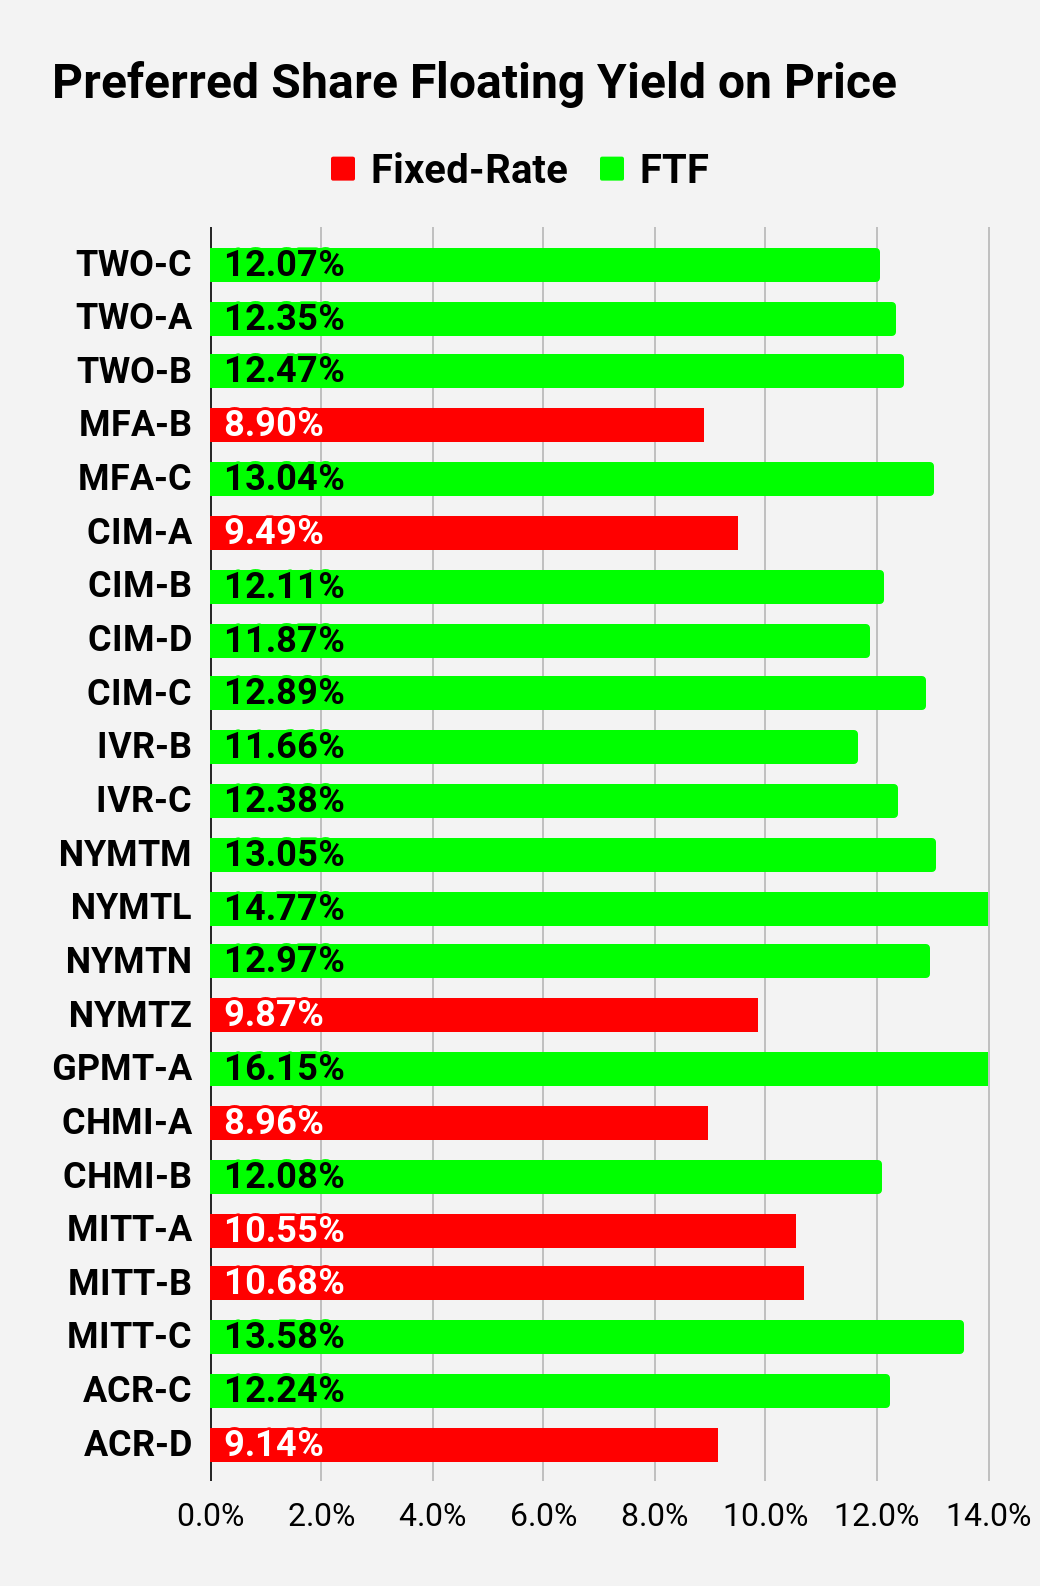 The REIT Forum |
Note: Shares that are classified as “Other” are not necessarily the same. We provide further distinction. For the purpose of these charts, I lumped all of them together as "Other." Now there are only two left, PMT-A and PMT-B. Those both have the same issue. Management claims the shares will be fixed-rate, even though the prospectus says they should be fixed-to-floating.
Preferred Share Data
Beyond the charts, we’re also providing our readers with access to several other metrics for the preferred shares.
After testing out a series on preferred shares, we decided to try merging it into the series on common shares. After all, we're still talking about positions in mortgage REITs. We don’t have any desire to cover preferred shares without cumulative dividends, so any preferred shares you see in our column will have cumulative dividends. You can verify that by using Quantum Online. We’ve included the links in the table below.
To better organize the table, we needed to abbreviate column names as follows:
- Price = Recent Share Price - Shown in Charts
- S-Yield = Stripped Yield - Shown in Charts
- Coupon = Initial Fixed-Rate Coupon
- FYoP = Floating Yield on Price - Shown in Charts
- NCD = Next Call Date (the soonest shares could be called)
- Note: For all FTF issues, the floating rate would start on NCD.
- WCC = Worst Cash to Call (lowest net cash return possible from a call)
- QO Link = Link to Quantum Online Page
Ticker | Price | S-Yield | Coupon | FYoP | NCD | WCC | QO Link | P-Link |
$23.80 | 7.41% | 5.00% | 7.41% | 2/17/2024 | $1.26 | |||
$25.30 | 7.82% | 8.00% | 7.82% | 8/1/2025 | $2.71 | |||
$23.40 | 6.54% | 4.88% | 6.54% | 2/17/2024 | $1.66 | |||
$24.15 | 7.64% | 5.75% | 7.64% | 2/17/2024 | $0.92 | |||
$23.93 | 8.24% | 6.20% | 8.24% | 2/17/2024 | $1.54 | |||
Second batch:
Ticker | Price | S-Yield | Coupon | FYoP | NCD | WCC | QO Link | P-Link |
$25.25 | 10.61% | 10.56% | 10.61% | 2/17/2024 | $0.11 | |||
$25.05 | 9.85% | 9.74% | 9.86% | 2/17/2024 | $0.28 | |||
$24.78 | 6.87% | 6.75% | 10.75% | 6/30/2024 | $1.07 | |||
$19.10 | 8.55% | 6.50% | 8.55% | 6/10/2026 | $9.75 | |||
$23.61 | 7.34% | 6.90% | 11.73% | 4/15/2025 | $3.55 | |||
$25.41 | 10.67% | 10.78% | 10.58% | 2/17/2024 | -$0.14 | |||
$24.13 | 7.15% | 6.88% | 10.30% | 4/15/2024 | $1.31 | |||
$24.12 | 6.76% | 6.50% | 10.99% | 10/15/2024 | $2.11 | |||
$22.63 | 6.79% | 6.13% | 11.39% | 4/15/2025 | $4.30 | |||
$22.04 | 8.84% | 7.75% | 9.62% | 10/15/2027 | $10.24 | |||
$20.52 | 8.54% | 7.00% | 8.54% | 1/28/2025 | $6.24 | |||
$20.60 | 9.15% | 7.50% | 9.15% | 2/17/2024 | $4.57 | |||
$23.38 | 7.25% | 6.75% | 11.56% | 10/30/2024 | $2.90 | |||
$20.11 | 7.81% | 6.25% | 11.29% | 1/30/2027 | $9.59 | |||
$24.00 | 9.03% | 8.63% | 9.61% | 4/30/2028 | $10.19 | |||
$21.02 | 8.38% | 7.00% | 8.38% | 2/17/2024 | $4.12 | |||
$24.90 | 8.34% | 8.25% | 11.36% | 3/30/2024 | $0.51 | |||
$23.86 | 7.87% | 7.50% | 11.93% | 8/15/2024 | $2.09 | |||
$23.15 | 7.70% | 7.13% | 12.12% | 08/15/2024 | $2.76 | |||
$21.15 | 7.54% | 6.38% | 12.48% | 02/15/2025 | $5.46 | |||
$22.35 | 7.84% | 7.00% | 11.50% | 11/15/2026 | $7.48 | |||
$23.27 | 8.83% | 8.13% | 12.40% | 3/15/2024 | $2.24 | |||
$23.41 | 8.64% | 8.00% | 12.49% | 6/15/2024 | $2.60 | |||
$19.20 | 8.90% | 6.75% | 8.90% | 8/24/2026 | $10.35 |
Third batch:
Ticker | Price | S-Yield | Coupon | FYoP | NCD | WCC | QO Link | P-Link |
$21.96 | 8.27% | 7.25% | 12.07% | 1/27/2025 | $4.85 | |||
$22.78 | 8.93% | 8.13% | 12.35% | 4/27/2027 | $8.81 | |||
$21.93 | 8.71% | 7.63% | 12.47% | 7/27/2027 | $9.73 | |||
$21.32 | 8.90% | 7.50% | 8.90% | 2/17/2024 | $3.94 | |||
$21.15 | 7.76% | 6.50% | 13.04% | 3/31/2025 | $5.89 | |||
$21.26 | 9.49% | 8.00% | 9.49% | 2/17/2024 | $4.02 | |||
$23.65 | 8.53% | 8.00% | 12.11% | 3/30/2024 | $1.86 | |||
$23.26 | 8.67% | 8.00% | 11.87% | 3/30/2024 | $2.25 | |||
$20.20 | 9.68% | 7.75% | 12.89% | 9/30/2025 | $8.20 | |||
$23.30 | 8.40% | 7.75% | 11.66% | 12/27/2024 | $3.65 | |||
$22.17 | 8.55% | 7.50% | 12.38% | 9/27/2027 | $9.87 | |||
$23.10 | 8.57% | 7.88% | 13.05% | 1/15/2025 | $3.88 | |||
$19.47 | 8.87% | 6.88% | 14.77% | 10/15/2026 | $10.26 | |||
$21.84 | 9.21% | 8.00% | 12.97% | 10/15/2027 | $10.67 | |||
$17.84 | 9.87% | 7.00% | 9.87% | 1/15/2027 | $12.42 | |||
$17.35 | 10.15% | 7.00% | 16.15% | 11/30/2026 | $12.68 | |||
$23.00 | 8.96% | 8.20% | 8.96% | 2/17/2024 | $2.12 | |||
$23.30 | 8.90% | 8.25% | 12.08% | 4/15/2024 | $2.15 | |||
$19.84 | 10.55% | 8.25% | 10.55% | 2/17/2024 | $5.47 | |||
$19.00 | 10.68% | 8.00% | 10.68% | 2/17/2024 | $6.30 | |||
$22.46 | 9.02% | 8.00% | 13.58% | 9/17/2024 | $4.01 | |||
$23.60 | 9.18% | 8.63% | 12.24% | 7/30/2024 | $2.49 | |||
$21.65 | 9.14% | 7.88% | 9.14% | 5/21/2026 | $7.90 |
Strategy
Our goal is to maximize total returns. We achieve those most effectively by including “trading” strategies. We regularly trade positions in the mortgage REIT common shares and BDCs because:
- Prices are inefficient.
- Long term, share prices generally revolve around book value.
- Short term, price-to-book ratios can deviate materially.
- Book value isn’t the only step in analysis, but it's the cornerstone.
We also allocate to preferred shares and equity REITs. We encourage buy-and-hold investors to consider using more preferred shares and equity REITs.

You should try our service. Unlike most services, our service is backed by a real portfolio. Not a "model" portfolio. Not hypothetical positions. Not 7 different portfolios we made up in Google Sheets so we can brag about the good one. None of that crap.
You get real-time alerts on every trade. See current and past positions. I'm sick of analysts who have to retroactively pick a "portfolio" or get creative about defining "returns". Beat the index or get out.
Ask your analyst to share their portfolio value each month so you can verify their returns. When they object, try us.