WILLSIE/iStock via Getty Images
Comparing REITs Poorly
Imagine two real estate investment trusts or REITs:
- Both have $2.00 per share of interest income per share.
- Both have $.10 per share of overhead expenses.
- One has $1.00 per share of net interest expense (leaving $.90).
- The other has $0.10 per share of net interest expense (leaving $1.80).
Is the one with twice as much interest income per share twice as good?
Maybe, maybe not. You don't actually have the relevant information to make that decision. The pieces of data I provided are vastly inadequate to answer the question.
What if the $.10 per share of net interest expense will jump to $1.00 per share of net interest expense next year because hedges will run out?
That should be a big deal, but investors today are simply not evaluating it effectively.
Comparing Interest Income Poorly
Let's say you have two mortgage REITs, or mREITs, that own mortgage-backed securities, or MBS, with a 3.0% coupon rate.
Let's say those trade at $85 per $100 of face value (close enough to today's pricing).
One bought the MBS at $105 per $100 of face value about 2 years ago.
The other just bought the MBS at $85.
Each mortgage REIT owns $85 (fair value) of MBS and $100 (face value or par value) of MBS.
Two questions:
- Which asset is more valuable?
Neither. They are each worth $85.
- Which one produces more income?
The one bought for $85.
Why? Because interest income on these securities is usually based on the historical yield on the purchase price.
- One REIT is recording a 3% coupon and amortizing a premium of $5. The result is a yield below 3%.
- The other REIT is recording a 3% coupon and amortizing a discount of $15. The result is a yield much higher than 3%. This would come in somewhere around 5.0% to 5.5%.
See the problem?
Some investors are thinking that the mortgage REIT that bought the MBS at $85 is a better investor. That's far too simplistic. The same REIT may own both positions. It is simply reinvesting the principal as those payments come in.
Let us get a bit more absurd.
Distorting Interest Income
The REIT that paid $105 could sell their position for $85 and buy another very similar MBS for $85. They record a "realized loss" on the position they closed, but their new position has that 5.0% to 5.5% yield. Wow, look at that! They've dramatically improved their yield on assets. Brilliant! This is clearly the most talented bond investor ever!
Many investors don't understand this. Remarkably, many "analysts" don't understand it, either.
There could be legitimate reasons for an mREIT to make very similar trades though. What if they sold their MBS at $85 and bought a different batch of MBS with a slightly higher coupon rate at $90? That trade could simply be management trying to adjust their exposure to interest rates. There would be nothing wrong with making that trade to modify their interest rate exposure.
Why It Matters
As I have referenced over many articles, AGNC Investment Corp. (AGNC) trades at a higher price-to-book ratio than Annaly Capital Management, Inc. (NLY) and Dynex Capital, Inc. (DX). Many investors have indicated in our comments that the only mortgage REIT they still own is AGNC.
Their stance is simple:
- They won't "sell" AGNC until it rallies hard.
- They won't "reallocate" to a peer with a lower valuation and a similar portfolio.
Just imagine that. An investor who owns a $100 asset trading at $112 declaring they have no interest in owning a similar security at $102 or $100.
If an investor believes AGNC is worth a 12% premium to book value, they should be very interested in either NLY or DX. Yet that interest isn't present. When I point this out, they usually just state that they are long AGNC and think it will go up. No counterpoint. No consideration. Just reiterating the same view they had before.
I don't expect everyone to change their mind. Yet I'm struck by how many investors seem undeterred by their inability to articulate their reason for owning that position.
Sometimes it leaves me wondering if I haven't sent my message clearly enough. Realistically, this is probably a bias in my mental process. When people ignore logic, I tend to assume that I'm not being clear enough or loud enough. Sometimes that leads to awkward situations, but this isn't the time for discussing how many idiots I've met in my life. I'm sure you've met many as well.
If investors genuinely understood the difference in valuation, would they really stand by their decisions?
While we were warning investors away from the common shares, the preferred shares offered a more attractive risk/reward profile. Consider the performance of AGNC relative to two of their preferred shares, (AGNCP) and (AGNCN):
The REIT Forum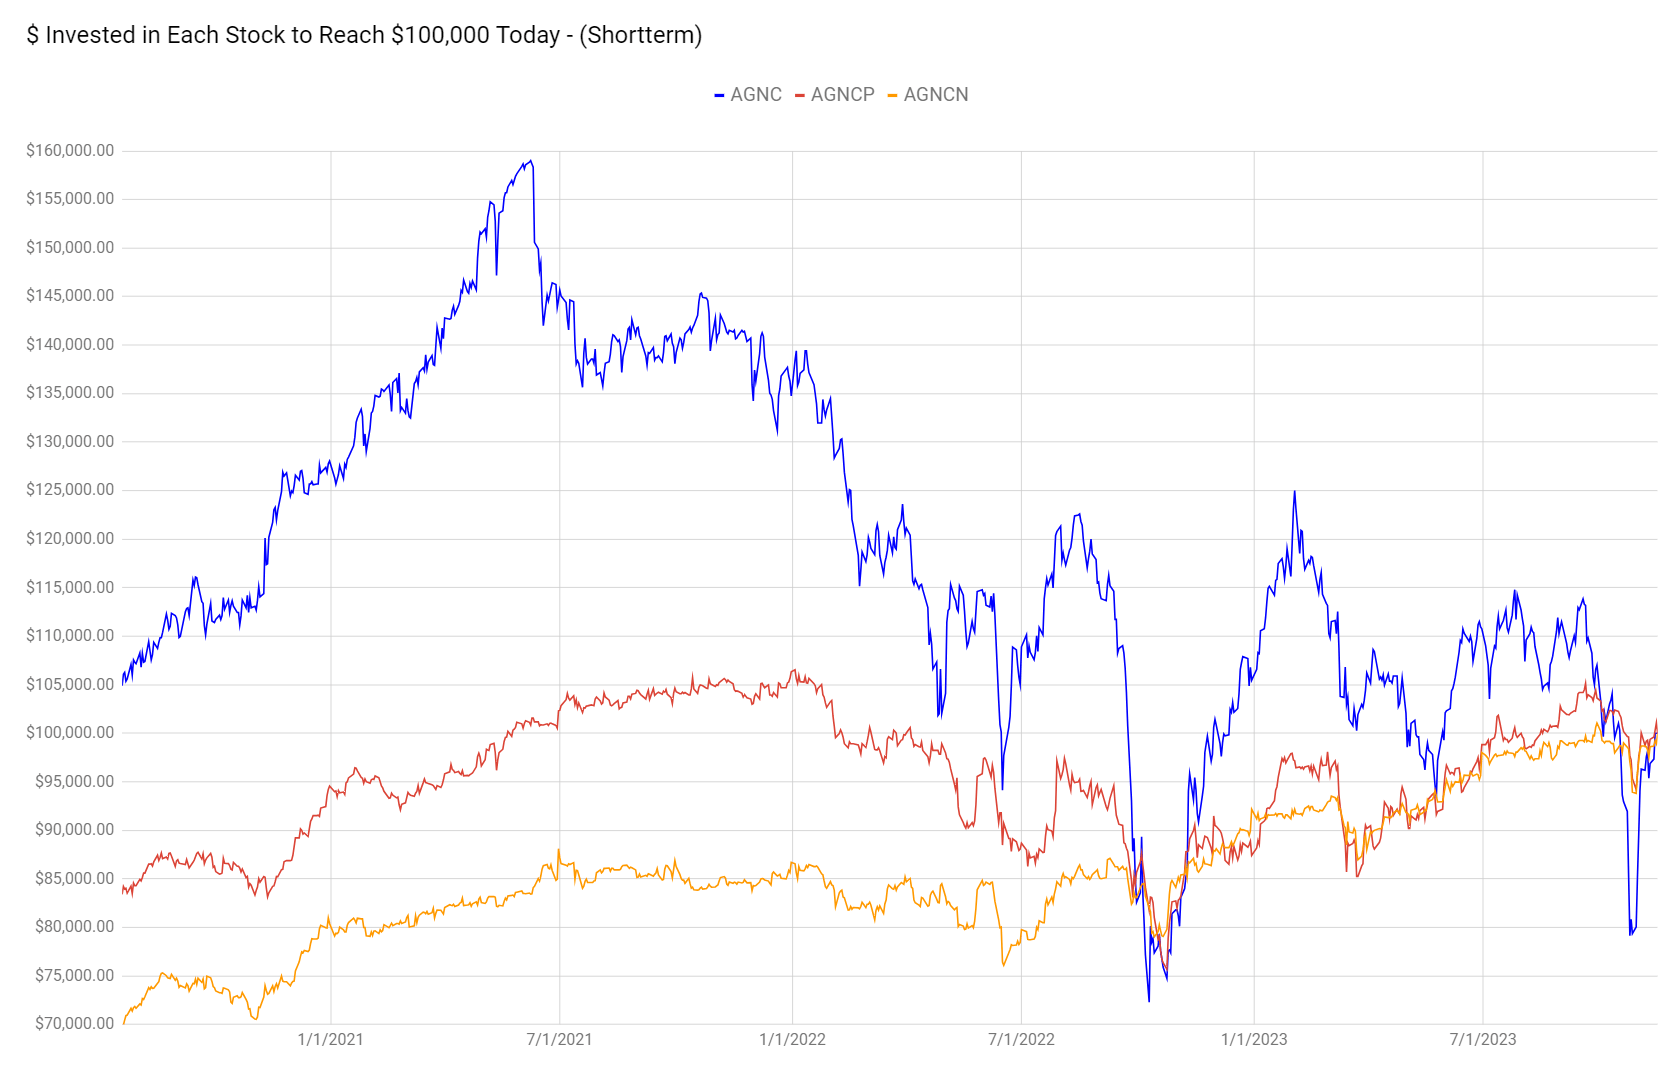
The preferred shares offered lower volatility and better returns.
Most of the time, long-term investors will want to pick either preferred shares or business development companies ("BDCs") over mortgage REITs. However, there are great opportunities for trading in both kinds of stocks. We're just here to make money. These stocks are tools to do that. Sadly, many investors try to marry a trade. They compound the problem by not caring about whether they are actually getting a good entry point. They just declare that they are in it for the income and don't care about swings in the share price.
Really, you don't care about that?
Seeking Alpha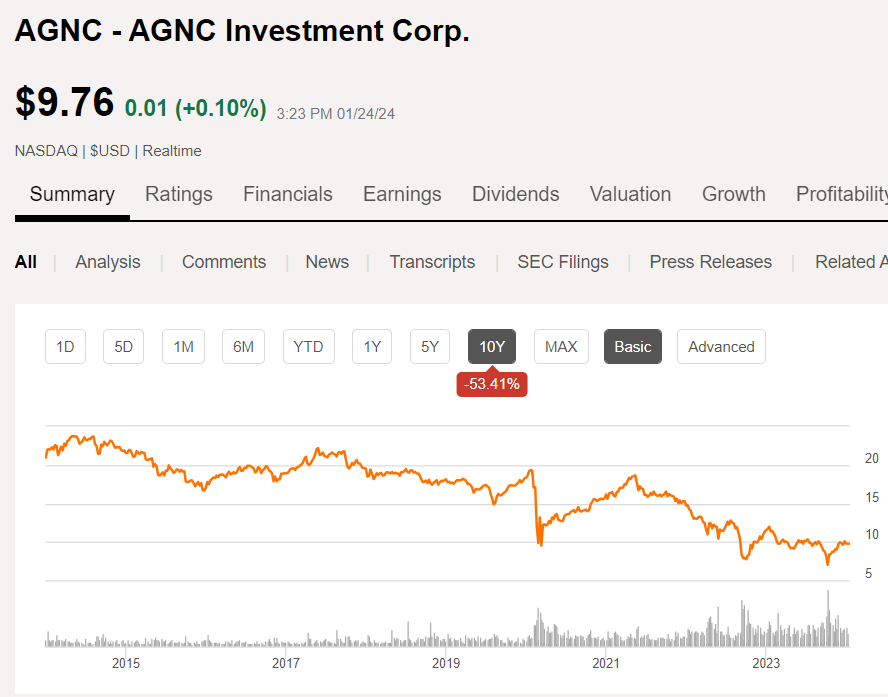
I would care. That seems like a big deal to me. If you're spending the dividends to pay for living expenses, then the portfolio value just keeps declining.
Of course, dividend cuts are pretty common as well. Common shares often see dividend reductions. That's only natural, since the book value, which management is using to invest, tends to decline over time.
However, you can also see in the chart that very sharp moves are often overdone.
What REITs Want
Many REITs saw book value fall significantly over the last few years. Results from Q4 2023 should generally show increased book value for agency mortgage REITs. Some increases will be bigger than others. It's possible that we might see some losses, but we're projecting for small to medium gains throughout the agency mortgage REITs. However, it won't be enough to offset the drop since 2021.
Thankfully, the REITs should be able to sustain higher levels of dividends relative to book value in this environment. However, there is still plenty of risk that a swing in interest rates could harm book value. Since the end of December 2023, we've seen 10-year Treasury rates (US10Y) increase quite a bit. The agency mortgage REITs would prefer that rates remain fairly stable.
The hybrid mortgage REITs often have more credit risk. Many of them would prefer to see lower rates with a stronger economy since that combination would improve the reward profile for their assets.
Dividends In Danger
I'll highlight one example of a risky dividend.
Orchid Island Capital, Inc. (ORC) has a particularly risky dividend. It isn't just because core earnings turned negative. They are paying out a very high rate on book value. Better peers are paying out lower rates on book value. That's going to be harder to support. ORC is no stranger to cutting dividends. They've done it before, and I see no reason to think it won't happen again. That doesn't mean they have to announce a cut immediately. However, another cut wouldn't be surprising. Their last cut was in late 2023 and took the dividend from $.16 to $.12 per share. Hold up, late 2023? Yeah, it was pretty recent. In 2021, the dividend was $.30. Going back to 2019, it was $.40. Going back to 2014, it was $.90. Of course, these numbers are adjusted for a reverse split that happened along the way.
BDC Prices in Danger
What about BDCs? They have performed much better than mortgage REITs.
However, BDCs are facing a different risk. Investors are looking for places to put money. Quite a few picked BDCs. Many of them are trading very close to 52-week highs.
The REIT Forum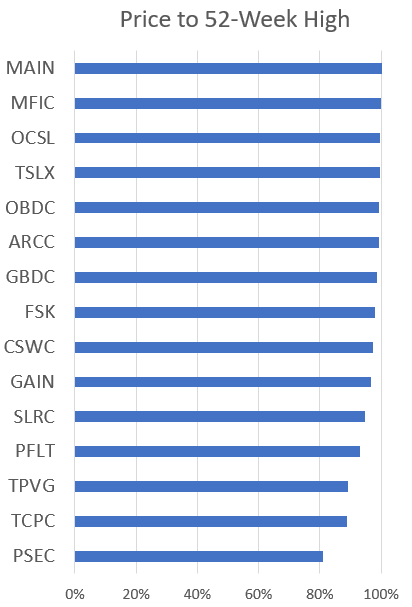
That's a rough situation for investors. Sometimes all stocks may feel like momentum stocks, but that just isn't the case. In this scenario, having so many stocks around 52-week highs is leaving minimal upside for shareholders. The best case scenario is that they collect the dividend yield and get a tiny bump in price. Often the best case scenario involves a much bigger bump in price.
Unfortunately, the worst case scenario still includes a material drop in share prices.
That makes the overall risk/reward profile materially less attractive.
Stock Table
We will close out the rest of the article with the tables and charts we provide for readers to help them track the sector for both common shares and preferred shares.
We're including a quick table for the common shares that will be shown in our tables:
Type of REIT or BDC | ||||
Residential Agency | Residential Hybrid | Residential Originator and Servicer | Commercial | BDC |
If you're looking for a stock that I haven't mentioned yet, you'll still find it in the charts below. The charts contain comparisons based on price-to-book value, dividend yields, and earnings yield. You won't find these tables anywhere else.
For mortgage REITs, please look at the charts for AGNC, NLY, DX, ORC, ARR, CHMI, TWO, IVR, EARN, CIM, EFC, NYMT, MFA, MITT, AAIC, PMT, RITM, BXMT, GPMT, WMC, and RC.
For BDCs, please look at the charts for MAIN, CSWC, ARCC, TSLX, TPVG, OCSL, GAIN, GBDC, SLRC, OBDC, PFLT, TCPC, FSK, PSEC, and MFIC.
This series is the easiest place to find charts providing up-to-date comparisons across the sector.
Notes on Chart Sorting
Within each type of security, the sorting is usually based on risk ratings. However, it is quite common to have a few shares that are tied. When the shares are tied for risk rating, the sorting becomes arbitrary. There may occasionally be errors where a share's position is not updated quickly, following a change in the risk rating. That can happen because the charts come from a separate system. When I update the system we use for members, it doesn't change the order in the charts.
When I say "within each type of security", I'm referencing categories such as "agency mortgage REITs." The "hybrid mortgage REITs" are all listed after the "agency mortgage REITs." However, that does not mean RC (lowest hybrid) has a higher risk rating than the highest agency mortgage REIT. Each batch is presented by themselves.
PMT and RITM are tied for risk rating.
Finally, there's an outlier. We don't cover EARN. However, it was frequently requested for this series. Consequently, I added it to the charts. The important part here is that EARN was never assigned a risk rating. Since it has no assigned risk rating, it got lumped in at the top. However, I do not believe EARN would actually get a higher risk rating than IVR.
This could probably be written better. If someone feels inclined to take it upon themselves to write a section that is objectively better at communicating these points, I would be interested in using it. I'm grateful to have the best readers on Seeking Alpha. I attribute this to self-selection bias. I include enough things to offend the dumb people that I'm left with the best readers.
Residential Mortgage REIT Charts
Note: The chart for our public articles uses the book value per share from the quarter indicated in the chart. We use the current estimated (proprietary estimates) book value per share to determine our targets and trading decisions. It is available in our service, but those estimates are not included in the charts below. PMT and NYMT are not showing an earnings yield metric as neither REIT provides a quarterly "Core EPS" metric. Presently, a few other REITs also have no consensus estimate.
Second Note: Due to the way historical amortized cost and hedging are factored into the earnings metrics, it is possible for two mortgage REITs with similar portfolios to post materially different metrics for earnings. I would be very cautious about putting much emphasis on the consensus analyst estimate (which is used to determine the earnings yield). In particular, throughout late 2022 the earnings metric became less comparable for many REITs.
 The REIT Forum | 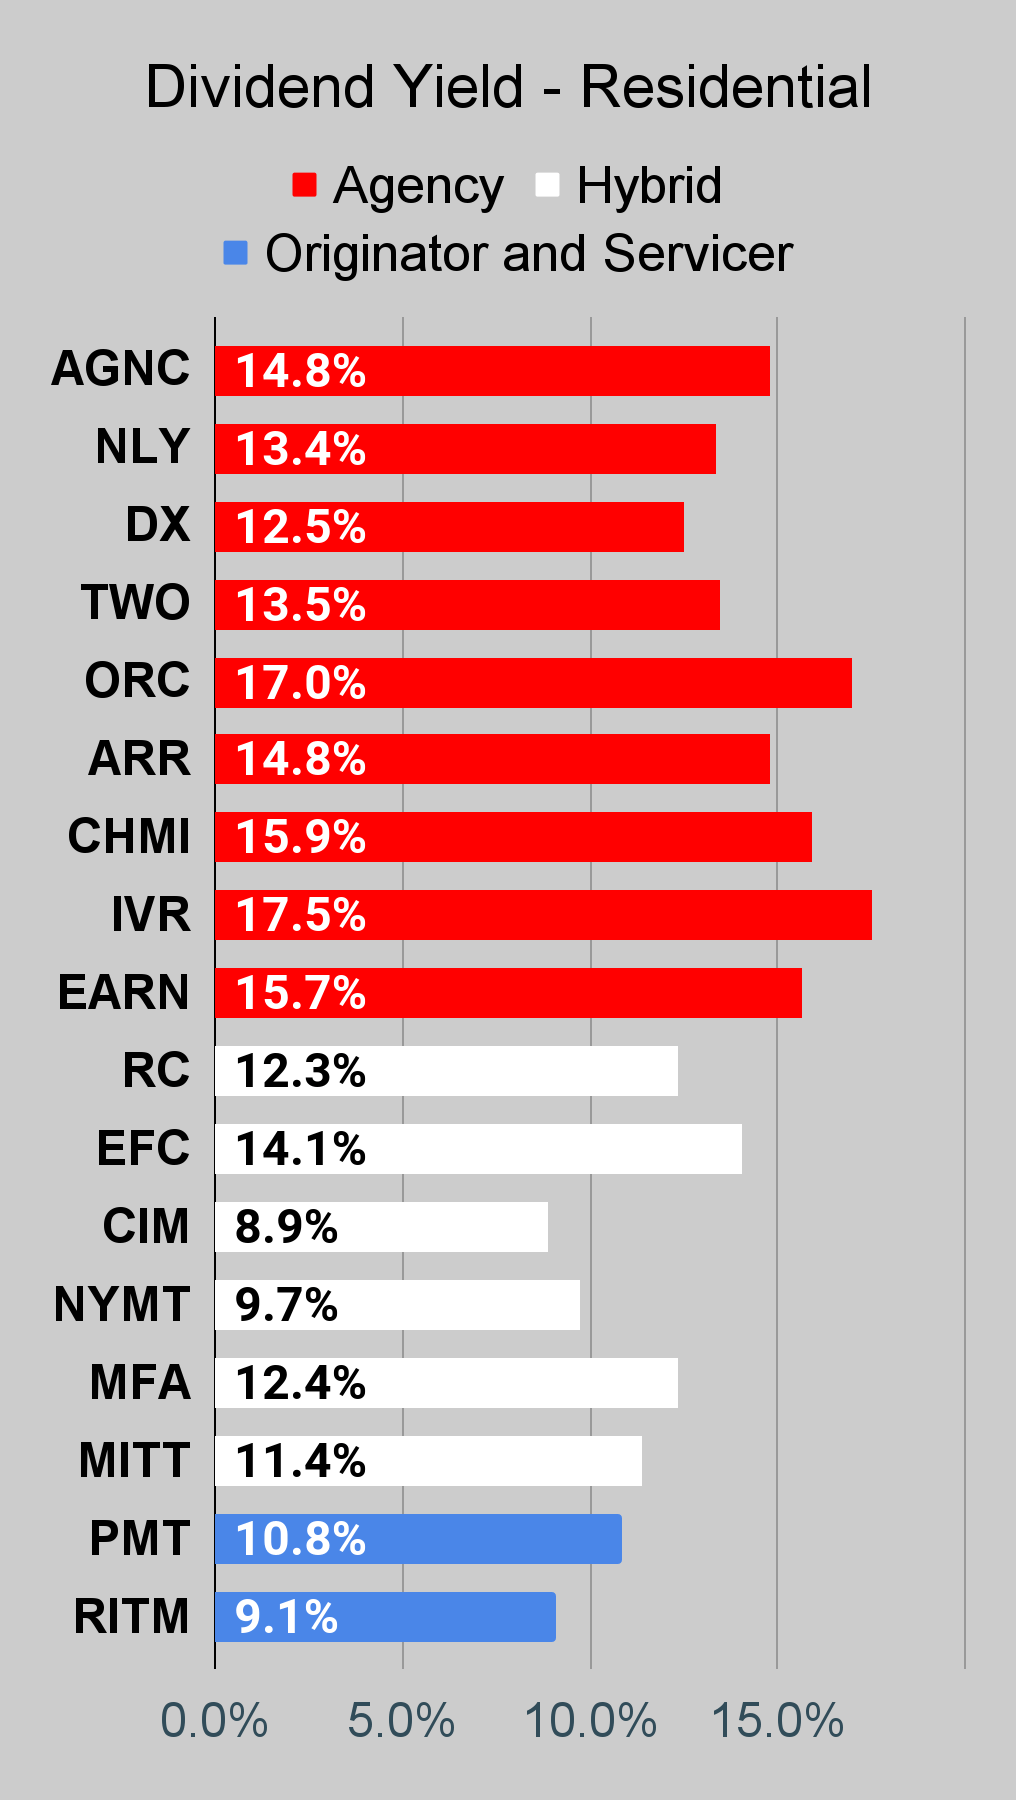 The REIT Forum | 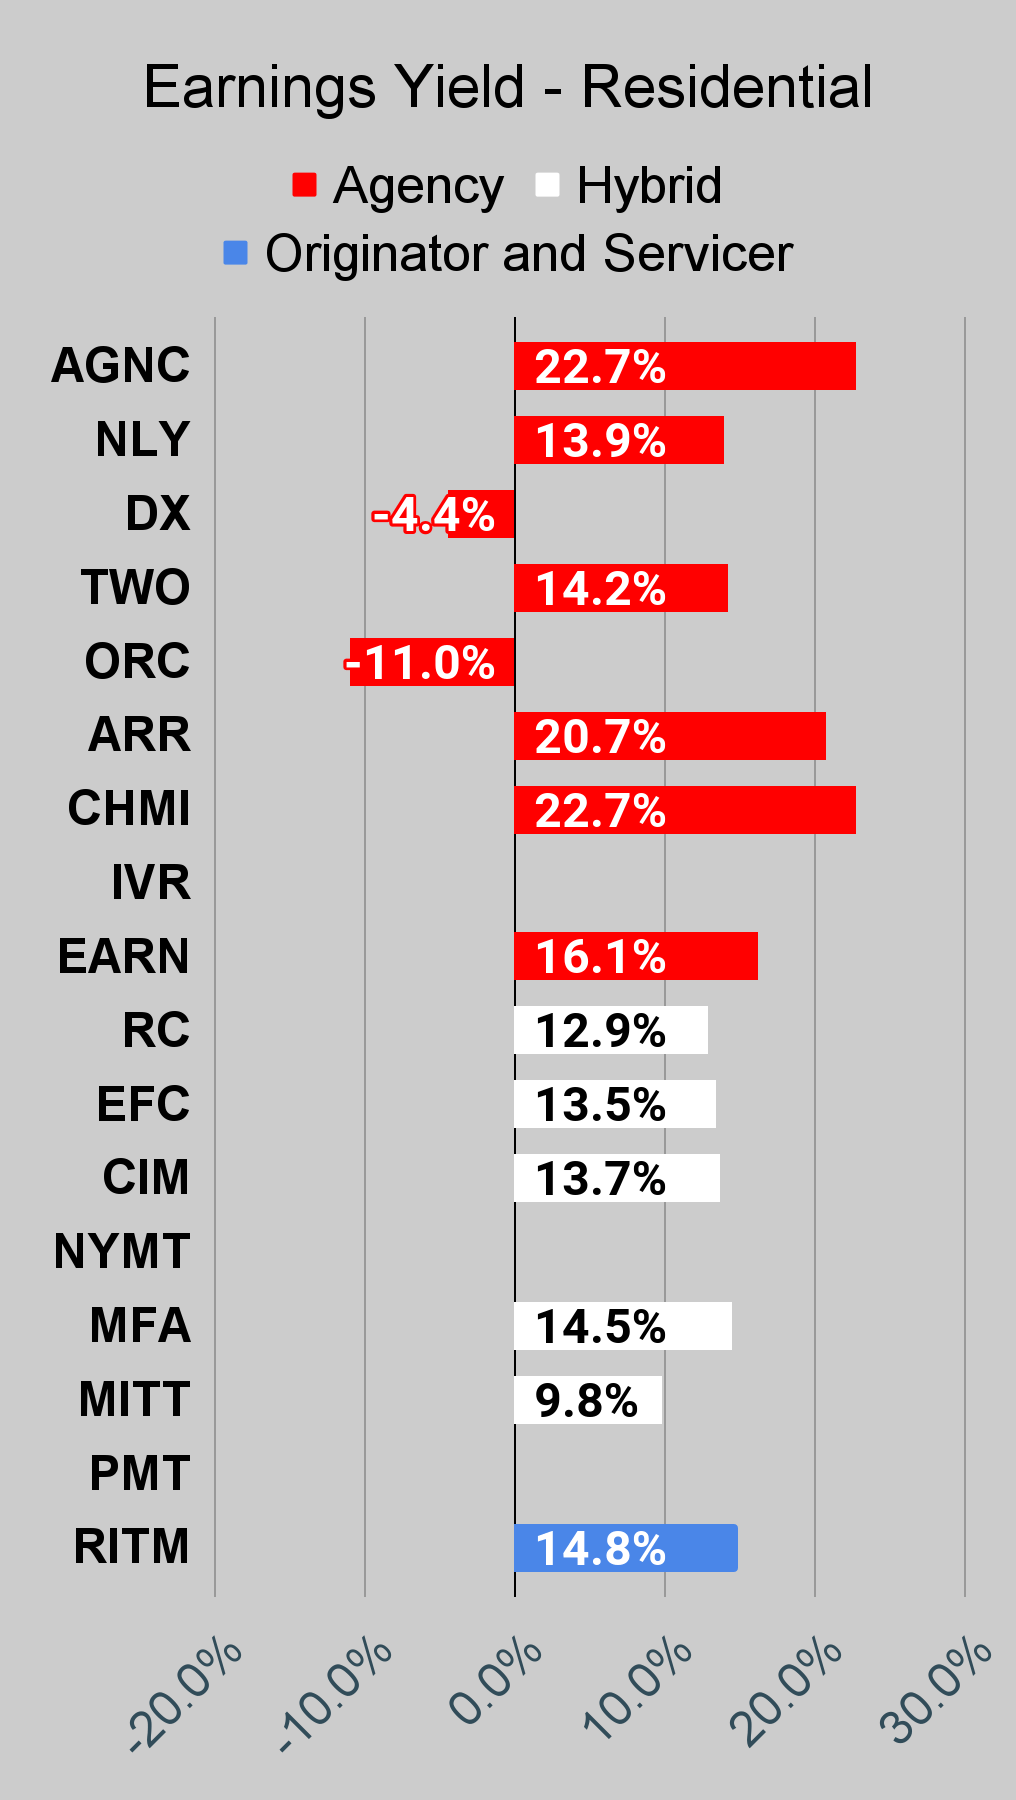 The REIT Forum |
Commercial Mortgage REIT Charts
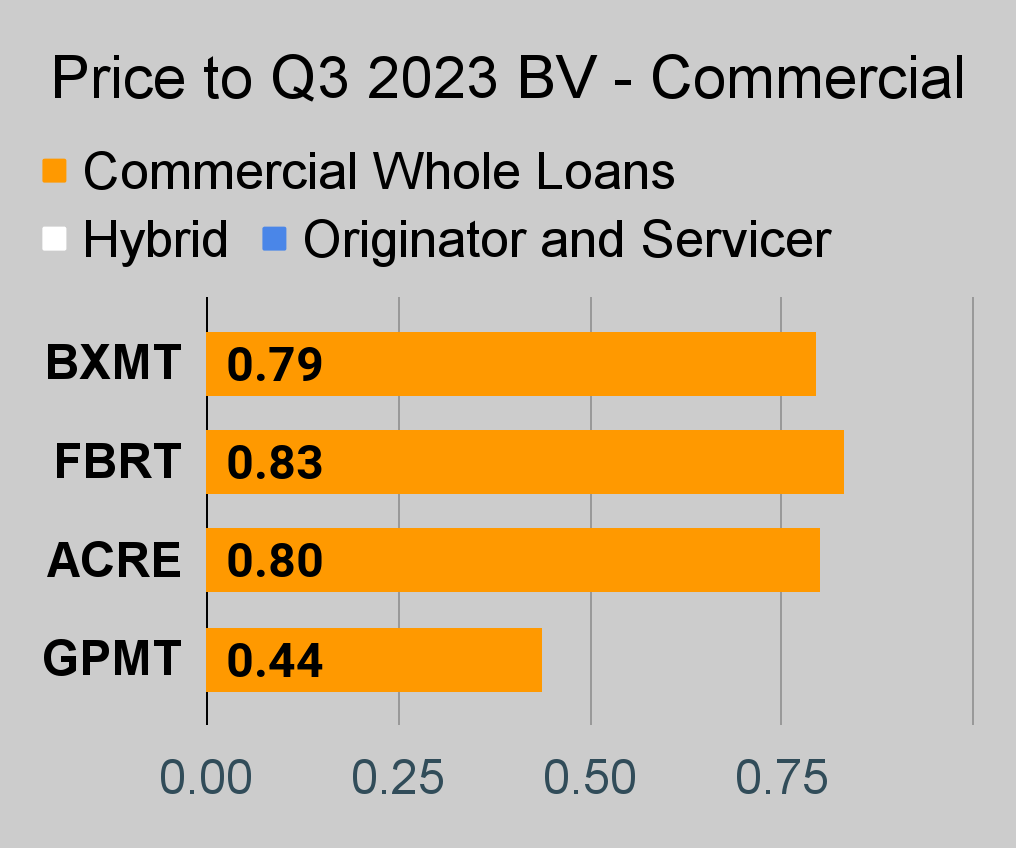 The REIT Forum | 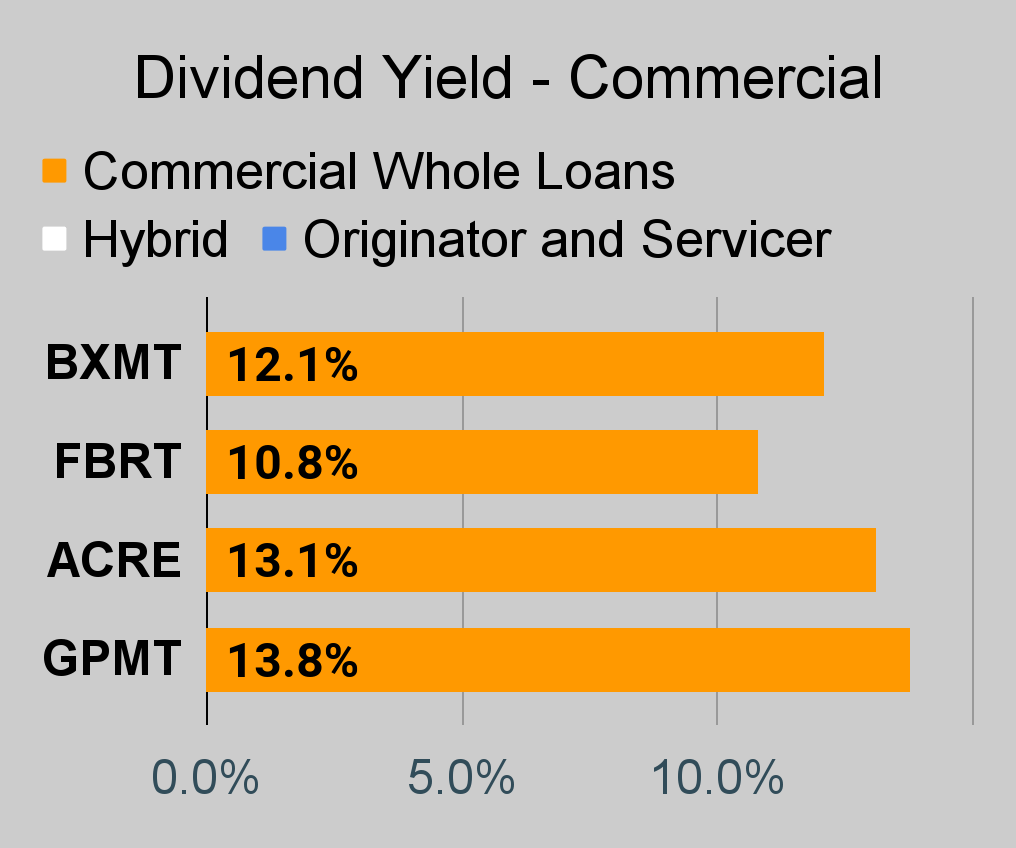 The REIT Forum | 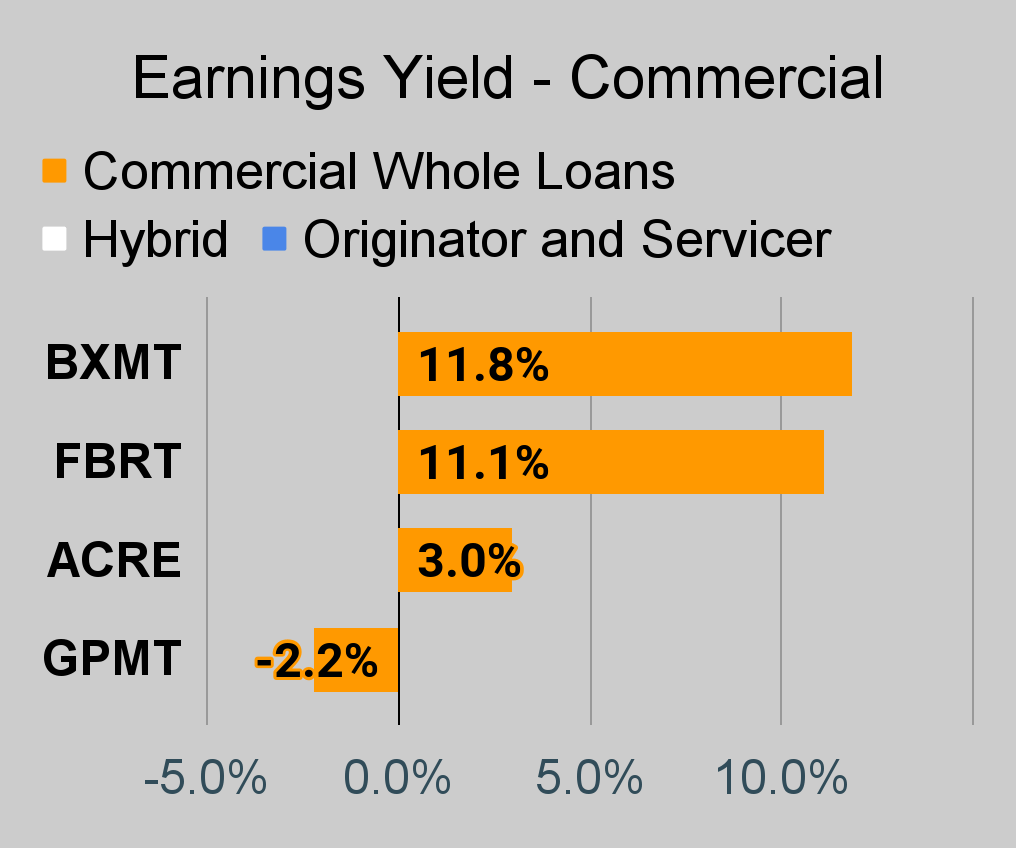 The REIT Forum |
BDC Charts
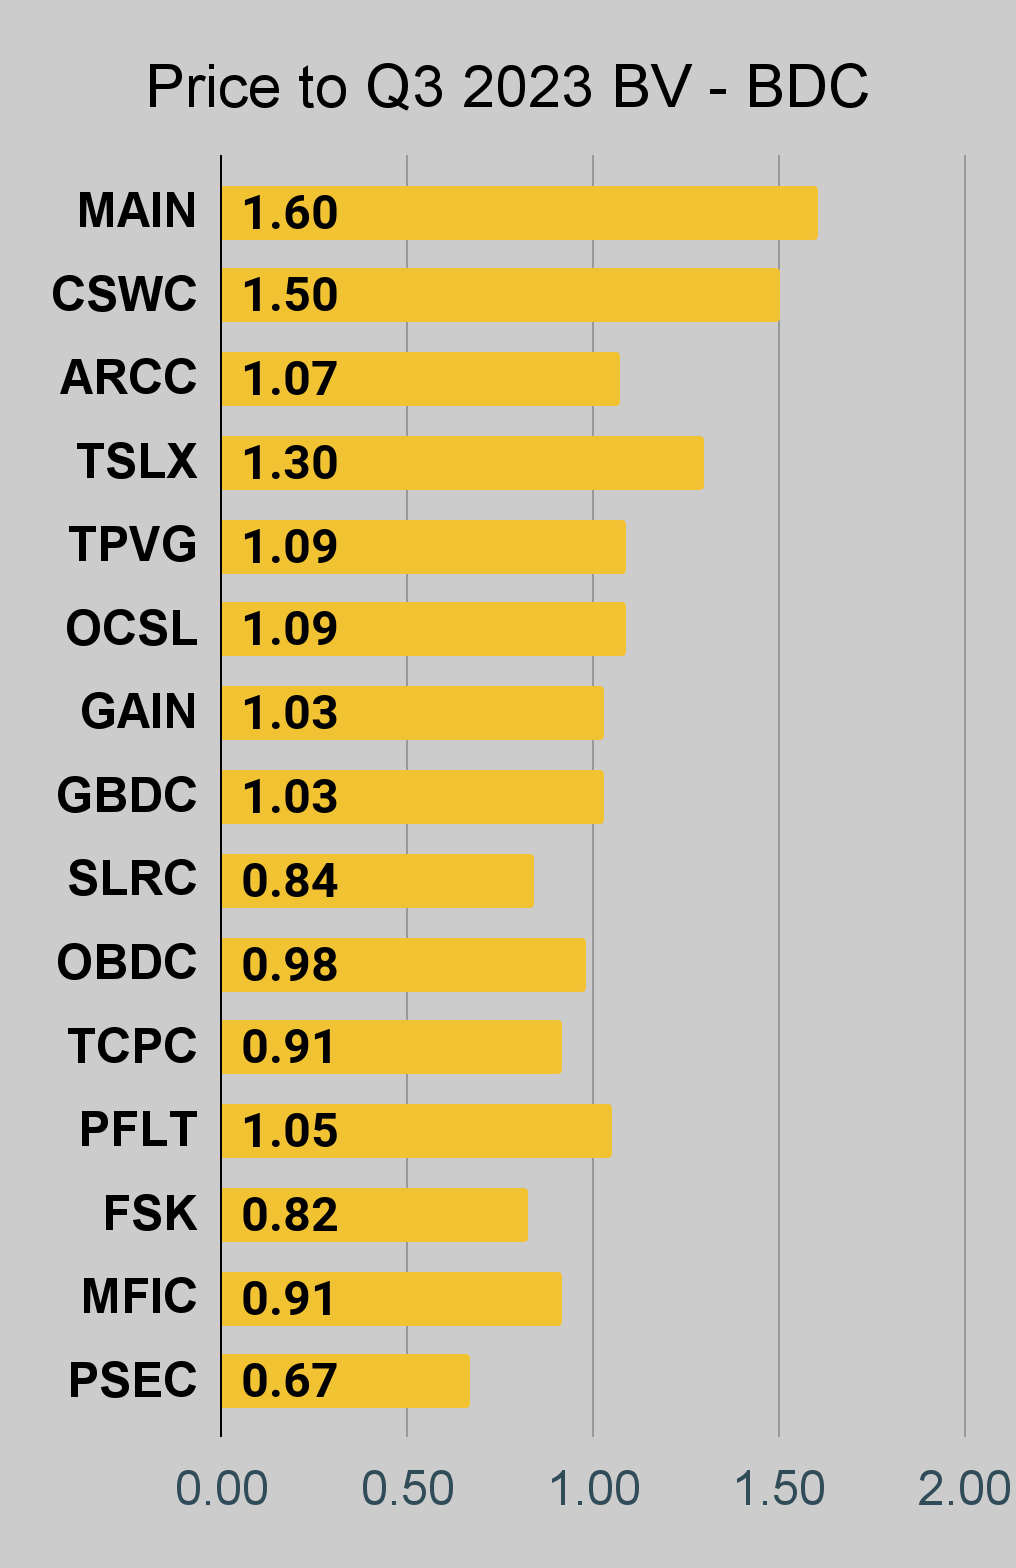 The REIT Forum | 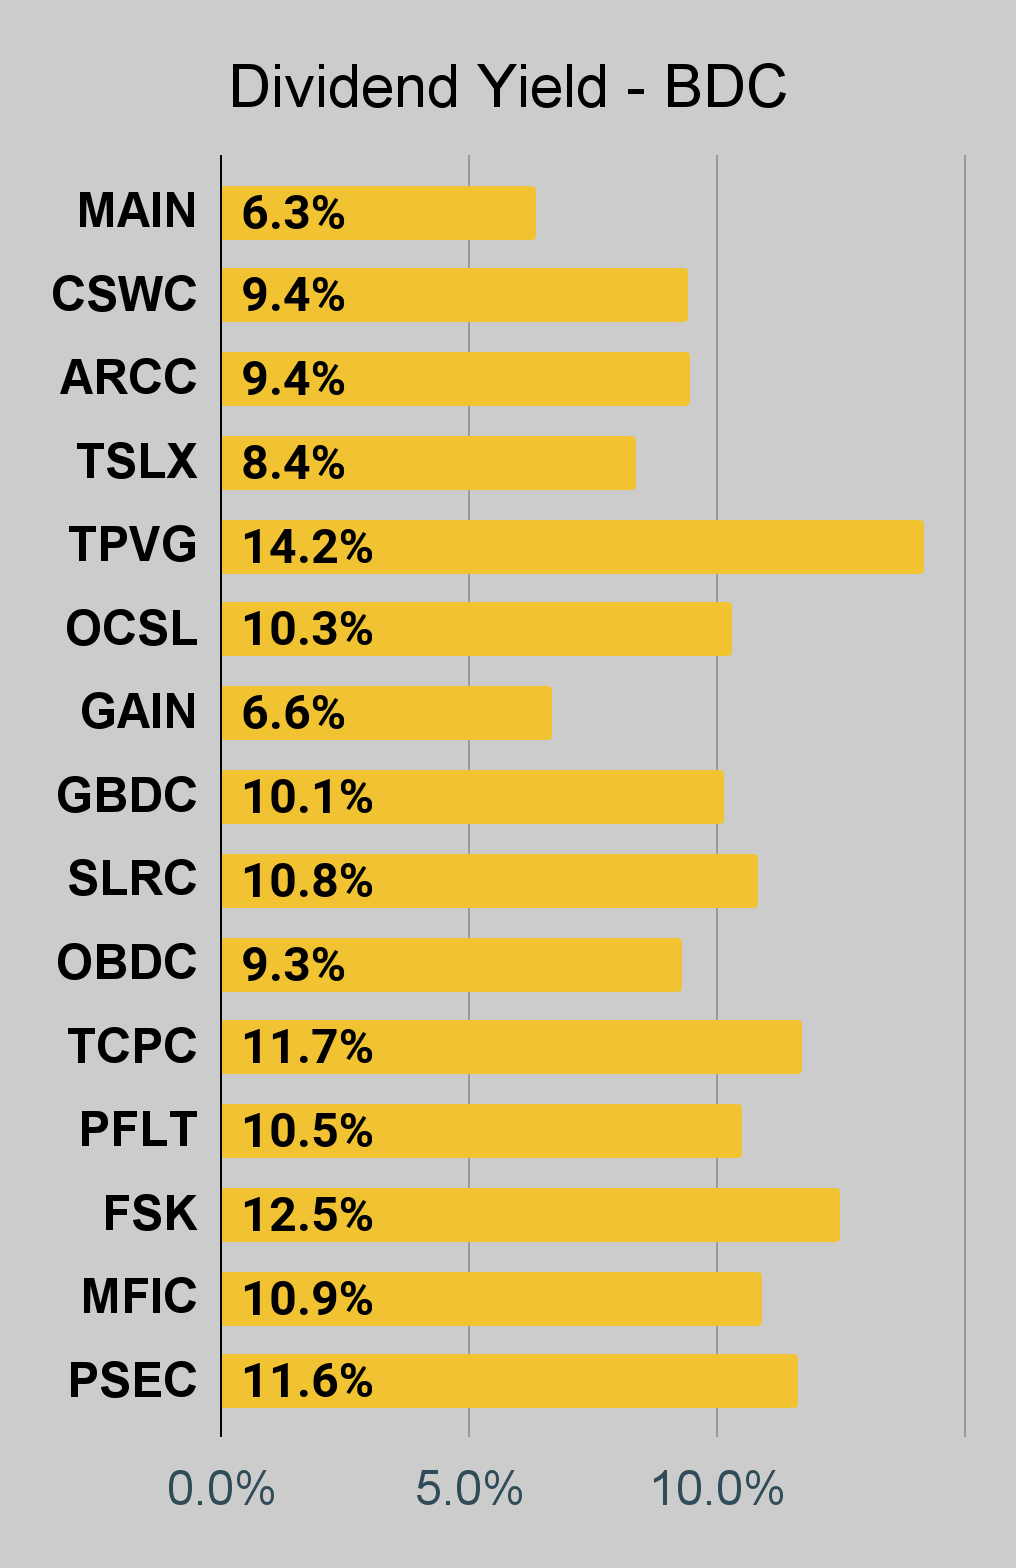 The REIT Forum | 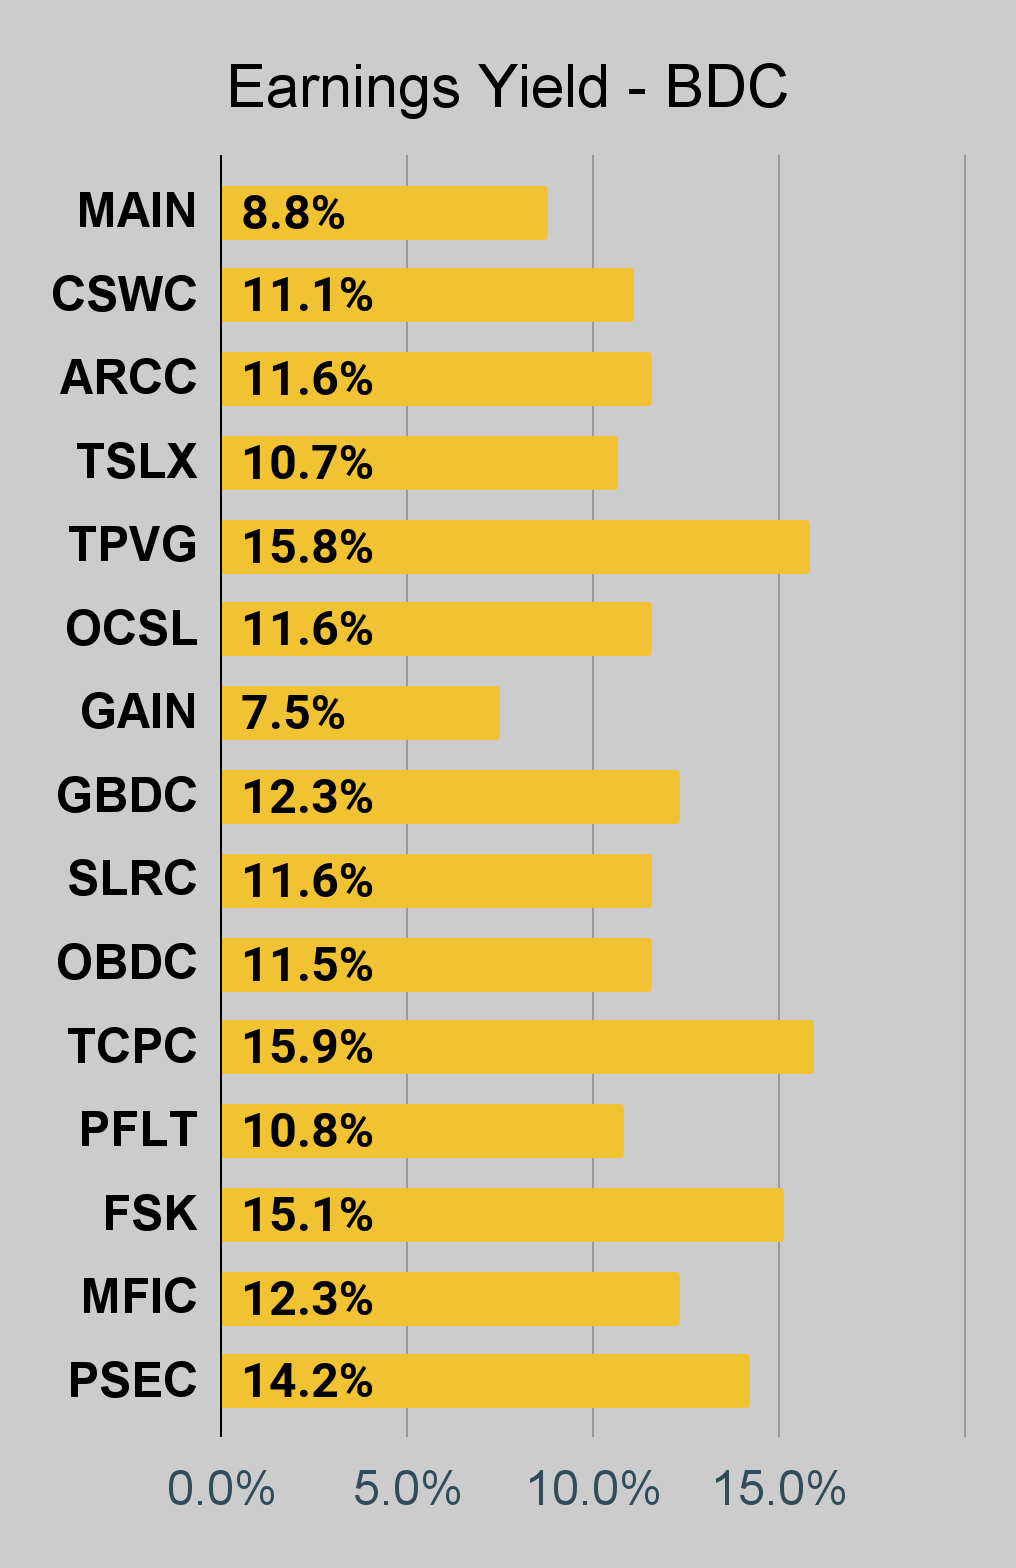 The REIT Forum |
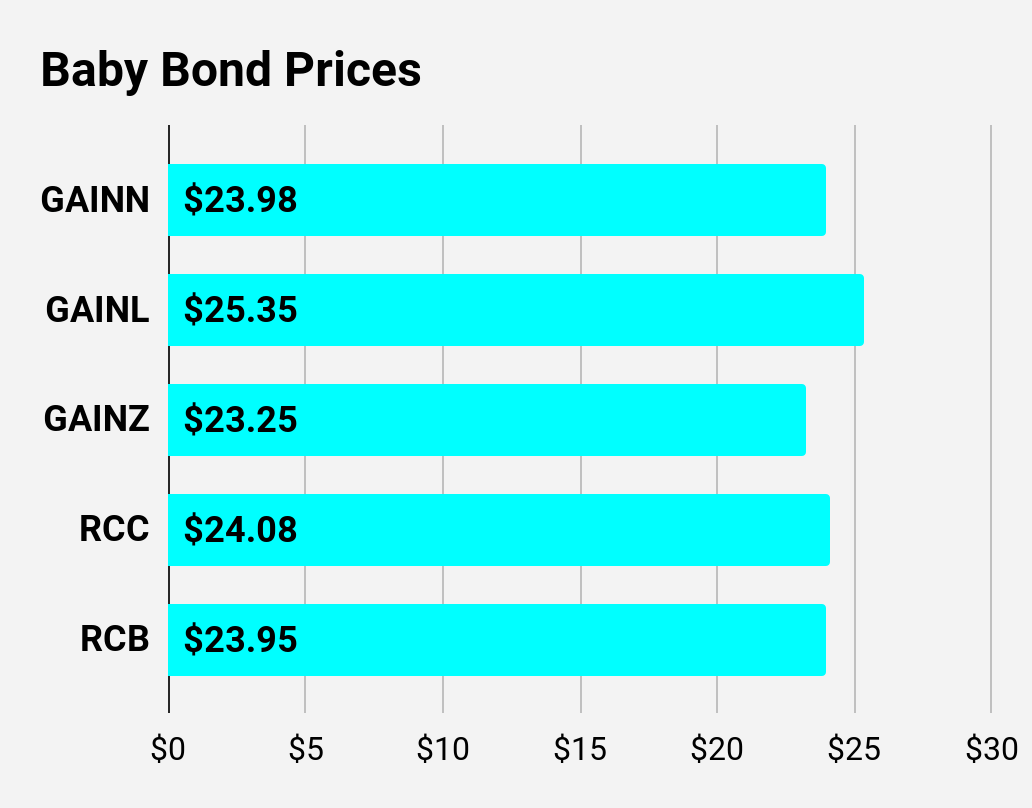
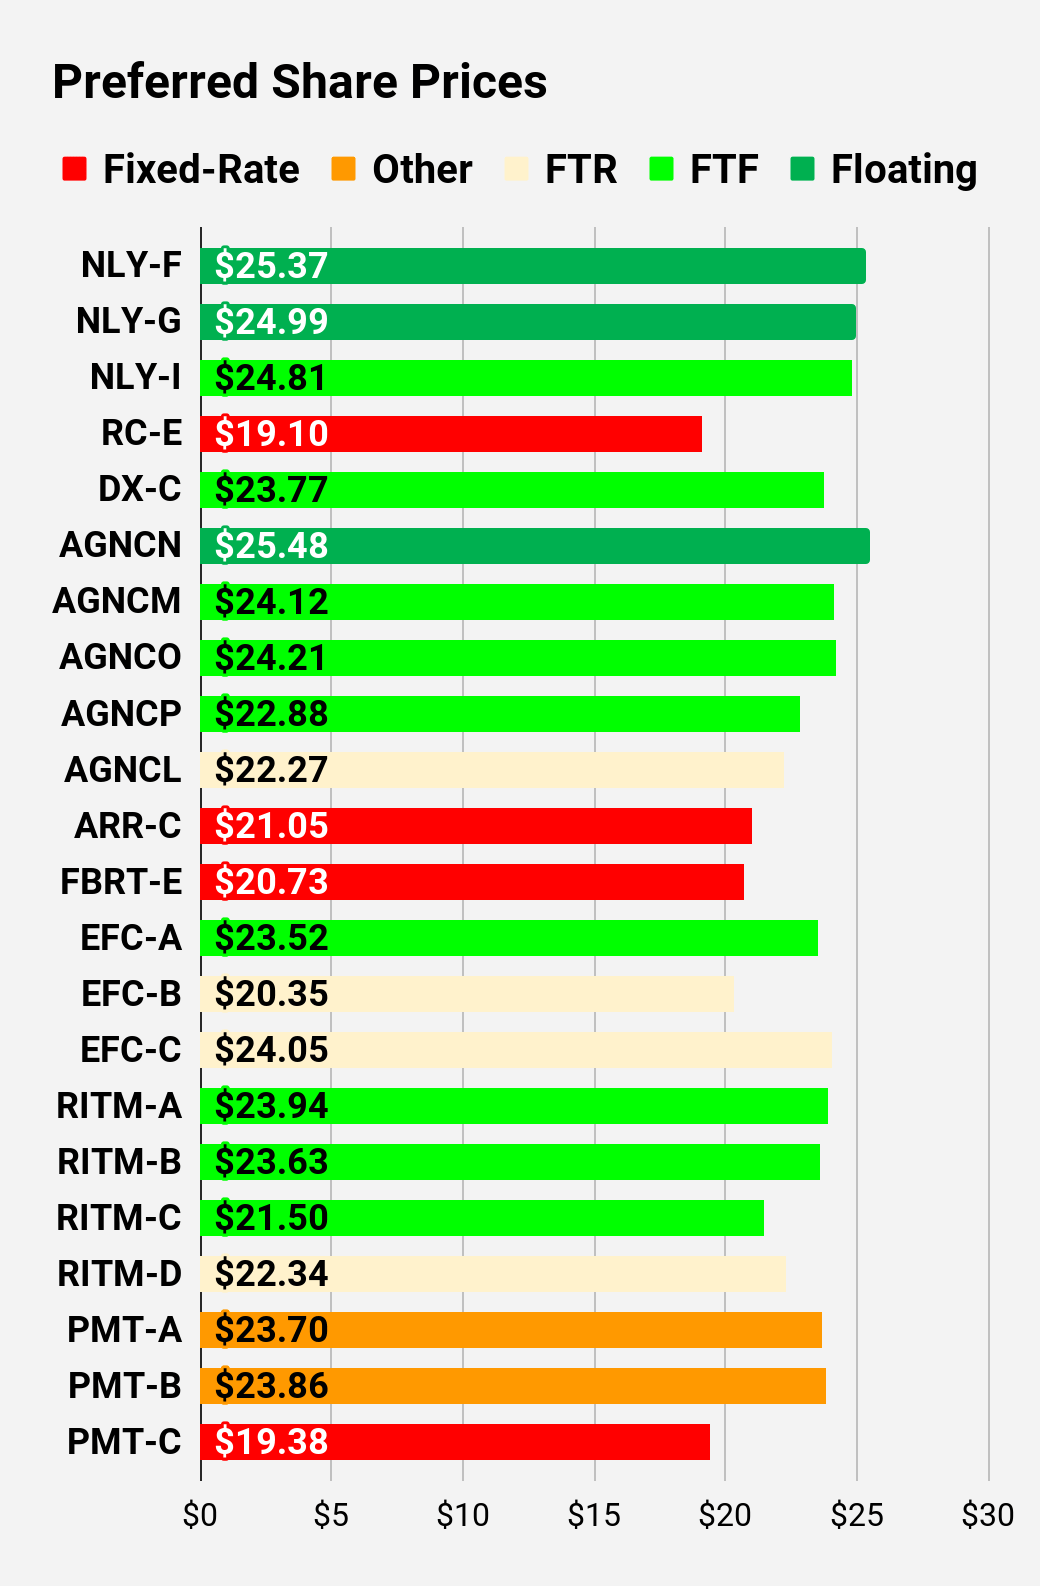
Preferred Share and Baby Bond Charts
I changed the coloring a bit. We needed to adjust to include that the first fixed-to-floating shares have transitioned over to floating rates. When a share is already floating, the stripped yield may be different from the "Floating Yield on Price" due to changes in interest rates. For instance, NLY-F already has a floating rate. However, the rate is only reset once per 3 months. The stripped yield is calculated using the upcoming projected dividend payment and the "Floating Yield on Price" is based on where the dividend would be if the rate reset today. In my opinion, for these shares, the "Floating Yield on Price" is clearly the more important metric.
 The REIT Forum | 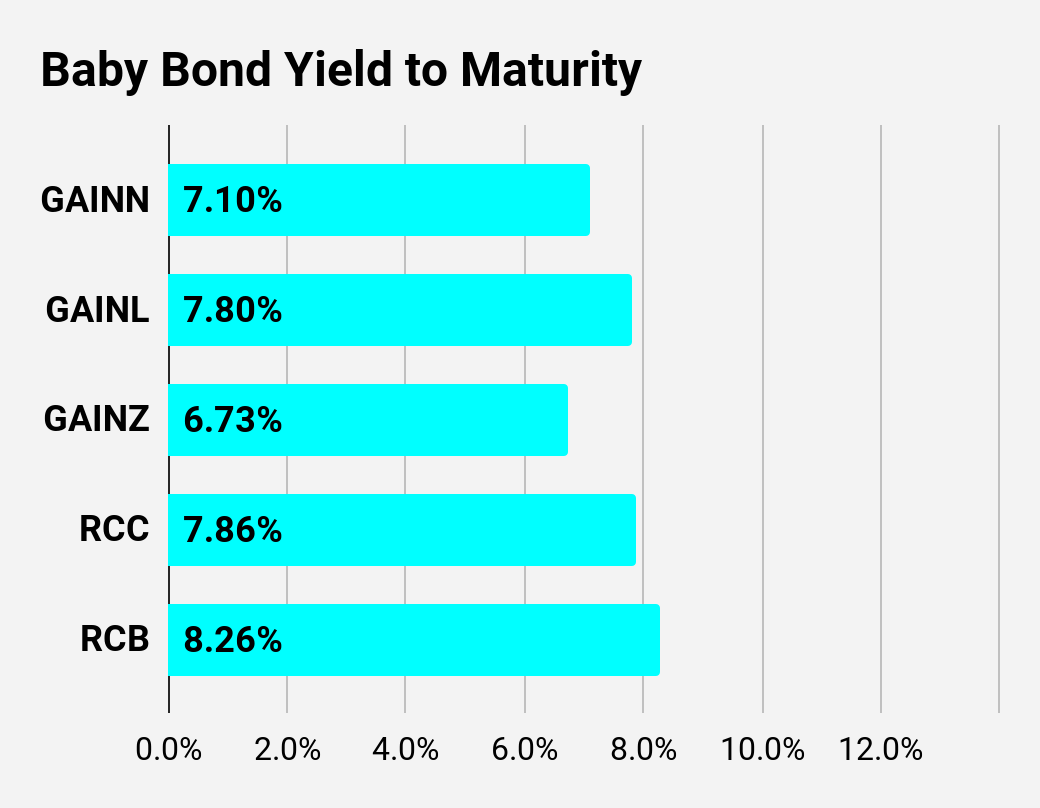 The REIT Forum |  The REIT Forum |
 The REIT Forum | 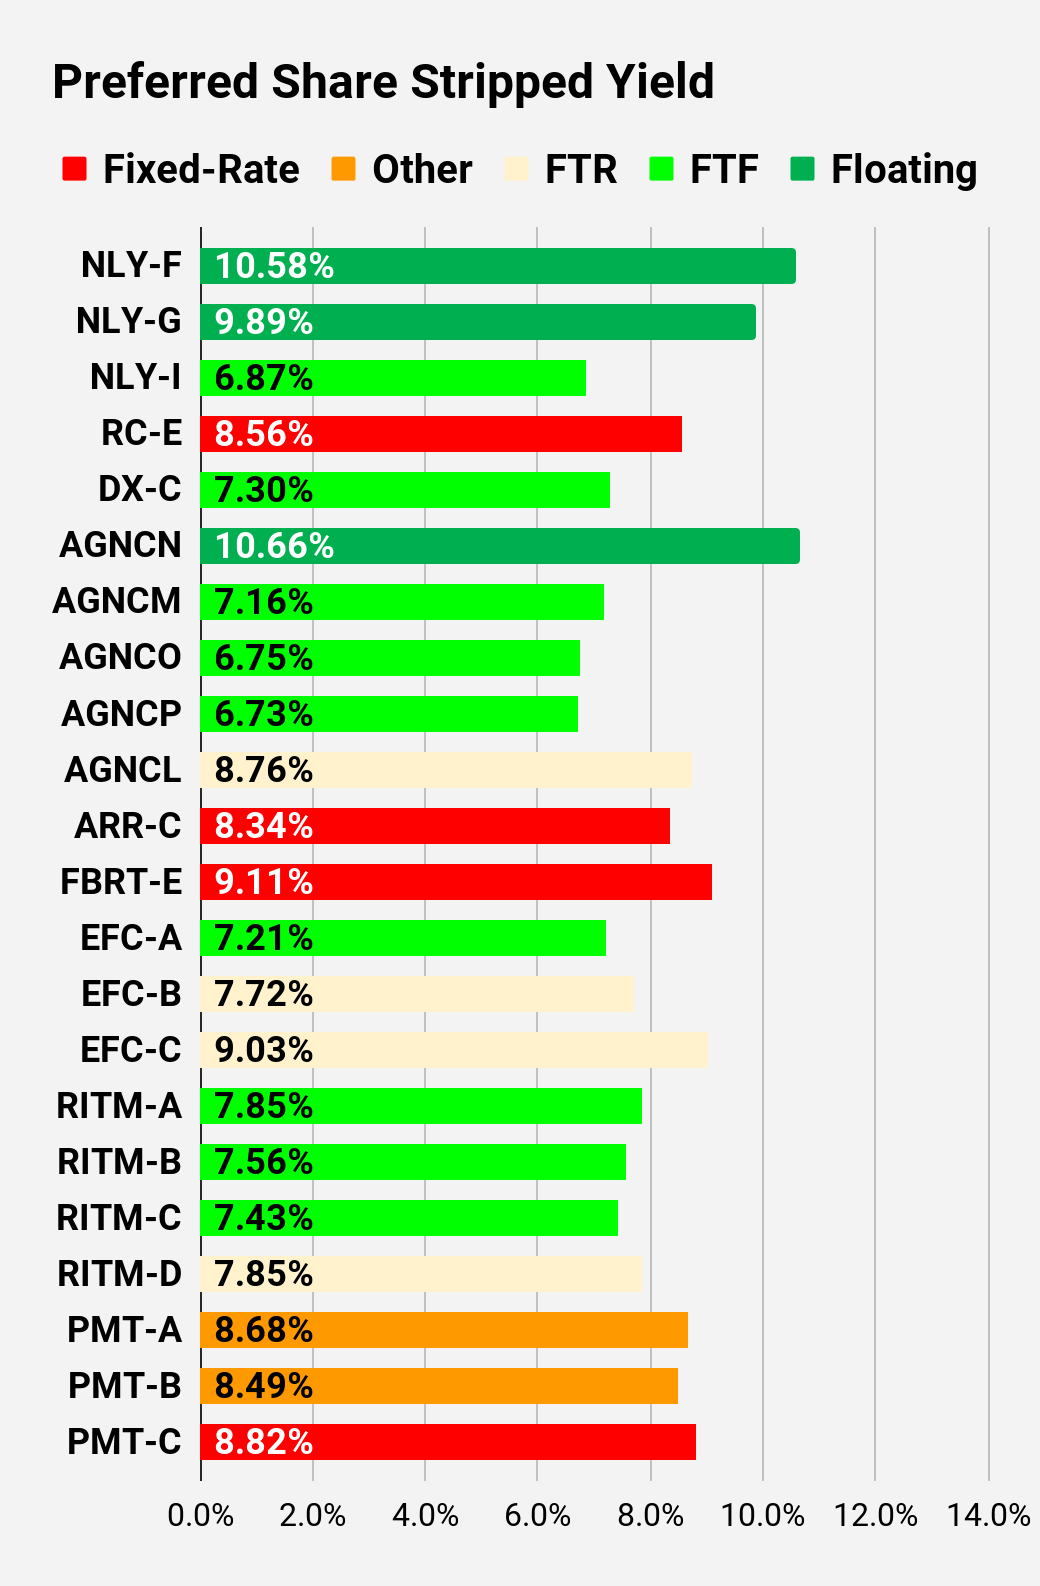 The REIT Forum | 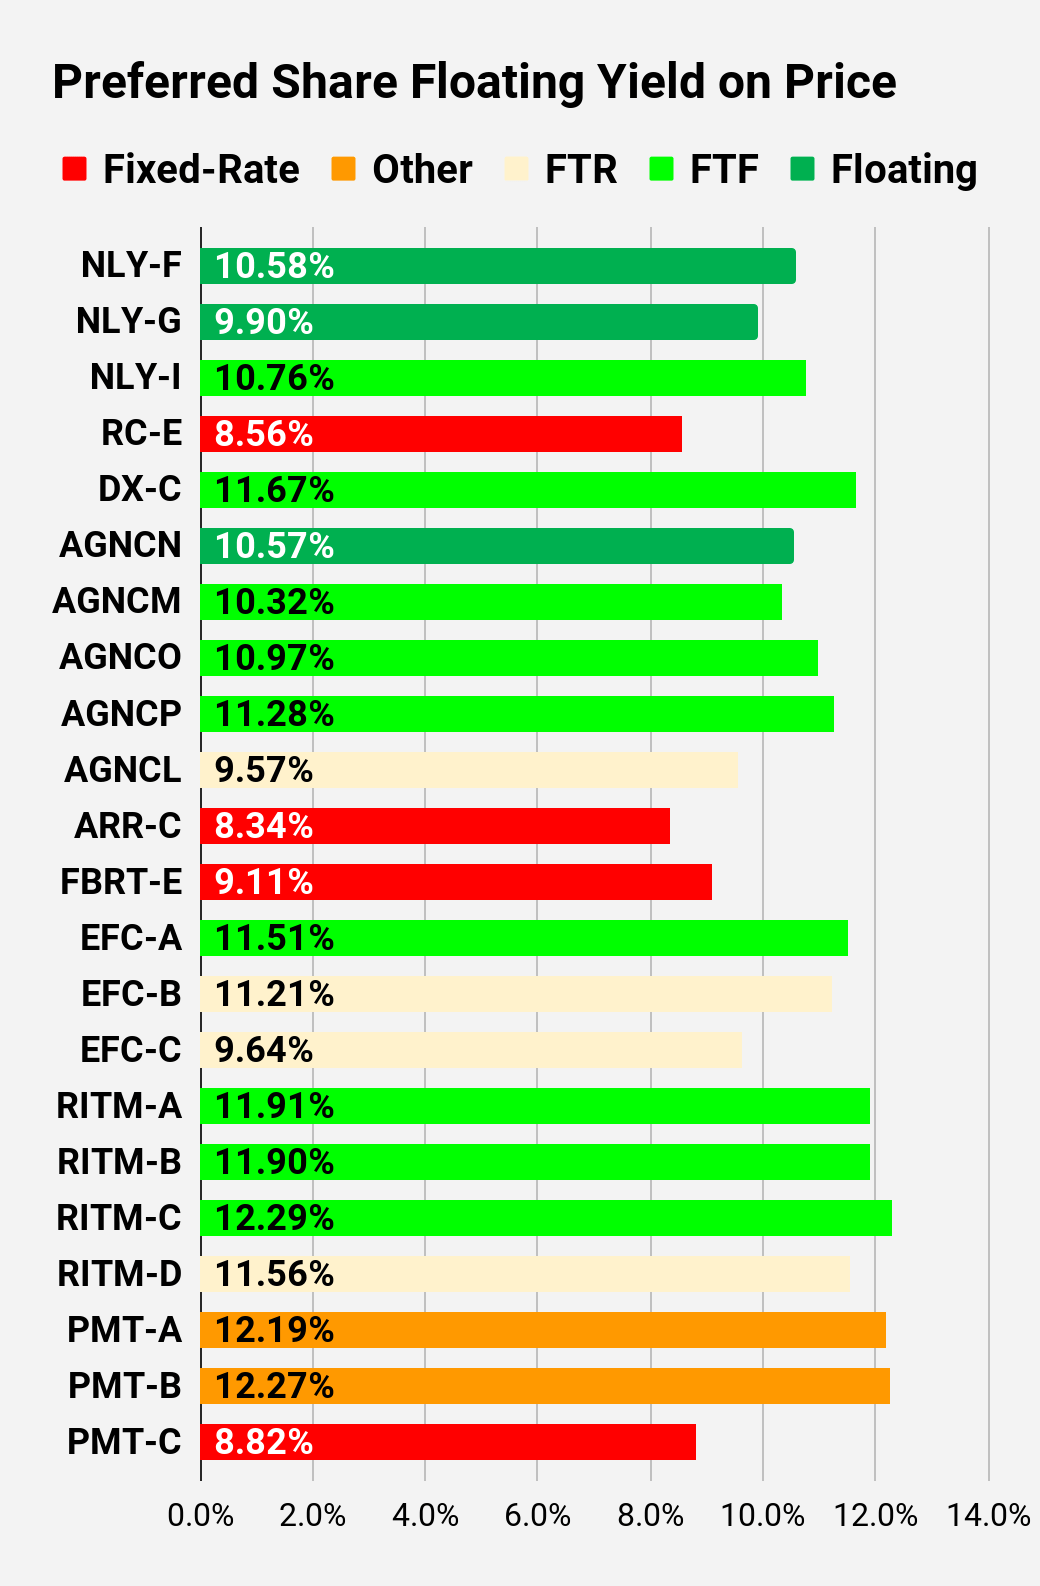 The REIT Forum |
 The REIT Forum |  The REIT Forum | 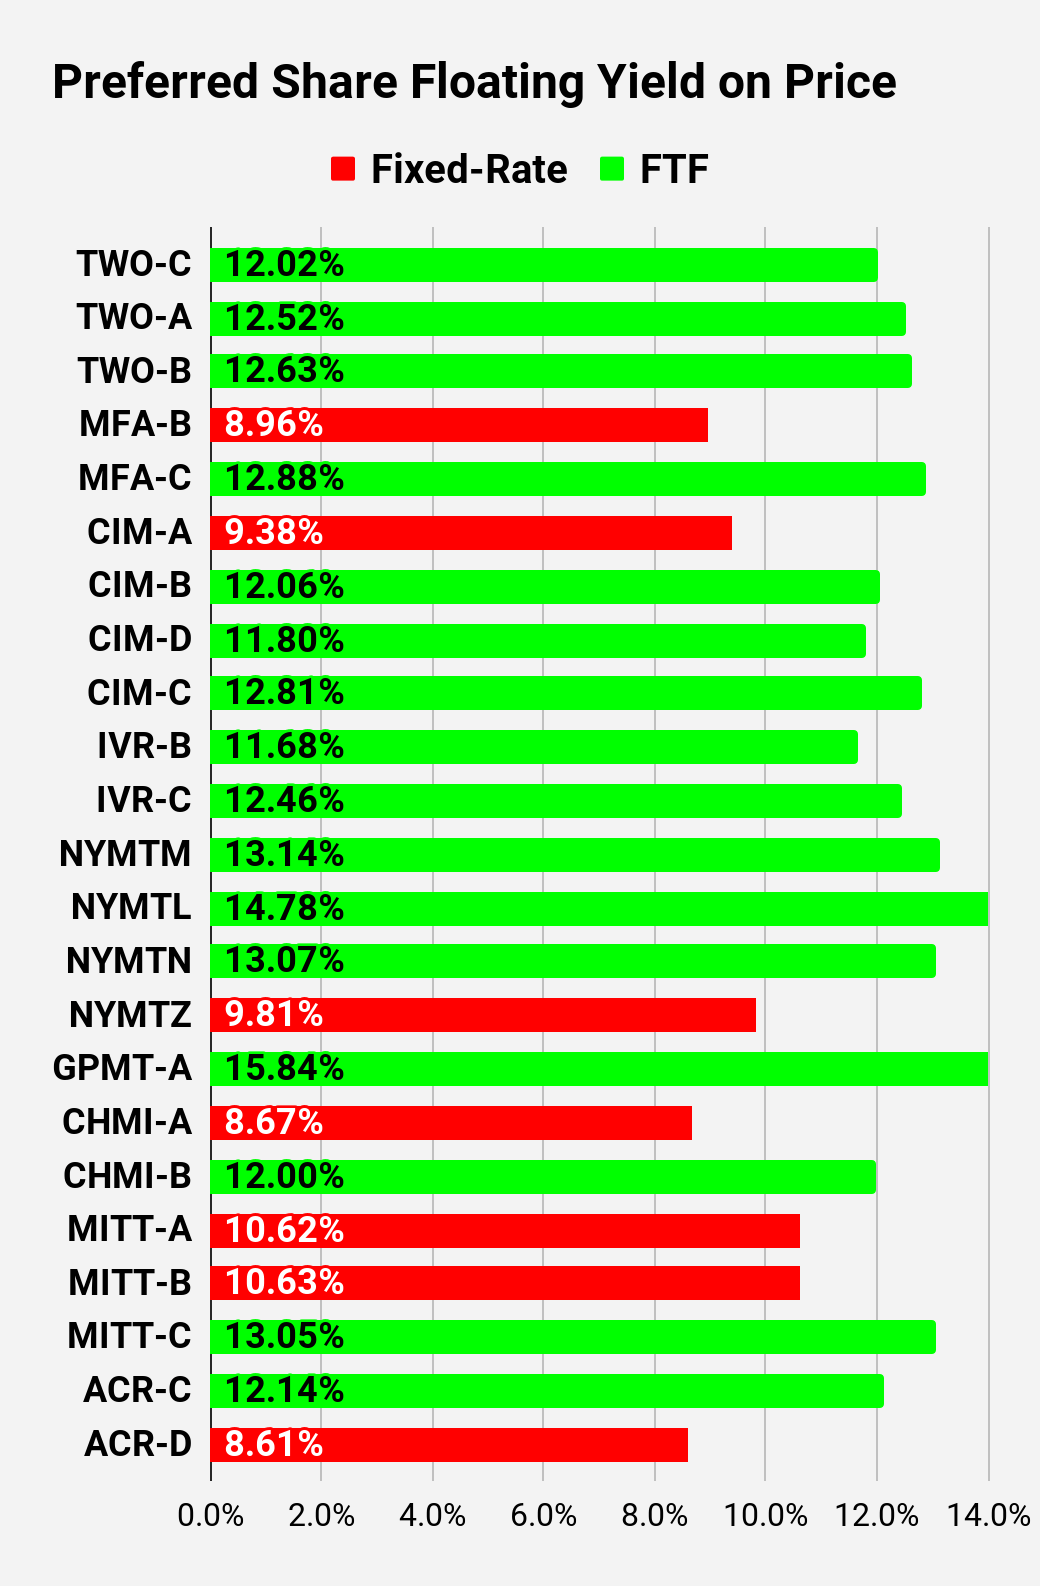 The REIT Forum |
Note: Shares that are classified as "Other" are not necessarily the same. Within The REIT Forum, we provide further distinction. For the purpose of these charts, I lumped all of them together as "Other." Now there are only two left, PMT-A and PMT-B. Those both have the same issue. Management claims the shares will be fixed-rate, even though the prospectus says they should be fixed-to-floating.
Strategy
Our goal is to maximize total returns. We achieve those most effectively by including "trading" strategies. We regularly trade positions in the mortgage REIT common shares and BDCs because:
- Prices are inefficient.
- Long-term, share prices generally revolve around book value.
- Short-term, price-to-book ratios can deviate materially.
- Book value isn't the only step in analysis, but it is the cornerstone.
We also allocate to preferred shares and equity REITs. We encourage buy-and-hold investors to consider using more preferred shares and equity REITs.
New membership prices will be increased soon.
We're running a promotion before the price hike. You can get 10% off your first year, and you'll get today's rate locked in for renewals.
That's a much better deal than waiting just to pay full price for the first year and lock in a higher rate for renewals.
