seksan Mongkhonkhamsao/Moment via Getty Images
Investment Thesis
In my view, Coterra Energy (CTRA) has a hold rating. From 2014 until now, Coterra Energy's stock price has not had a good performance due to lower oil and gas prices and changes in the company's investment policy; the price per share has tracked the oil and natural gas prices. It is worth mentioning that the company managed to increase its production by 353% in the previously mentioned period and had positive ROEs between 2019 and 2023. Conversely, the market does not consider these figures appealing enough to reward the company with a higher market capitalization.
Production
The data from this and the upcoming sections came mainly from Coterra Energy's financial statements. Any other sources will be cited and linked to in the article.
I want to introduce this analysis by visualizing Coterra Energy's production, with the scope to see its evolution. During 2009-2023e ((2023e: Coterra Energy's estimation for 2023)), Coterra Energy's output measured in barrels of oil equivalent (BOE) increased by more than 2239%, and its annual compounded growth rate was 25.25%.
Image was created by the author with data from Coterra Energy's filings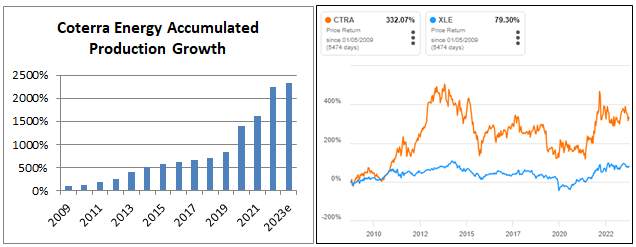
This growth has permitted Coterra Energy to outperform the Energy Select Sector SPDR Fund (XLE) ETF by more than 250% during 2009-2023e. However, from 2014, Coterra Energy's stock price started a progressive decline, which ended in 2021, then gained momentum in 2021 and 2022, regaining part of the market value obtained during 2014-2015.
In 2021, Cobot Oil and Energy merged with Cimarex to form Coterra Energy. An interesting point is that the total production growth between 2020 and 2023 was 167%, and from December 2020 to December 2023, the Coterra stock price grew 57%. So, why is there such a difference between production and returns? Even in a more conservative period, 2015-2023, the production increased by 300%, while Coterra Energy's price per share did not increase.
This article will go through Coterra Energy's financial statement to understand whether or not there is a reason for the gap between production growth and Coterra Energy's price per-share growth.
Revenues and Investment
It is convenient to make the data speak for itself and see the evolution of natural gas and oil operating revenues between 2008 and September 2023. For the natural gas revenues, the core business sector, there is an exponential increase, reaching a total growth of 906% during 2008-2022, and then a decline of minus 34% during 2022-2023e. It is worth mentioning two years, 2014 and 2021, when there was a substantial decline and increase in the output level, respectively. Due to the decline in energy prices, natural gas operating revenues decreased during 2015-2016. Meanwhile, in 2021, Cobot Oil and Gas and Cimarex Energy completed a merger to form Coterra Energy, allowing a considerable jump in natural gas revenues.
Image was created by the author with data from Coterra Energy's filings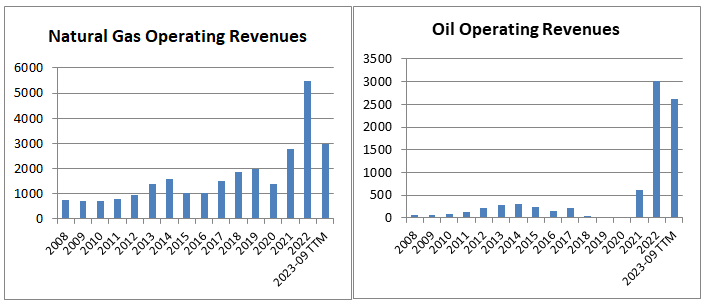
The oil operating revenues between 2008 and 2014 increased consistently; as a percentage of the total revenues, this commodity represented 19% in 2014; subsequently, there was no oil production in 2019 and 2020. I would like to point out that between 2008 and 2018, the oil business sector was not the company's main activity. But in 2021, the merger added to Cobot the Cimarex's oil operations, leading to an increase in the oil revenues from 2021 to 2023.
Image was created by the author with data from Coterra Energy's filings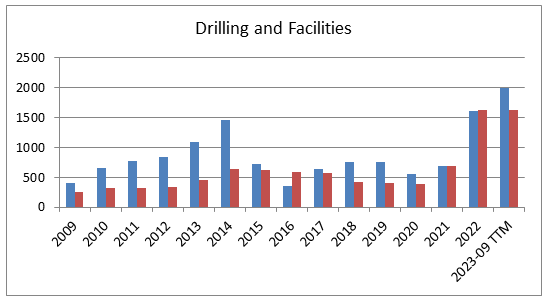
Another element to analyze is the Drilling and Facilities, which reflects Conterra Energy's investment in drilling and infrastructure. The reason to analyze this item is to see Conterra Energy's self-growth through investment. The interval 2009-2014 shows a period of high investment in which drilling and facilities were approximately two times the DD&A, which allowed Coterra Energy to increase its production by five; note that in the year 2014, Coterra Energy achieved its maximum price per share, a year with high oil prices. In the second period, 2015-2023, the gap between Drilling and Facilities and DD&A decreased, implicating a lower capacity to grow.
The company has not manifested a relevant plan to change its investment approach in the upcoming years. So, it is reasonable to think that the ratio between Drilling Facilities and DD&A will be similar to the average obtained during 2015-2023, leading to a yearly production increase in percentage term equivalent to the observed during 2015-2019, a period without any relevant acquisition.
A significant event to research with the scope to have a clue of the possible future direction for the company is the merger that occurred in 2021 and the goals set by Coterra Energy to achieve during 2022-24 with that operation.
Merger
With the merger, Cobot Oil and Energy added the NGL and Oil business and increased the output of its natural gas operations; the locations of these new operations are in the Permian Basin and Anadarko Basin. Before 2021, Coterra Energy ((formerly Cobot Oil and Energy)) operated only in the Appalachian Basin, Pennsylvania.
Cobot Oil and Energy set the following financial reasons for the merger:
- An accumulated free cash flow of $4.7 billion between 2022 and 2024, assuming that the oil and natural gas prices will be $55 and $2.75, respectively.
- Generate a fixed dividend of $0.5 per share and a second dividend to achieve at least 50% of the free cash flow.
- Have a Debt to EBITDA ratio lower than one.
Image was created by the author with data from Coterra Energy Press Release and Bank of St.Louis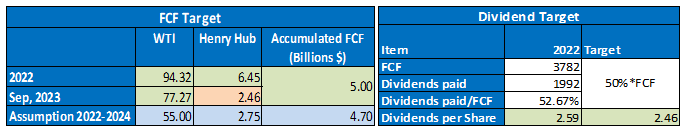
From 2022 to September 2023, the Accumulated free cash flow was $5 billion, achieving the $4.7 billion milestone. Here, I would like to point out that the natural gas and oil prices from 2022 to September 2023, on average, exceeded the expected prices for 2022-2024.
The company paid a $2.59 dividend per share in 2022, while for that year, the target value was $2.46 per share, indicating that Coterra Energy accomplished the second milestone, another positive point.
Source: seekingalpha.com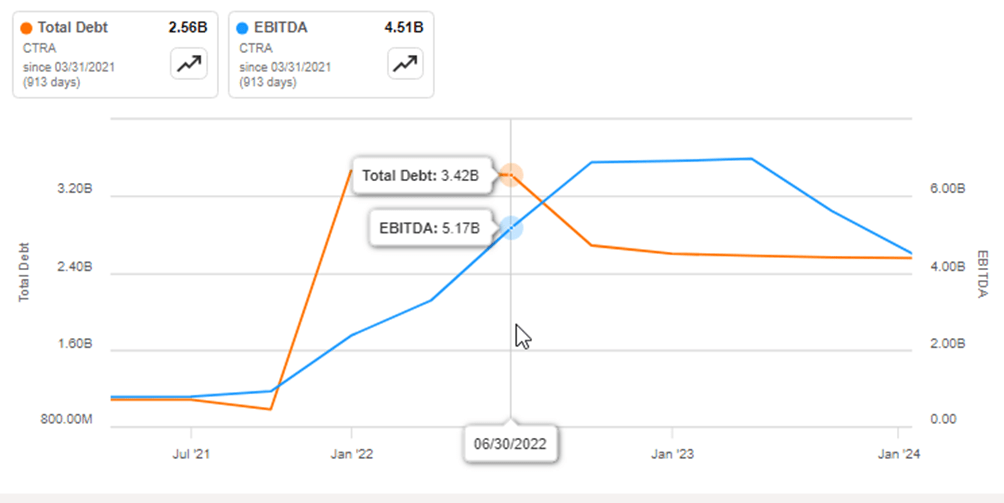
The previous chart shows that Coterra Energy achieved its last target: an EBITDA higher than the total debt. In June 20222, the EBITDA was $5.17 billion, and the total debt was $3.43 billion; from that day until September 2023, the EBITDA had higher values than the total debt.
Overall, I think the company set conservative targets that were reasonable to achieve, plus the help of higher energy prices; in 2022, the energy prices were extremely high compared to base target prices. The button line is that the company achieved its targets, transmitting a sense of security to the investors.
Return On Requity
Another aspect to consider is Coterra Energy's Return on Equity (ROE) and compare it with its pairs. The reason to select EQT Corporation (EQT), Antero Resources Corp (AR), and Range Resources Corp (RRC) as comparable companies is because they have operations in Marcellus Shale; the inclusion of the ETF, Energy Select Sector SPDR Fund (XLE), it is to compare Coterra Energy with the energetic companies in the Standard and Poor's 500.
Source: seekingalpha.com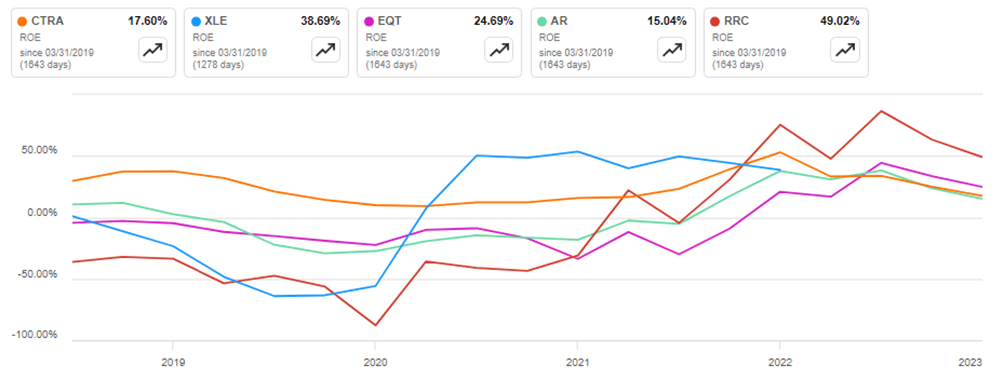
The chart shows that Coterra Energy's return on equity has fluctuated between 10% and 50% without negative values, a considerable result. However, in 2023, Coterra Energy (CTRA) obtained one of the lowest ROEs among its pairs. There is a notable fact: Coterra Energy's ROE has exhibited less volatility, giving investors more confidence.
The analysis presented in the two paragraphs above leads me to believe that the ROE will be at least higher than zero, following its historical average achieved between 2018 and 2023. For instance, if Coterra Energy had a conservative yearly ROE of 10% for the next year, the company would have the capacity to reinvest even in such a situation.
Risk
The primary risk for Coterra Energy lies in the volatility of natural gas and oil prices because the company's revenue levels, profit margins, and, ultimately, its stock price depend on these prices; as John Mayner said, 'Markets can remain irrational longer than you can remain solvent.' so having good timing for buying or selling a financial instrument is essential. Since 2014, Coterra's stock price has followed a trajectory similar to the oil and natural gas prices, as seen in the graph. CL1:COM and NG1:COM are rollovers of the WTI and Henry Hub future contracts with the shortest maturity day; both series act as spot prices because they are close to maturity. When looking at the purple line, it is evident that oil prices are above their historical values. The gas price had a notorious decline from 2022 to 2023, and it returned to stay at levels observed during 2015-2020.
Source: seekingalpha.com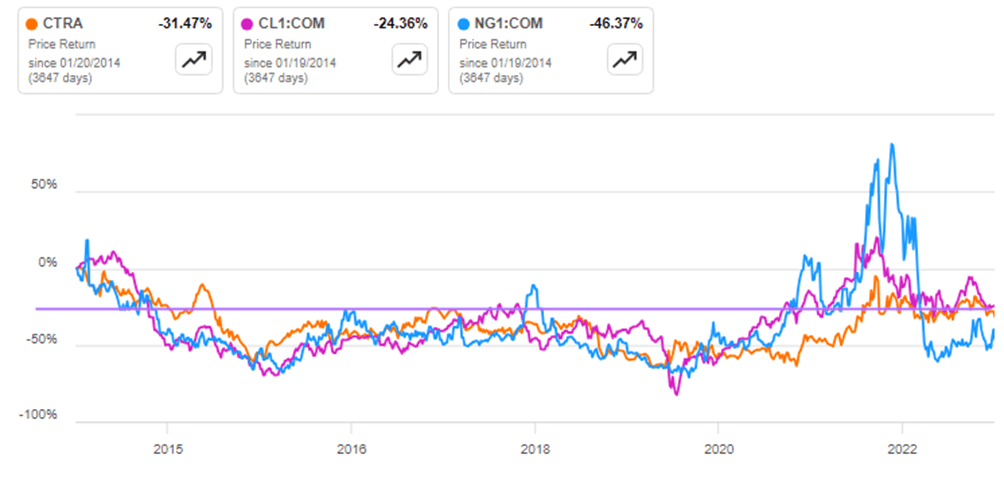
I think it is necessary to wait until oil and natural gas prices decline below their historical average. Sometimes, the best is to wait; it can be a month, a year, two years, or more. At this moment, it is essential to be patient and monitor the evolution of oil prices to identify the appropriate moment to enter.
The previous chart shows that Coterra Energy's stock price has followed the same evolution as the natural gas and oil prices and replicated the energetic market's performance. So, the market in the last ten years has not embedded in the company a particular characteristic by which it is inherent to pay higher market prices year after year.
Conclusion
In the first section of this article, I wrote this question: Why is there a difference between Coterra Energy's production growth and its price per share accumulated returns?
The company's financial statements reveal that it has increased its production levels, maintained positive ROE levels in the last five years, and met its merger objectives. However, the company has not grown at the levels observed before 2014. As a result, the investor perspective has not found Coterra Energy's management to be appealing. Therefore, the company's stock price has largely tracked the gas and oil prices.
The company has yet to manifest any significant internal changes that suggest a shift in management's direction. Therefore, in my opinion, the most probable outcome is that Coterra Energy's stock price will continue to track gas and oil prices.
Consequently, investors should wait for the price of oil and gas to fall below historical averages before considering entering into a position. Meanwhile, for those holding a long position in Coterra Energy, I recommend maintaining their positions.