Ирина Мещерякова
Transparency dominates. One of the first things investors should seek is transparency. They need transparency from their investments and their analysts.
I recently increased my position in one of our worst-performing investments. So far, we're only looking at a modest loss for the average total return across our position. However, we've seen decent gains across many other positions in the same time period. Therefore, the modest decline is among our worst performers.
We're talking about Ready Capital Corporation (RC). Ready Capital is a mortgage REIT, commonly known as mREITs. Many investors struggle to understand mortgage REITs; we don't have that challenge. The mortgage REITs are not too difficult if you understand the important parts. Often, investors spend most of their energy looking at things that are less important.
Let me know what you think of this idea in the comments.
When we look at a mortgage REIT, some of the most important metrics to consider are:
- Book value per share.
- The trend in book value over time.
- The typical price-to-book ratio of the mortgage REIT over time.
- The current and historical difference between the price-to-book ratio for the mortgage REIT and sector peers.
- The type of assets owned by the mortgage REIT.
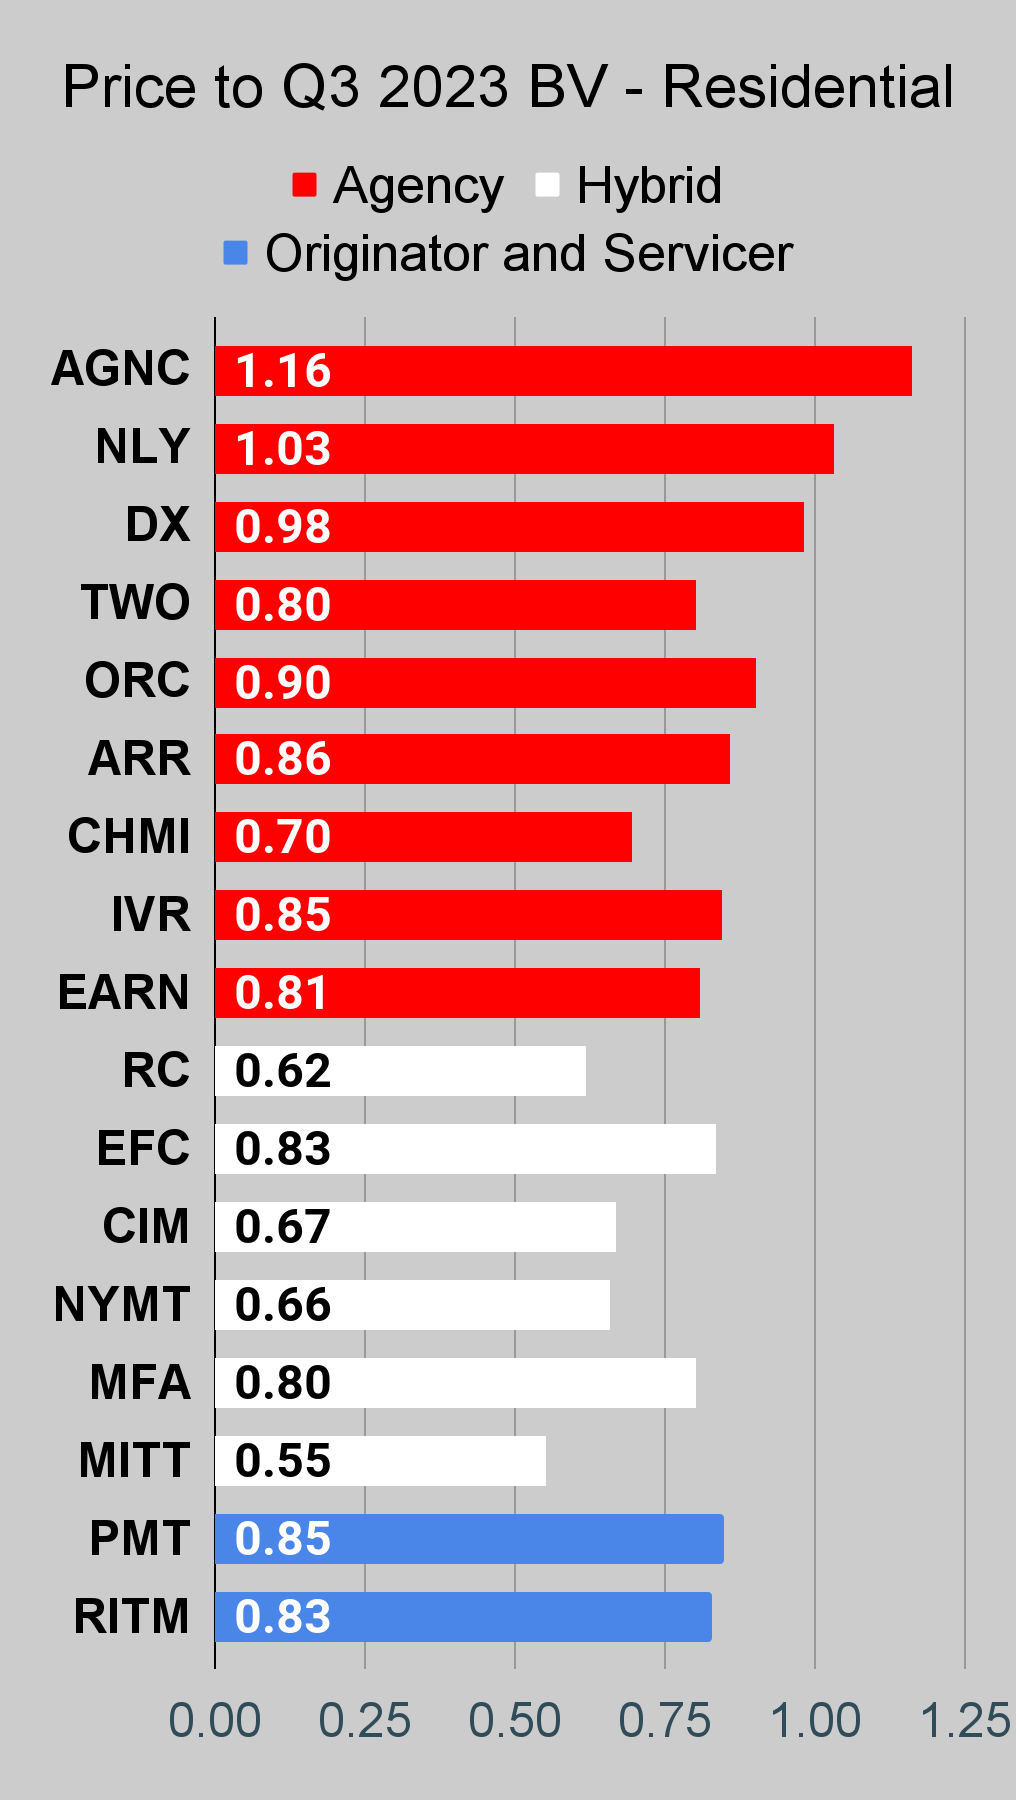
Ready Capital is in an interesting position. They have typically traded at a higher price-to-book ratio than many of their peers. Outside of the pandemic, it has been very rare to see them at huge discounts. That makes the current situation unique.
There are some negative factors in the market today. Ready Capital has a more complex portfolio, and investors are generally less attracted to those portfolios today. The highest price-to-book ratios for mortgage REITs today are coming from agency mortgage REITs. If Ready Capital was an agency mortgage REIT, they would most likely have a higher price-to-book ratio.
However, investors should also be aware that agency mortgage REITs saw enormous declines in book value over the last two years. The agency mortgage REIT model has more exposure to volatility in interest rates.
Has Ready Capital seen a huge decline in book value? No.
Note: Book value (or BV) and Net Asset Value (NAV) will be used interchangeably when discussing Ready Capital. This is common for mortgage REITs, but would be wrong for equity REITs based in the United States.
The REIT Forum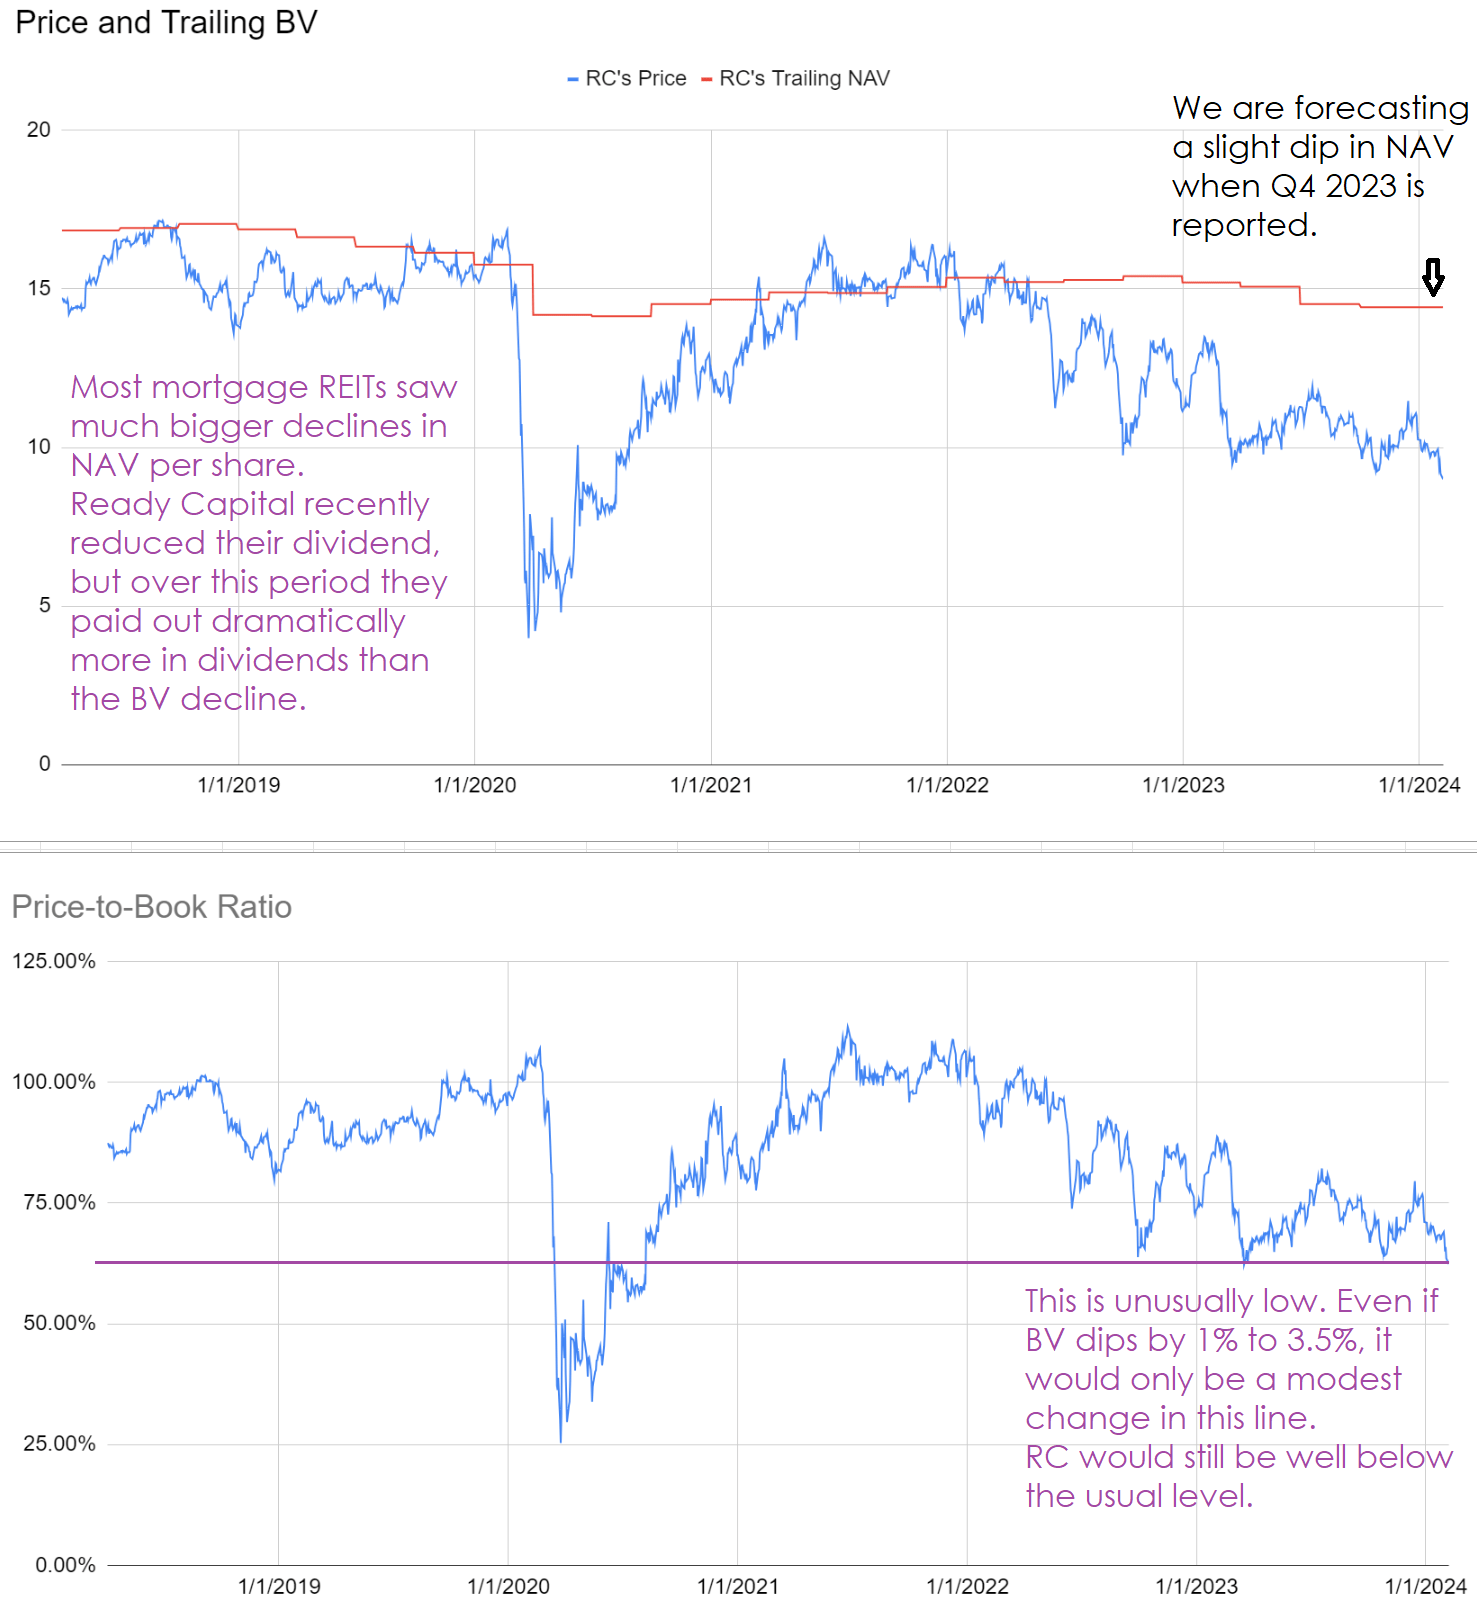
As you can see, RC's decline in NAV wasn't very big. They had mostly recovered from the pandemic hit when rates ripped higher. Thankfully, Ready Capital did not have much exposure to rates.
Thesis
Our thesis is pretty simple here. The price-to-book ratio should go up. We might see some declines in book value per share, but we're also collecting dividends while we wait. Absent a huge hit to book value, we can simply sit in this position and wait for the price-to-book ratio to recover.
Upside and Dividend Yield
At $.30 per quarter or $1.20 per year, the dividend yield on Ready Capital at $8.90 is about 13.5%. That's clearly higher than 13%.
For the upside, I'm not assuming Ready Capital's book value increases.
I'm not assuming Ready Capital trades over book value (though they did for about half of 2021 and part of 2022).
I'm using a conservative BV estimate of only $13.85 (quite a bit lower than the Q3 2023 value) and applying a 90% price-to-book ratio. That combination would imply a price of $12.47.
For reference, RC has traded about $12.47 within the last year. The 52-week high is $13.30.
If shares recovered to trade at $12.47, it would be a gain of 40%.
Even if returns fall short of that level, they could still be quite attractive.
Buying More
I recently added to my position at $8.83 per share. I think RC is still a nice bargain that offers investors a significant amount of upside.
I hate when people say they bought something and then they mean they "bought" it in some imaginary account.
Here's the trade confirmation:
Fidelity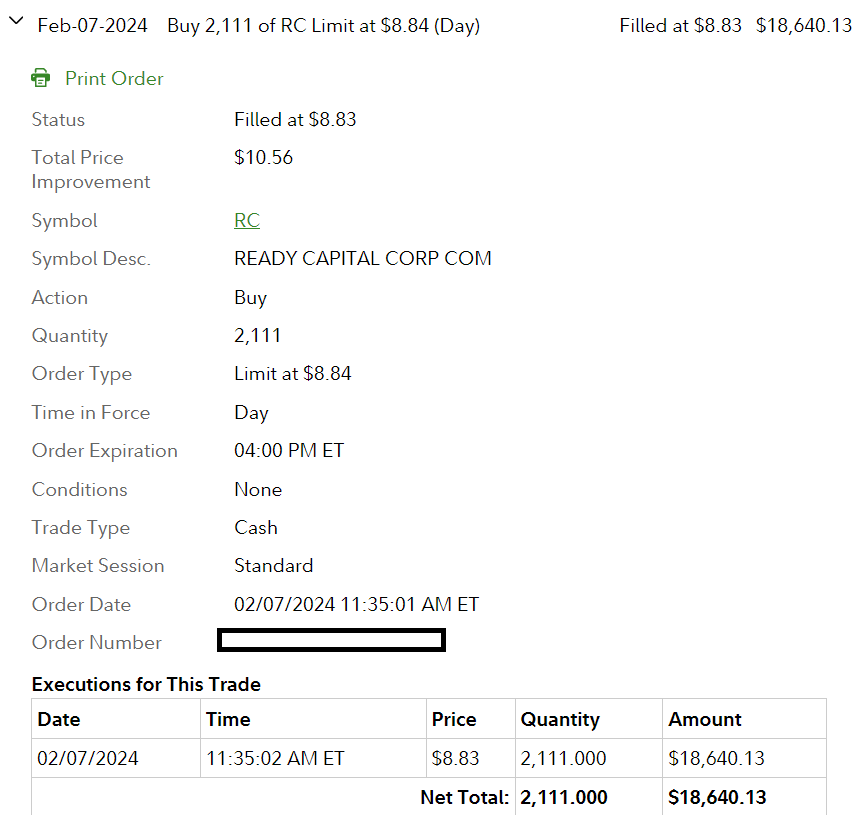
Most of my trades go through Schwab, but I do have a tax-advantaged account with Fidelity also.
Good for transparency? I think so. Now there's no misunderstanding.
A Comparison
I have another set of charts that shows the values for RC along with the values for Rithm Capital Corp. (RITM).
The REIT Forum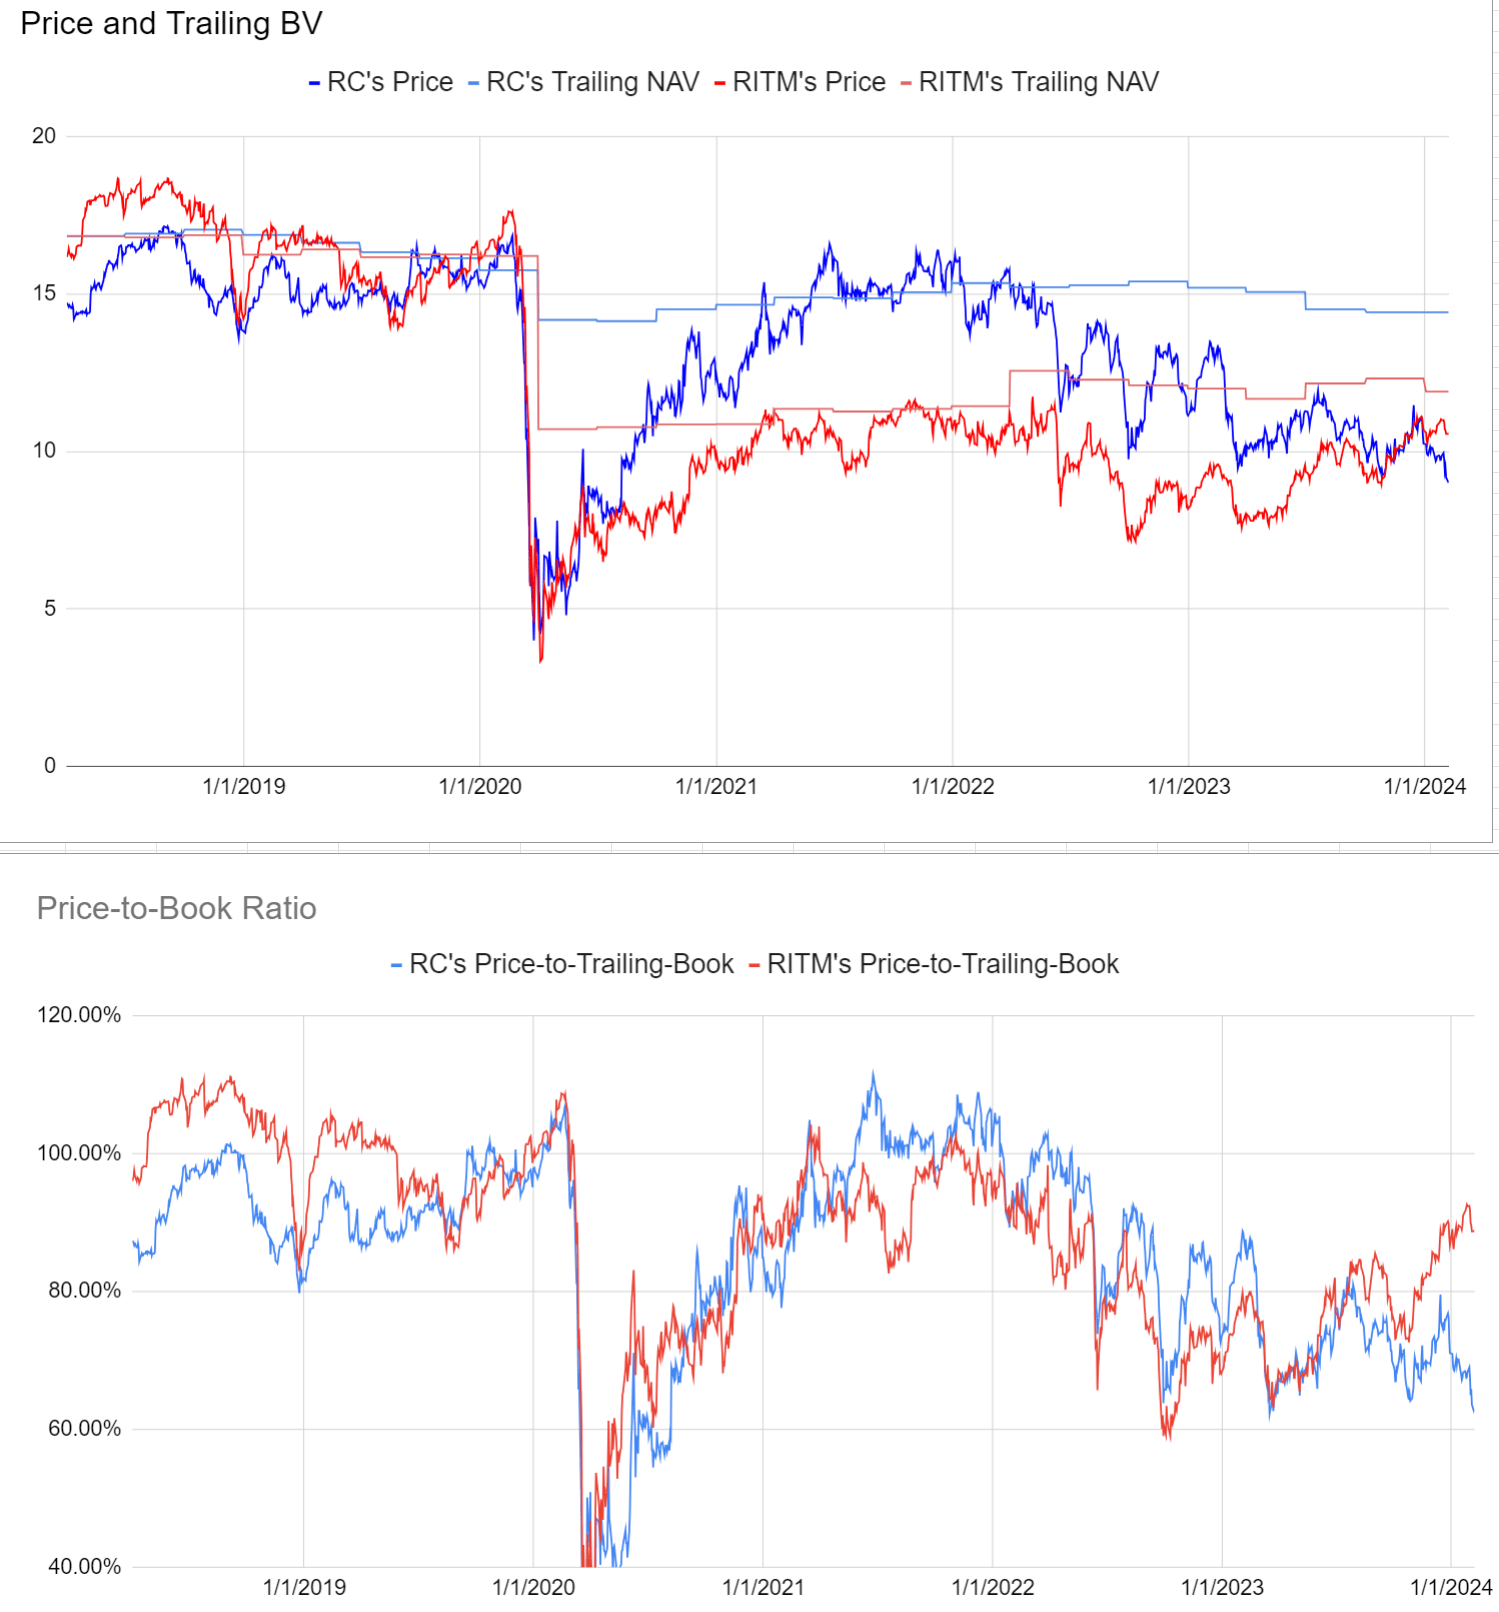
You can see that RITM's price-to-book ratio recently recovered to around 90%. It took quite a while, but it happened. Meanwhile, shares were paying out an attractive dividend.
I'm still expecting Ready Capital to do the same thing eventually.
Debt
Mortgage REITs typically use a large amount of debt. Broadmark didn't like to use debt, but Ready Capital acquired them in 2023. Throughout mortgage REIT analysis, investors should expect to see high levels of debt. The mortgage REIT owns assets that pay interest and they finance those loans to generate income from the spread between the two rates.
One of the things I like about Ready Capital is their use of "Securitized Debt Obligations."
Ready Capital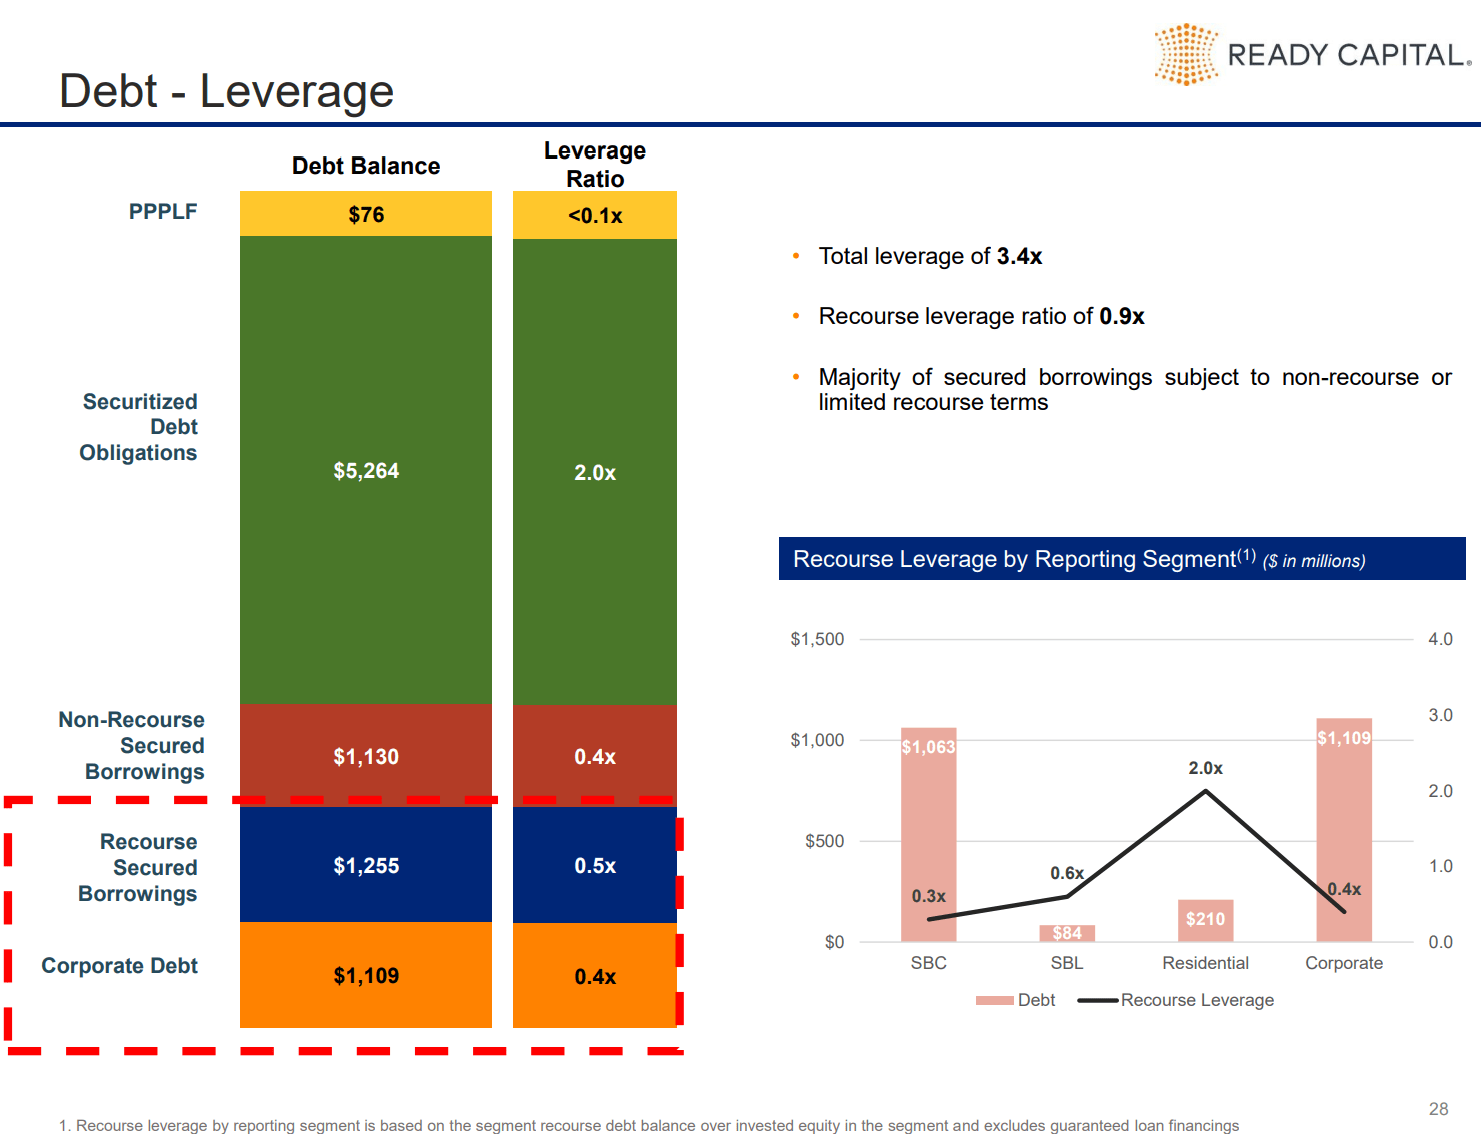
These are a form of non-recourse financing. Further, they are one of the best forms of financing for this business structure.
We want to see loans securitized this way because it eliminates the need for future negotiations.
During the pandemic, many banks became much more restrictive on the financing they provided. That was bad. Without going into detail, it severely damaged some mortgage REITs that were relying on the banks for financing. Those mortgage REITs were using "Repo" financing. It's fine for some mortgage REITs to use repo financing, but it's not a great structure for credit-sensitive assets.
With repo financing, the bank can declare that your asset has a lower market value and they need more collateral.
With the securitized debt obligation, Ready Capital is getting their financing locked in.
When Ready Capital creates the securitized debt obligation they are locking in financing. The assets and the debt are matched up. The other party gets a lower-risk investment than Ready Capital and accepts a lower yield in return.
Let's try an example. This is just hypothetical.
- Ready Capital invests $100 with an 11.5% yield. They might get financing for $70 at 8.59%. Ready Capital's remaining investment is $30.
- Ready Capital is expecting to generate gross interest of $11.5, pay out $6.013 for financing, and retain $5.487 in net interest income.
- If some of those loans default, Ready Capital would try to find a solution to maximize the value they can get from that position.
- Ready Capital would be exposed to losses on their position before the lender that is getting the lower interest rate. However, the most Ready Capital can lose in this scenario is $30.
This is a good system. There's no wasted time trying to renegotiate positions. Ready Capital is still fully incentivized to maximize the value of the loans because they are the first ones exposed to loss. However, they don't have to worry about the lender wanting to change the terms.
Stock Table
We will close out the rest of the article with the tables and charts we provide for readers to help them track the sector for both common shares and preferred shares.
We're including a quick table for the common shares that will be shown in our tables:
Type of REIT or BDC | ||||
Residential Agency | Residential Hybrid | Residential Originator and Servicer | Commercial | BDC |
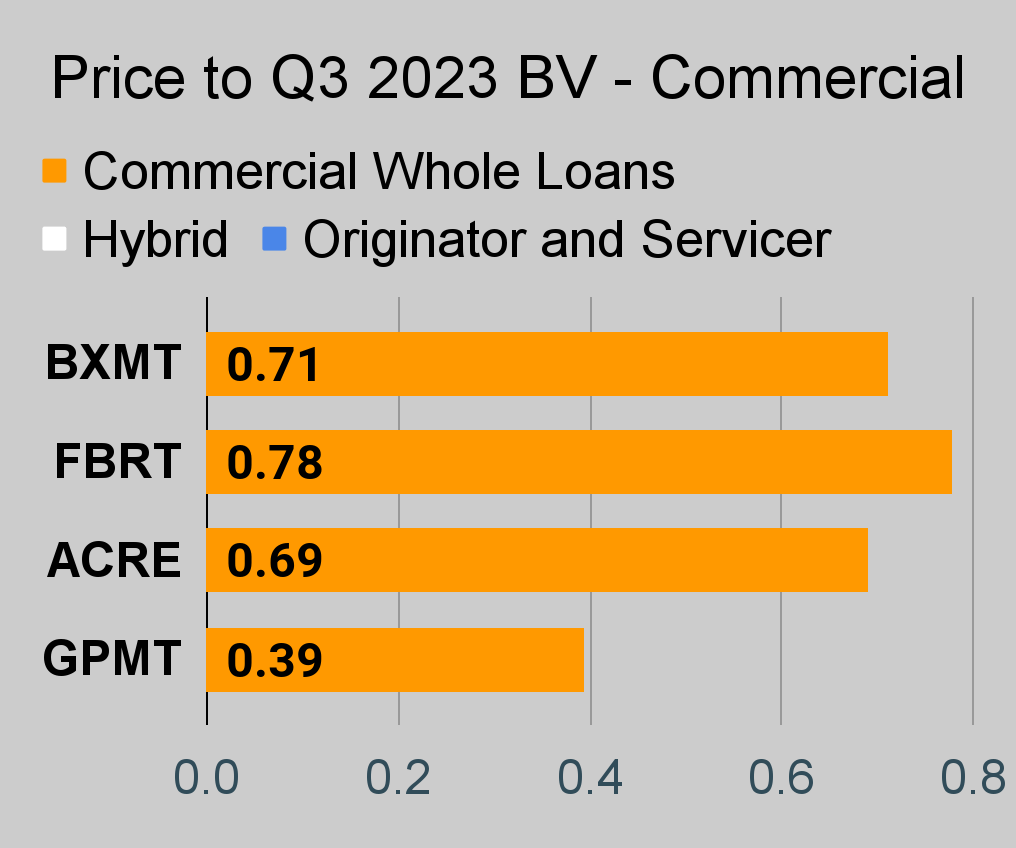
If you're looking for a stock that I haven't mentioned yet, you'll still find it in the charts below. The charts contain comparisons based on price-to-book value, dividend yields, and earnings yield. You won't find these tables anywhere else.
For mortgage REITs, please look at the charts for AGNC, NLY, DX, ORC, ARR, CHMI, TWO, IVR, EARN, CIM, EFC, NYMT, MFA, MITT, AAIC, PMT, RITM, BXMT, GPMT, WMC, and RC.
For BDCs, please look at the charts for MAIN, CSWC, ARCC, TSLX, TPVG, OCSL, GAIN, GBDC, SLRC, OBDC, PFLT, TCPC, FSK, PSEC, and MFIC.
This series is the easiest place to find charts providing up-to-date comparisons across the sector.
Notes on Chart Sorting
Within each type of security, the sorting is usually based on risk ratings. However, it is quite common to have a few shares that are tied. When the shares are tied for risk rating, the sorting becomes arbitrary. There may occasionally be errors where a share's position is not updated quickly following a change in the risk rating. That can happen because the charts come from a separate system. When I update the system we use for members, it doesn't change the order in the charts.
When I say "within each type of security", I'm referencing categories such as "agency mortgage REITs". The "hybrid mortgage REITs" are all listed after the "agency mortgage REITs". However, that does not mean RC (lowest hybrid) has a higher risk rating than the highest agency mortgage REIT. Each batch is presented by themselves.
PMT and RITM are tied for risk rating.
Finally, there's an outlier. We don't cover EARN. However, it was frequently requested for this series. Consequently, I added it to the charts. The important part here is that EARN was never assigned a risk rating. Since it has no assigned risk rating, it got lumped in at the top. However, I do not believe EARN would actually get a higher risk rating than IVR. I believe EARN would actually be less risky than IVR.
This could probably be written better. If someone feels inclined to take it upon themselves to write a section that is objectively better at communicating these points, I would be interested in using it. I'm grateful to have the best readers on SA. I attribute this to self-selection bias. I include enough things to offend the dumb people that I'm left with the best readers.
Residential Mortgage REIT Charts
Note: The chart for our public articles uses the book value per share from the quarter indicated in the chart. We use the current estimated (proprietary estimates) book value per share to determine our targets and trading decisions. It is available in our service, but those estimates are not included in the charts below. PMT and NYMT are not showing an earnings yield metric as neither REIT provides a quarterly "Core EPS" metric. Presently, a few other REITs also have no consensus estimate.
Second Note: Due to the way historical amortized cost and hedging are factored into the earnings metrics, it is possible for two mortgage REITs with similar portfolios to post materially different metrics for earnings. I would be very cautious about putting much emphasis on the consensus analyst estimate (which is used to determine the earnings yield). In particular, throughout late 2022 the earnings metric became less comparable for many REITs.
 The REIT Forum | 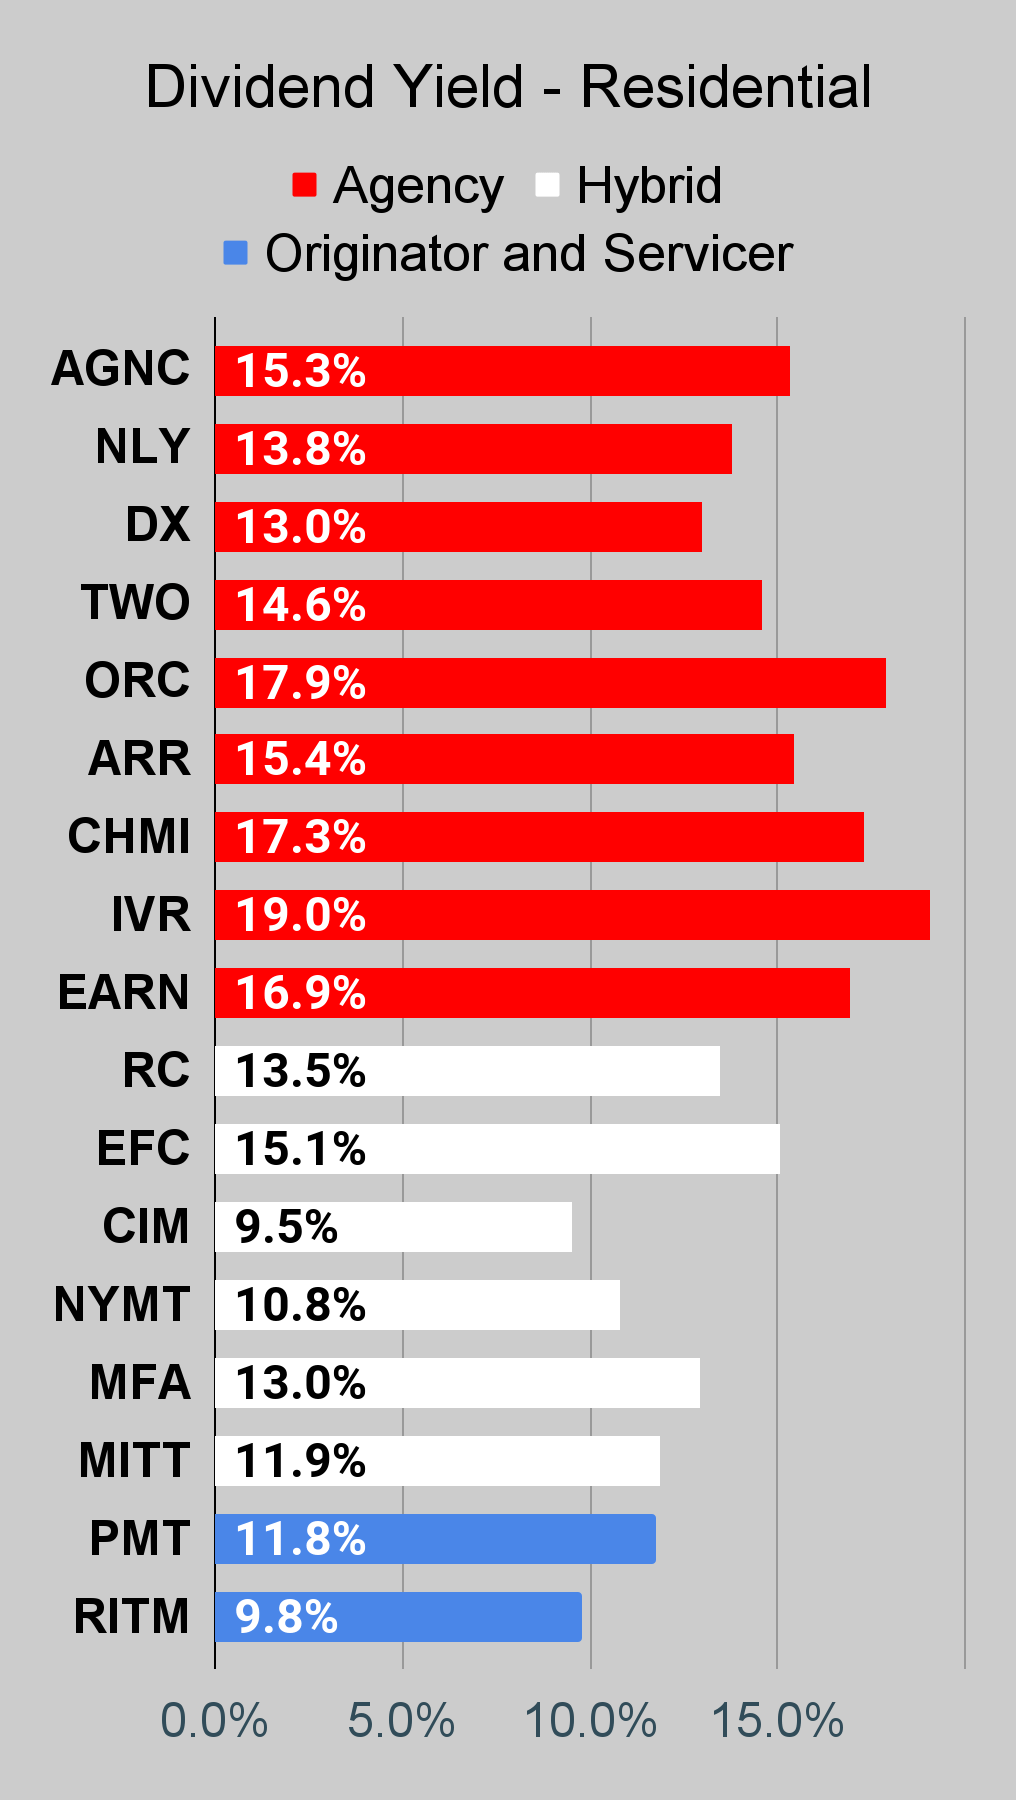 The REIT Forum | 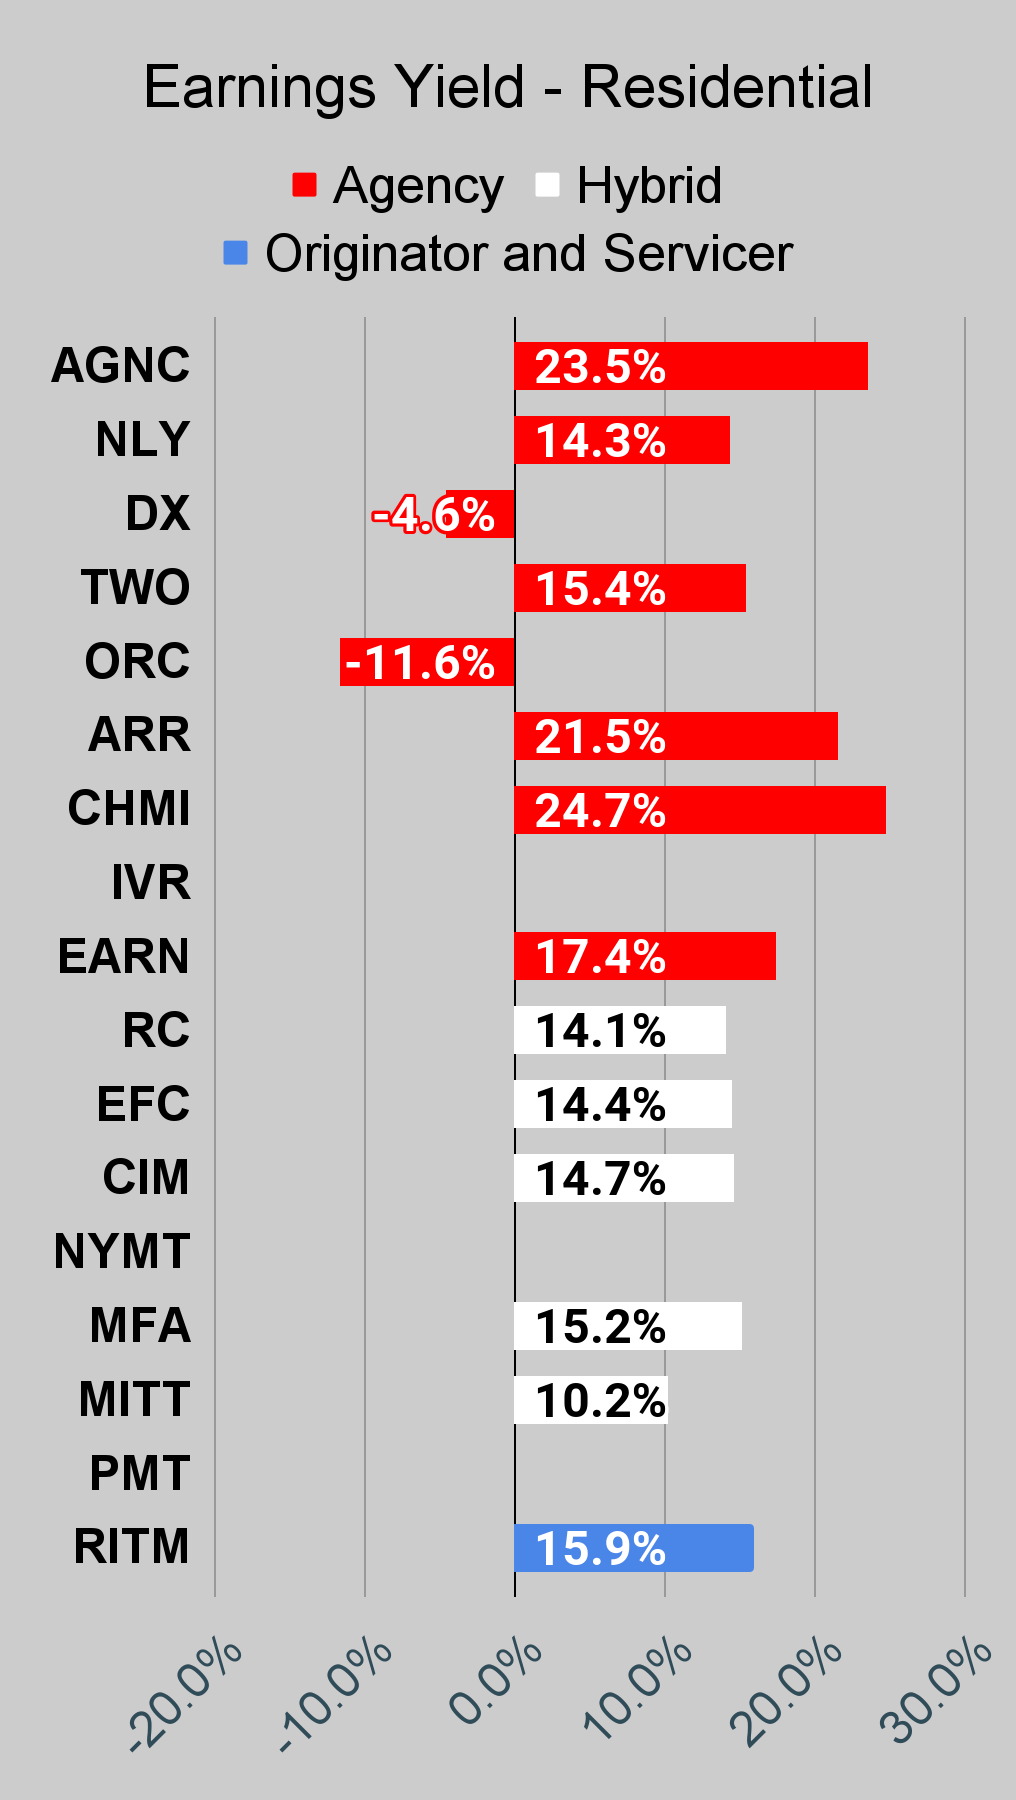 The REIT Forum |
Commercial Mortgage REIT Charts
 The REIT Forum | 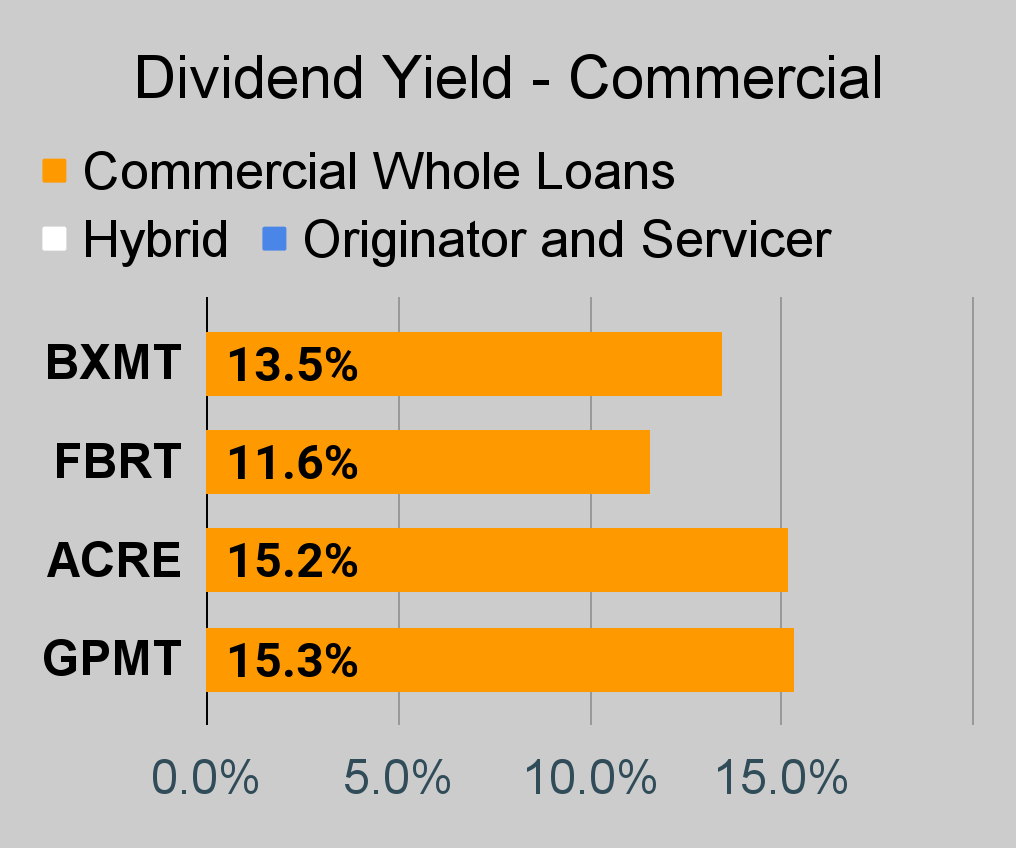 The REIT Forum | 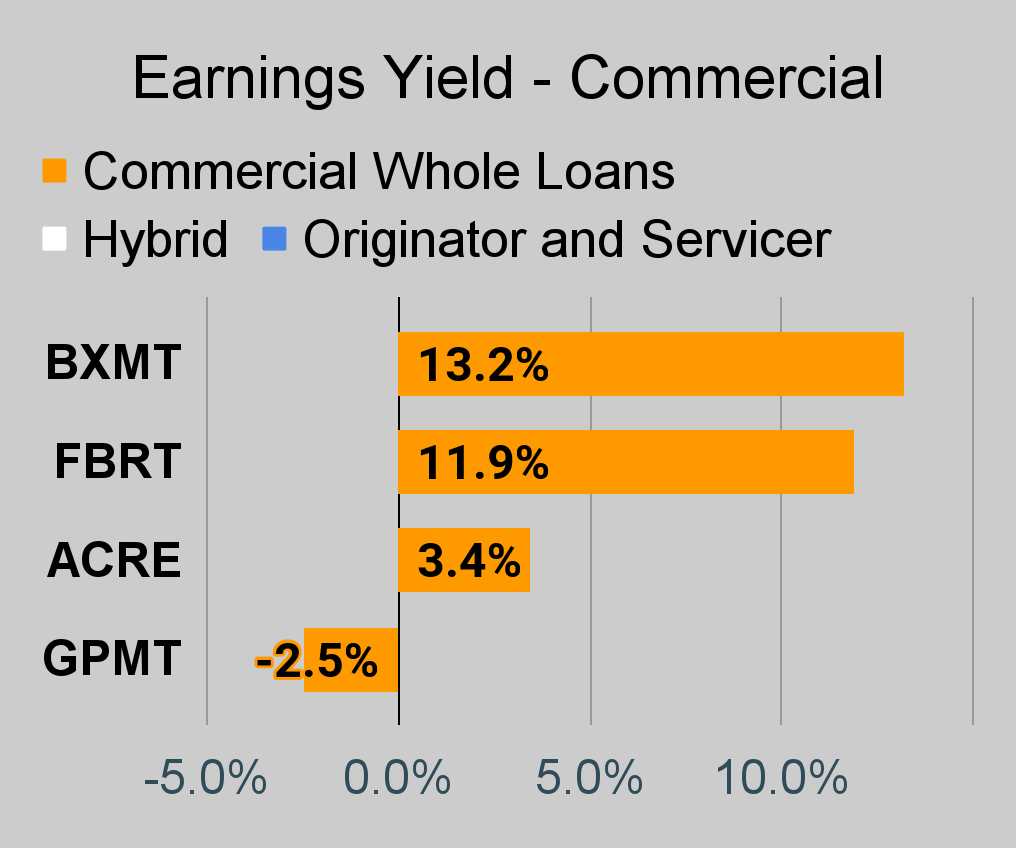 The REIT Forum |
BDC Charts
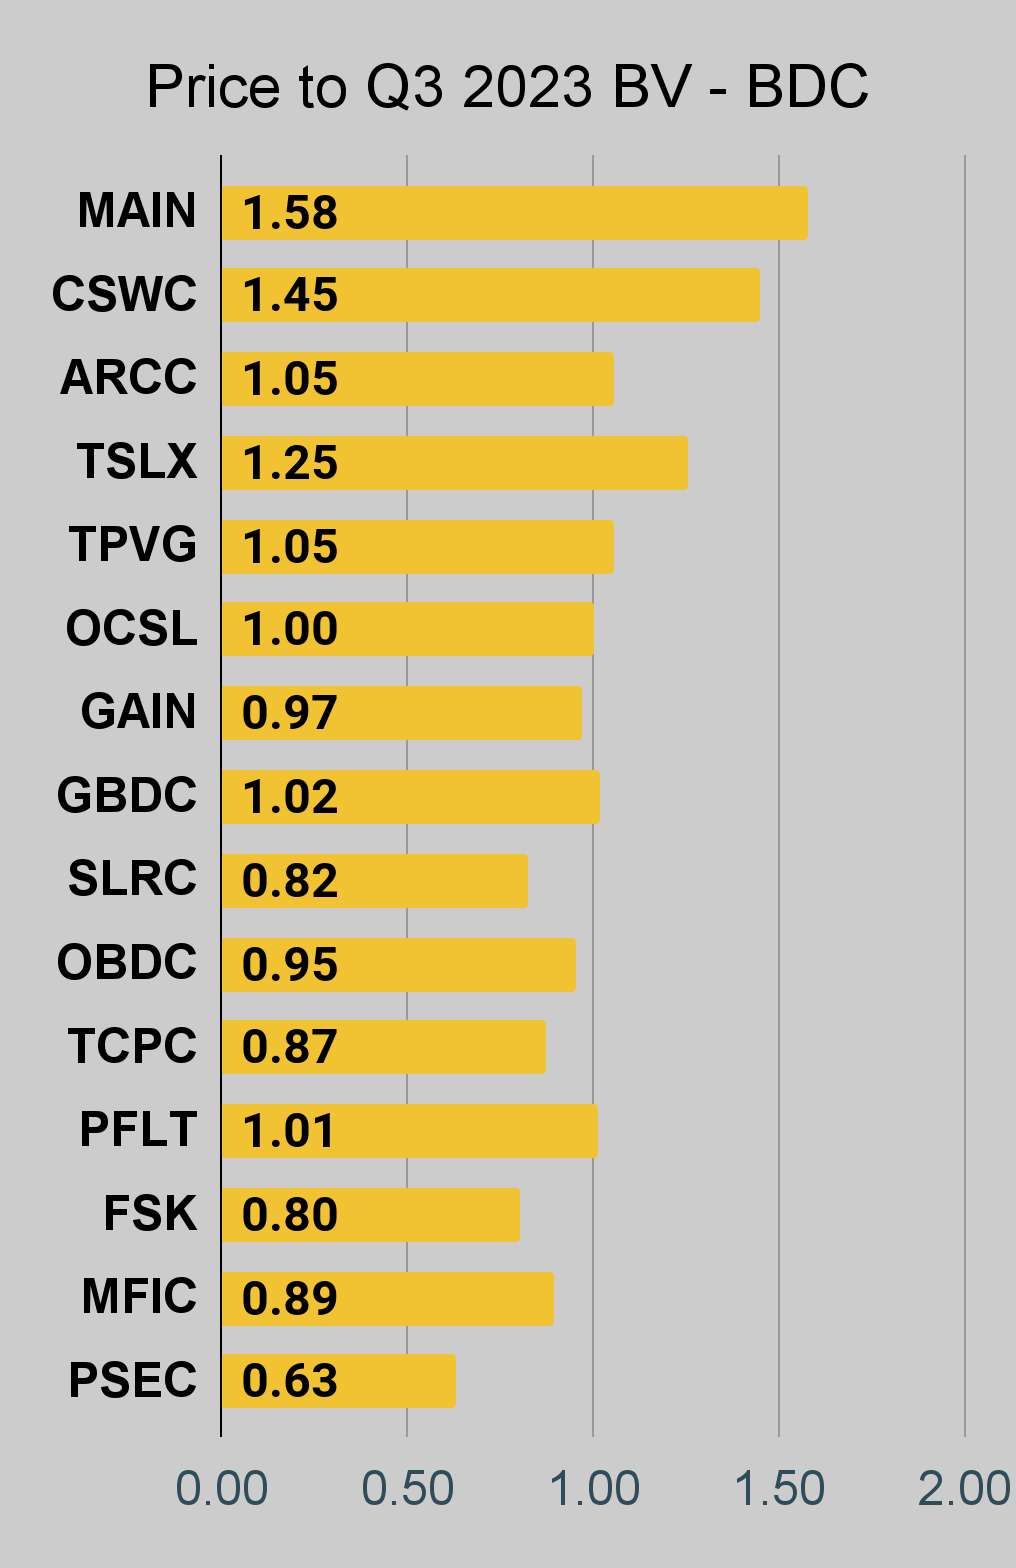 The REIT Forum | 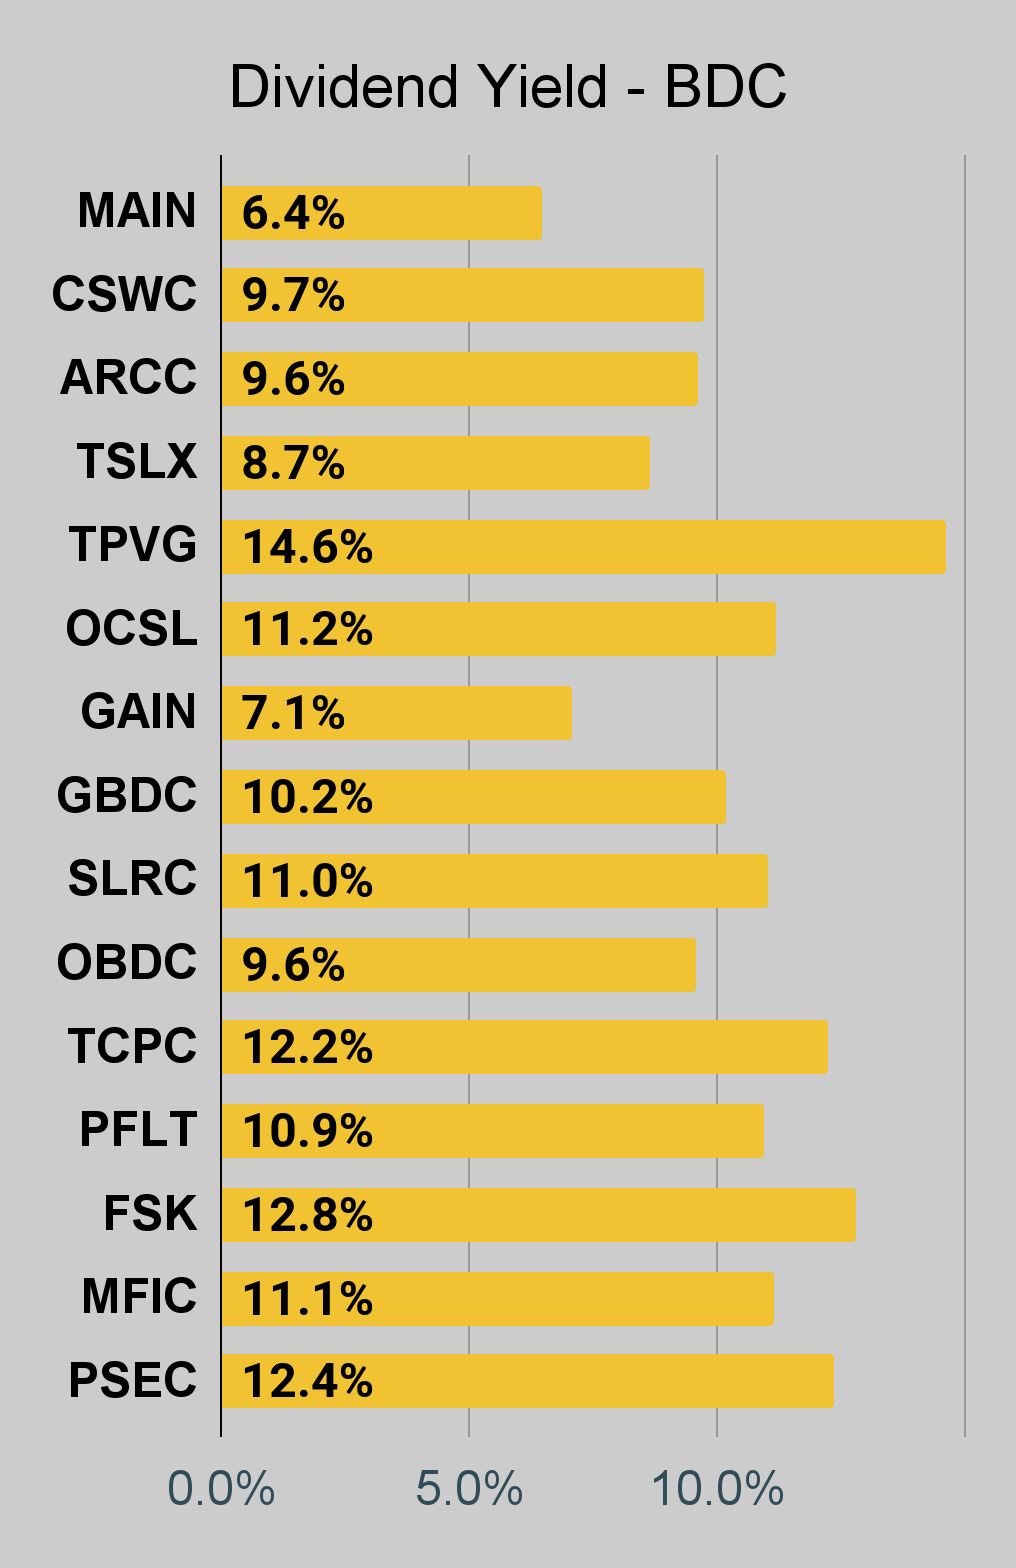 The REIT Forum | 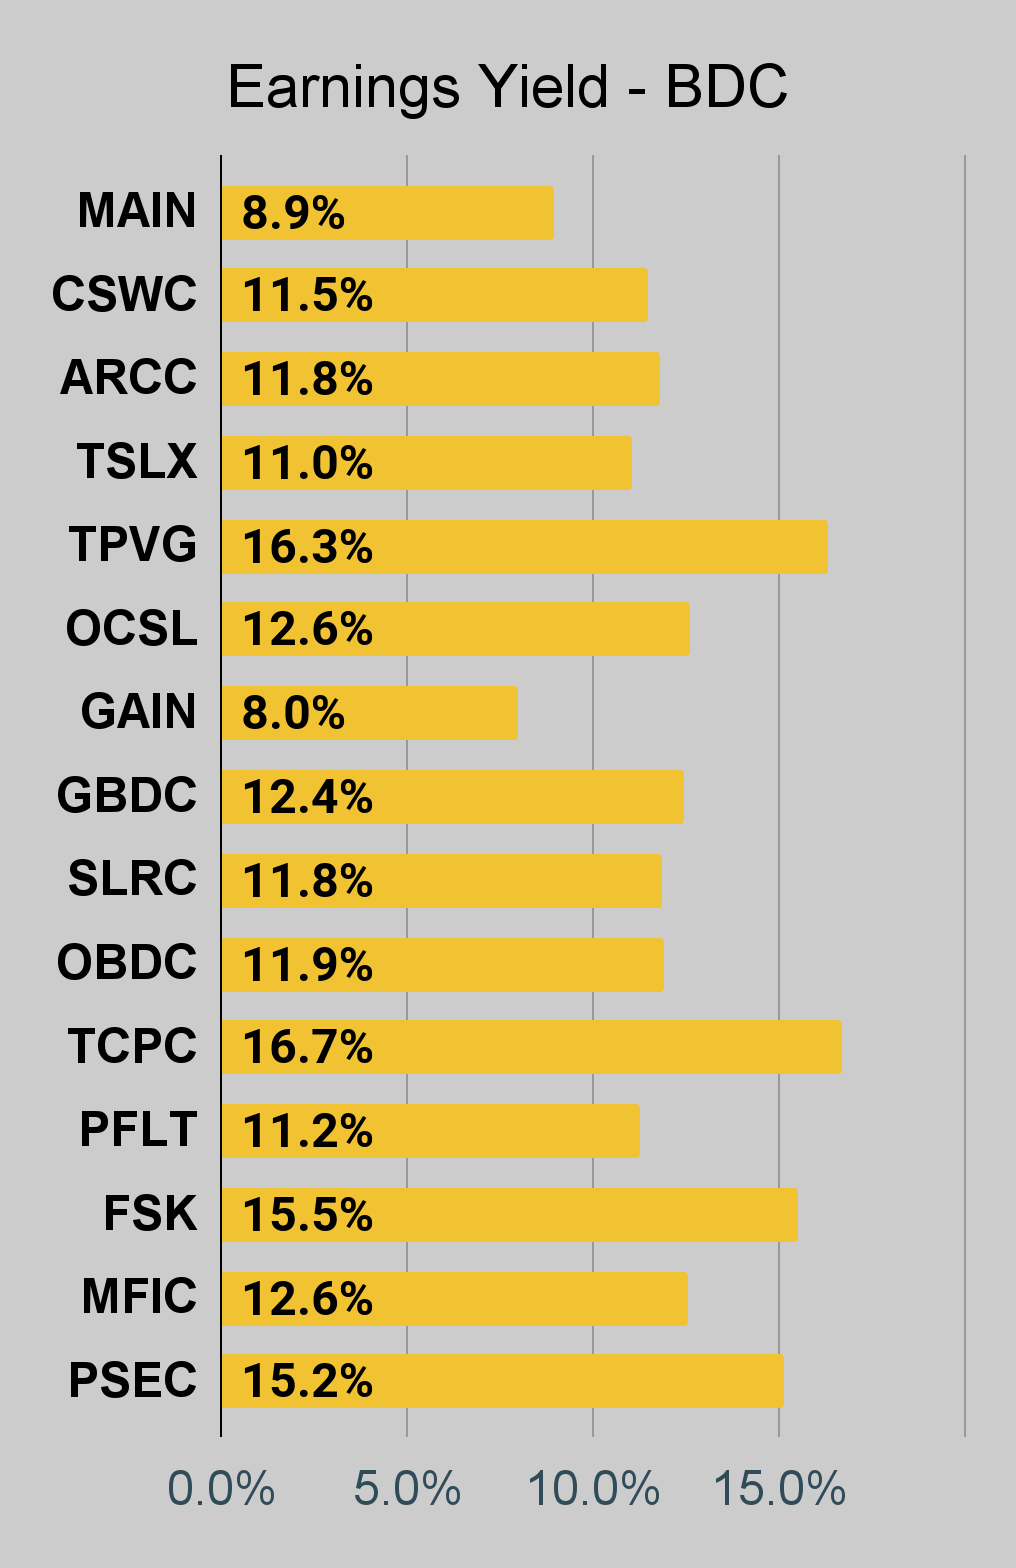 The REIT Forum |
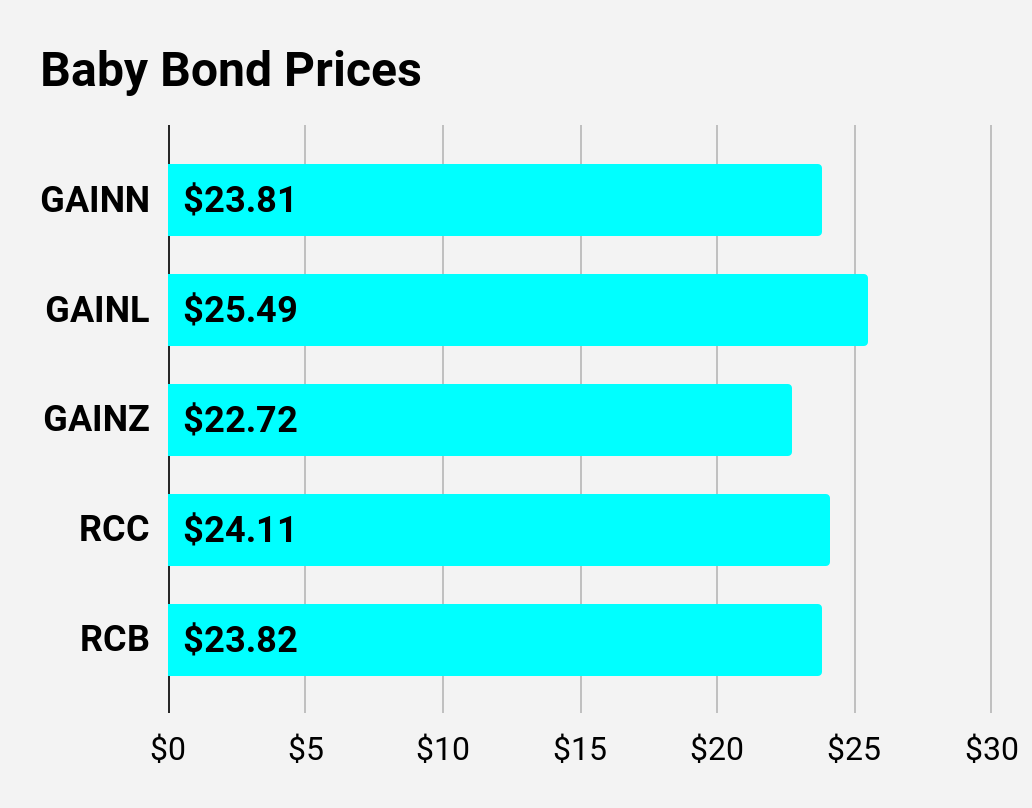
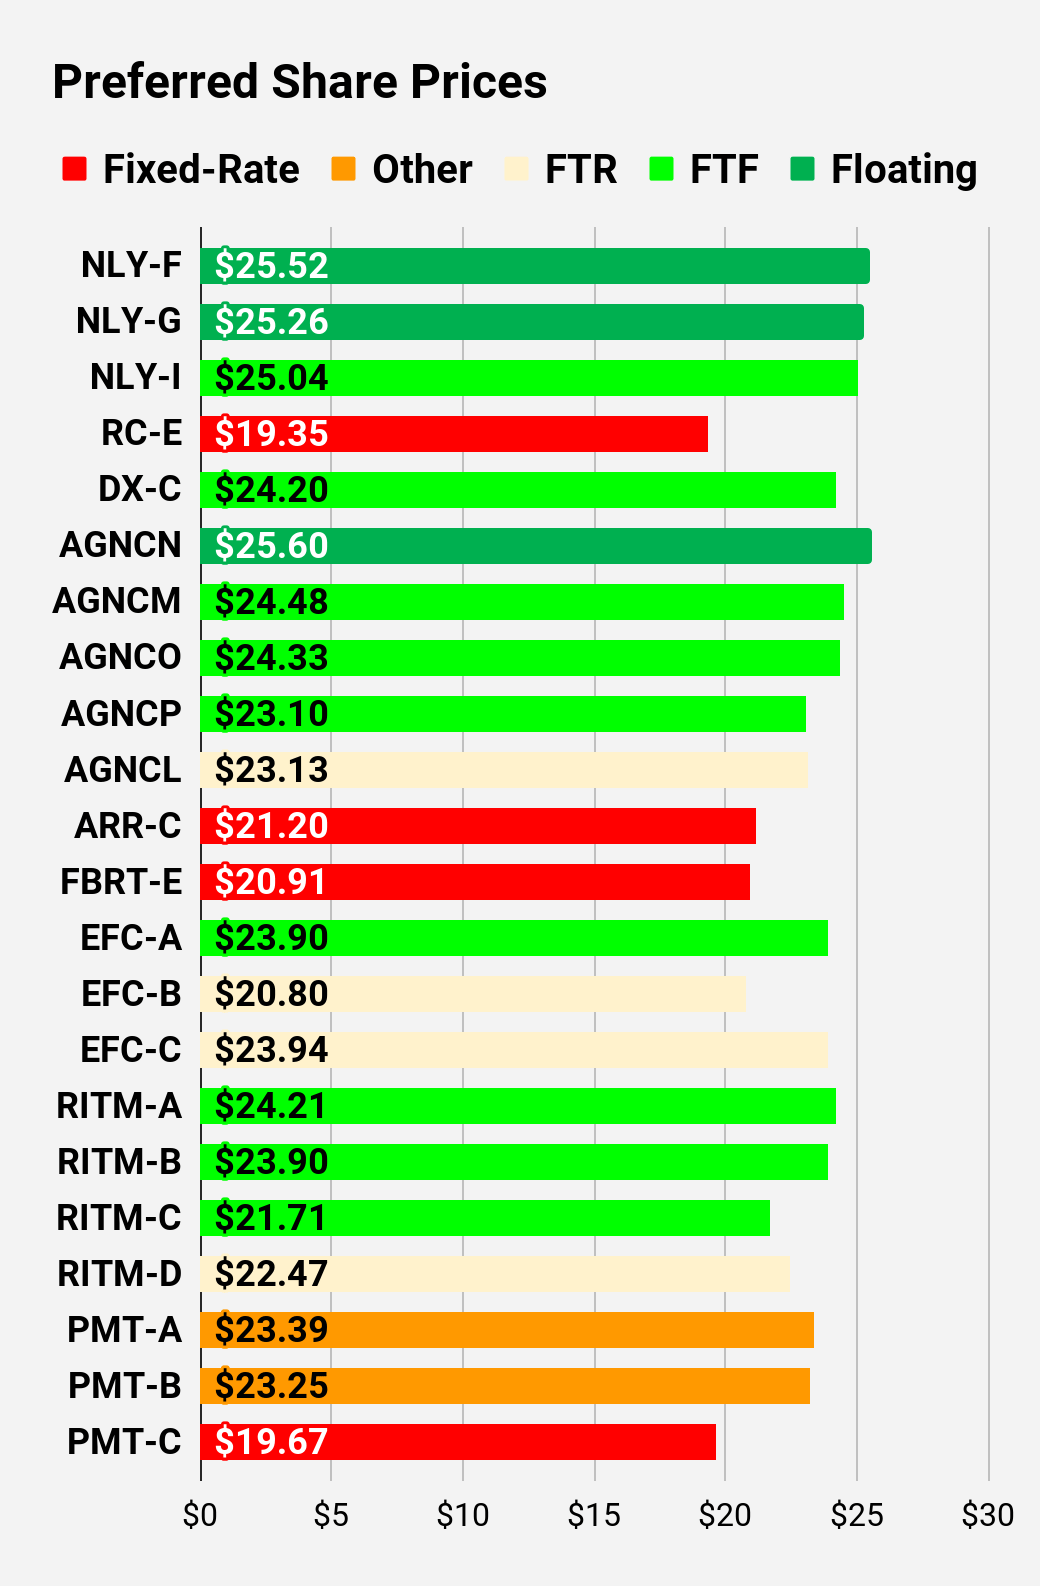
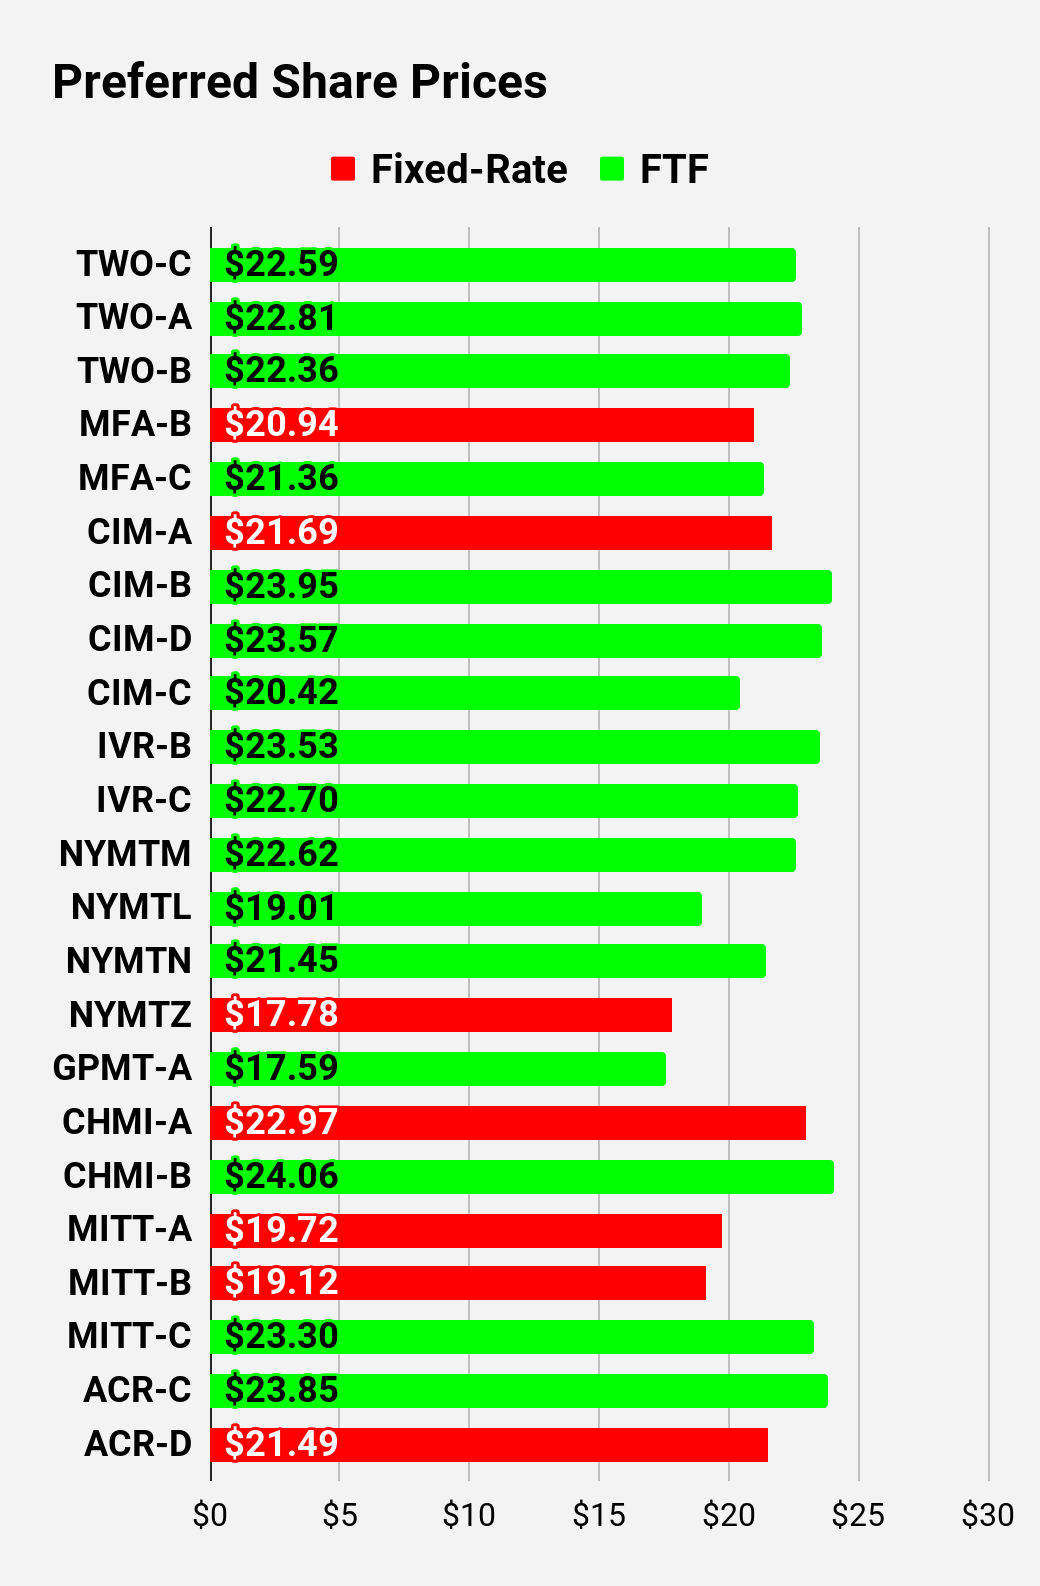
Preferred Share and Baby Bond Charts
I changed the coloring a bit. We needed to adjust to include that the first fixed-to-floating shares have transitioned over to floating rates. When a share is already floating, the stripped yield may be different from the "Floating Yield on Price" due to changes in interest rates. For instance, NLY-F already has a floating rate. However, the rate is only reset once per 3 months. The stripped yield is calculated using the upcoming projected dividend payment and the "Floating Yield on Price" is based on where the dividend would be if the rate reset today. In my opinion, for these shares, the "Floating Yield on Price" is clearly the more important metric.
 The REIT Forum | 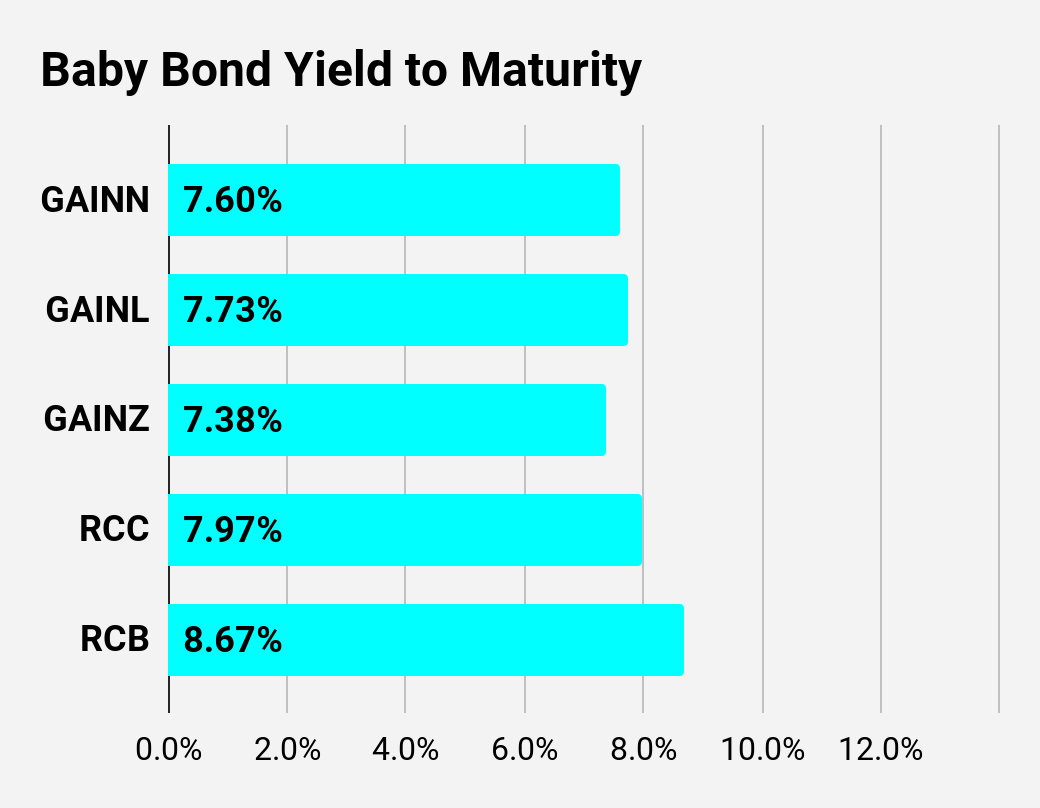 The REIT Forum | 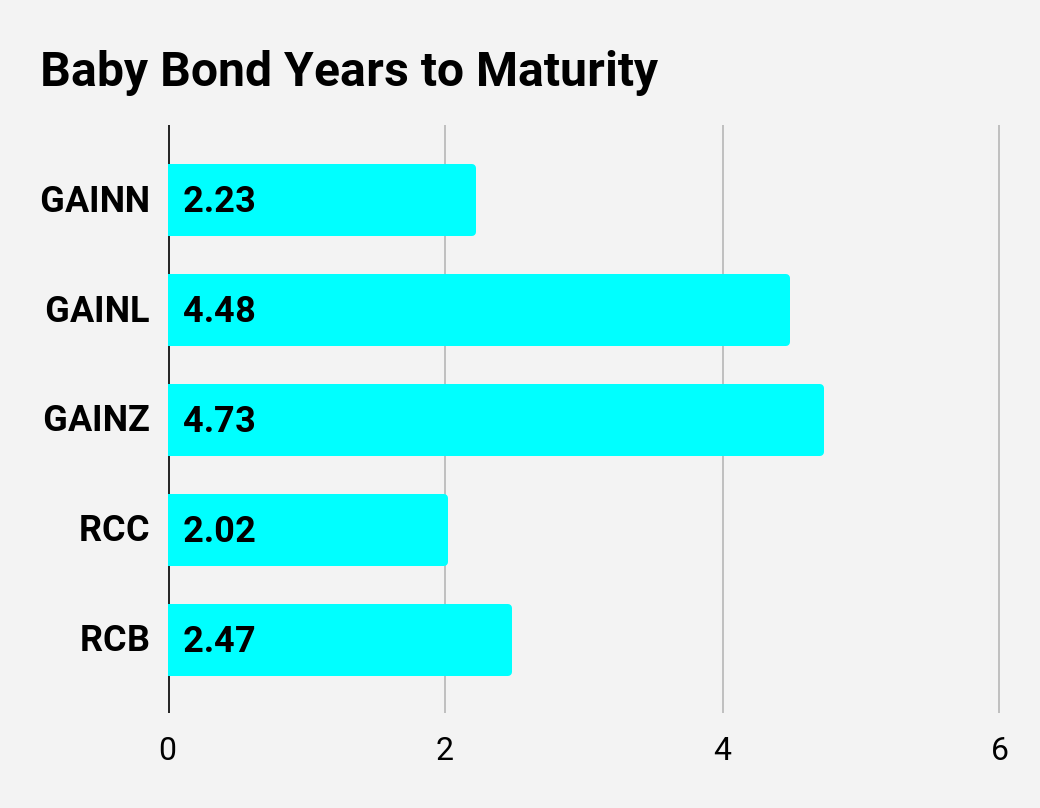 The REIT Forum |
 The REIT Forum | 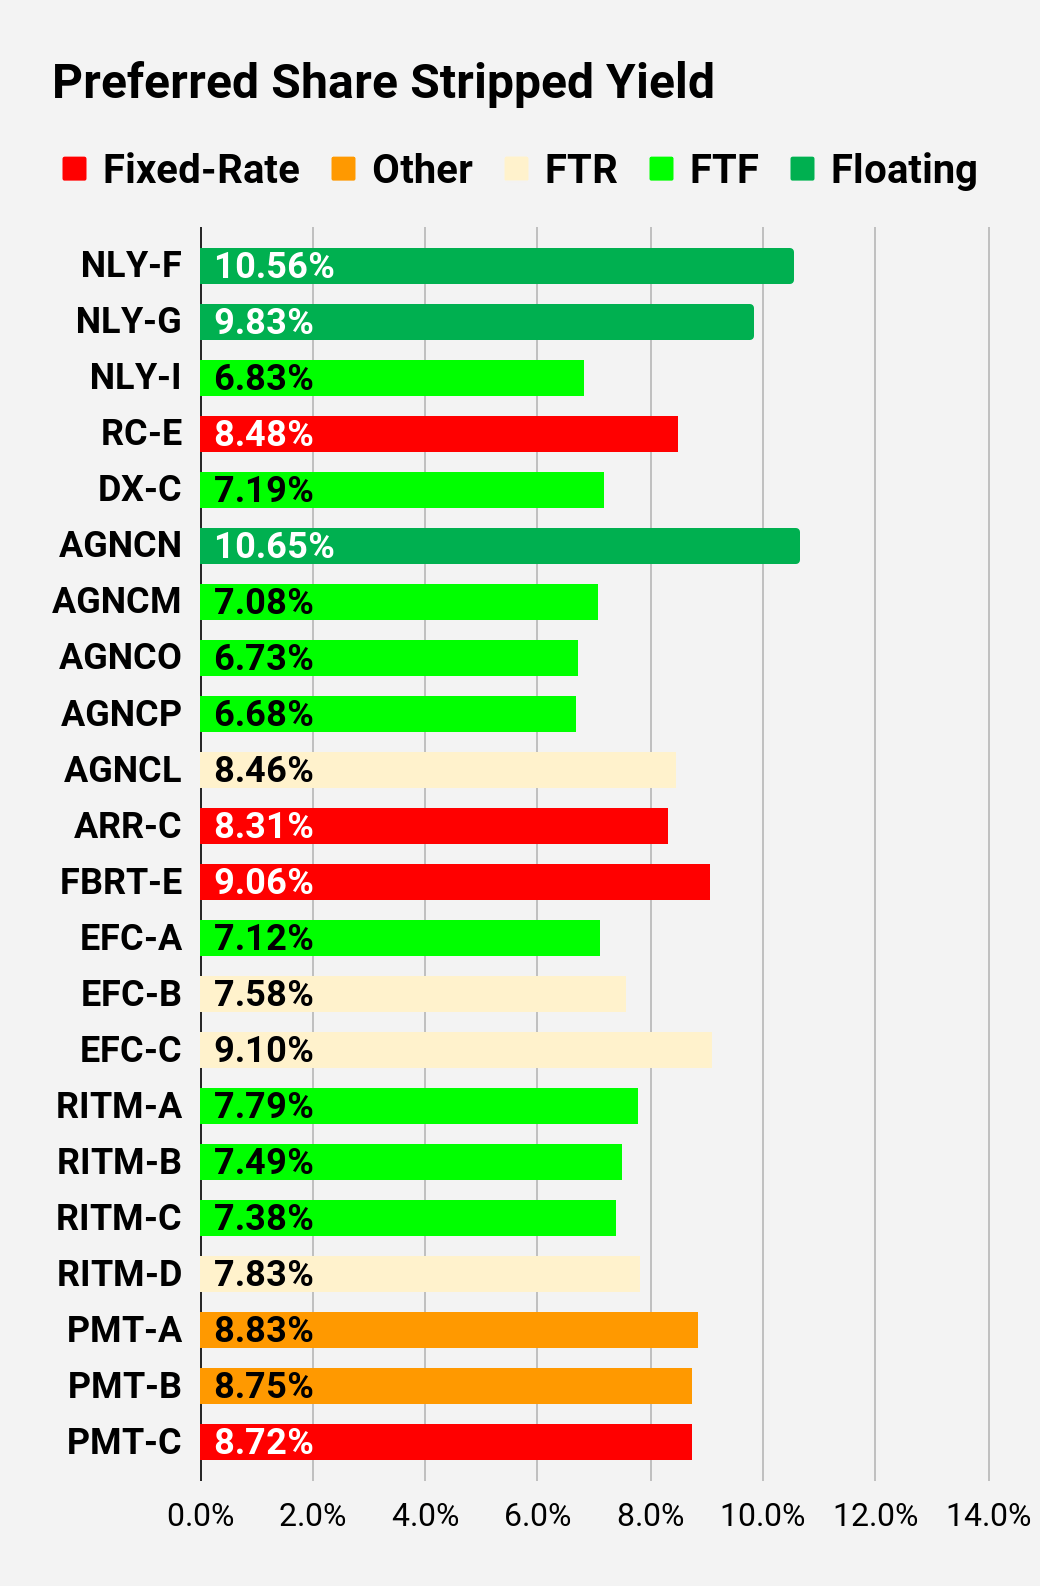 The REIT Forum | 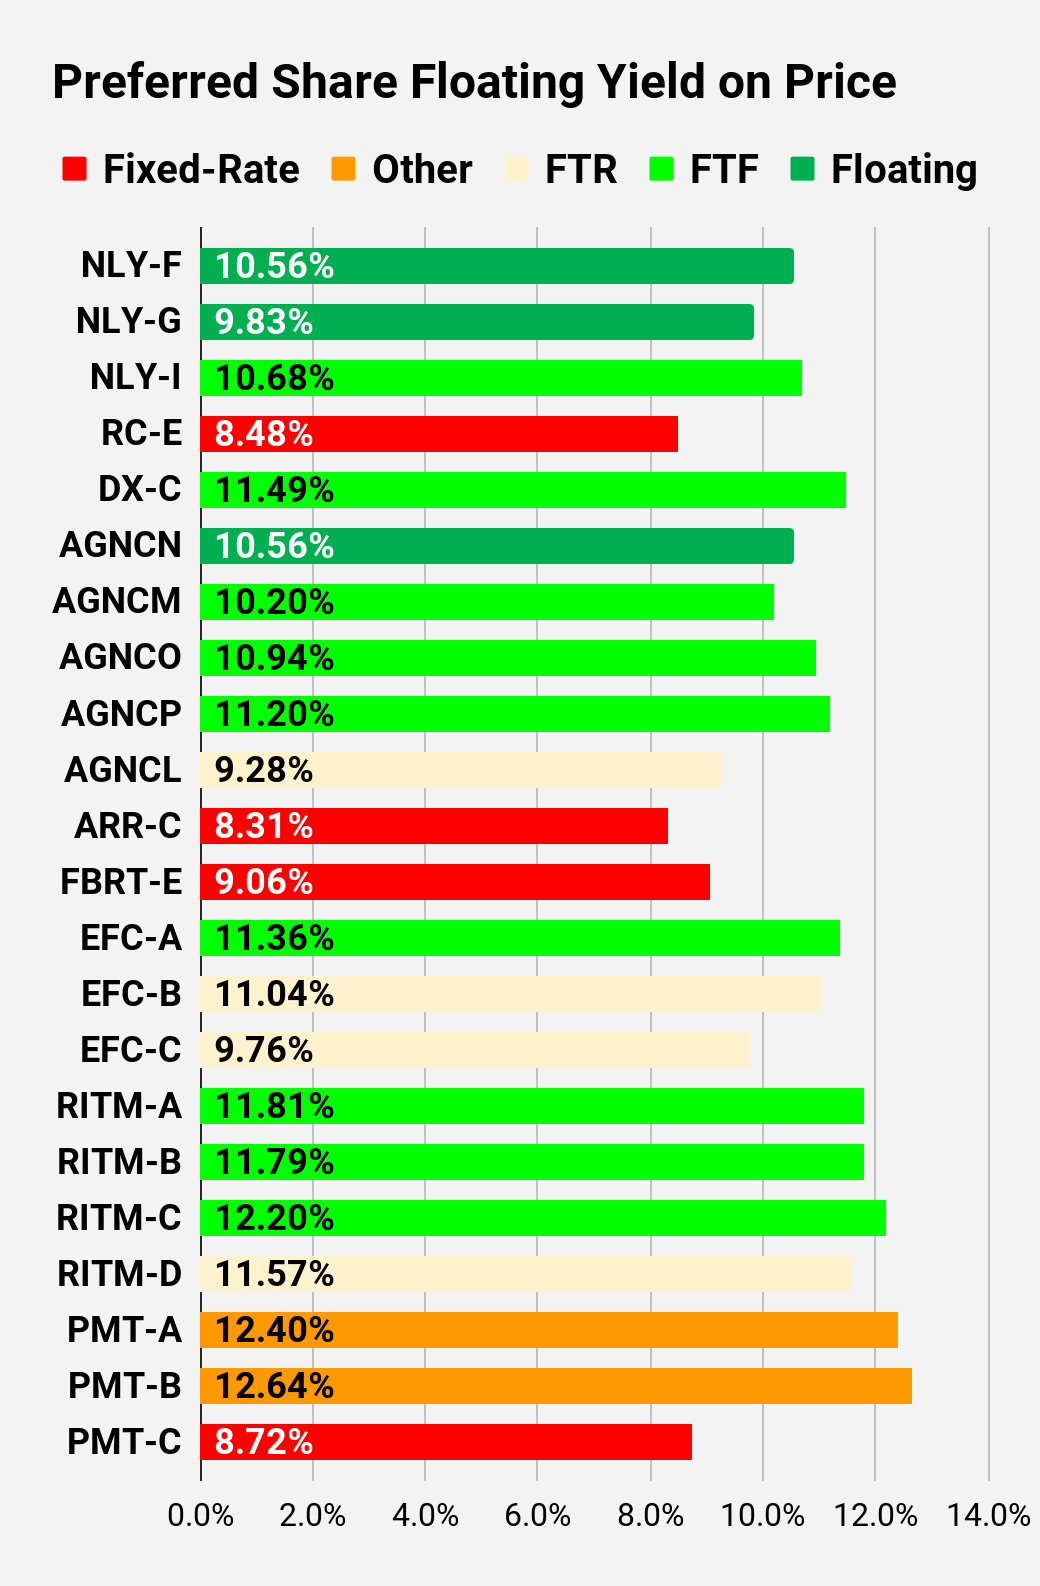 The REIT Forum |
 The REIT Forum | 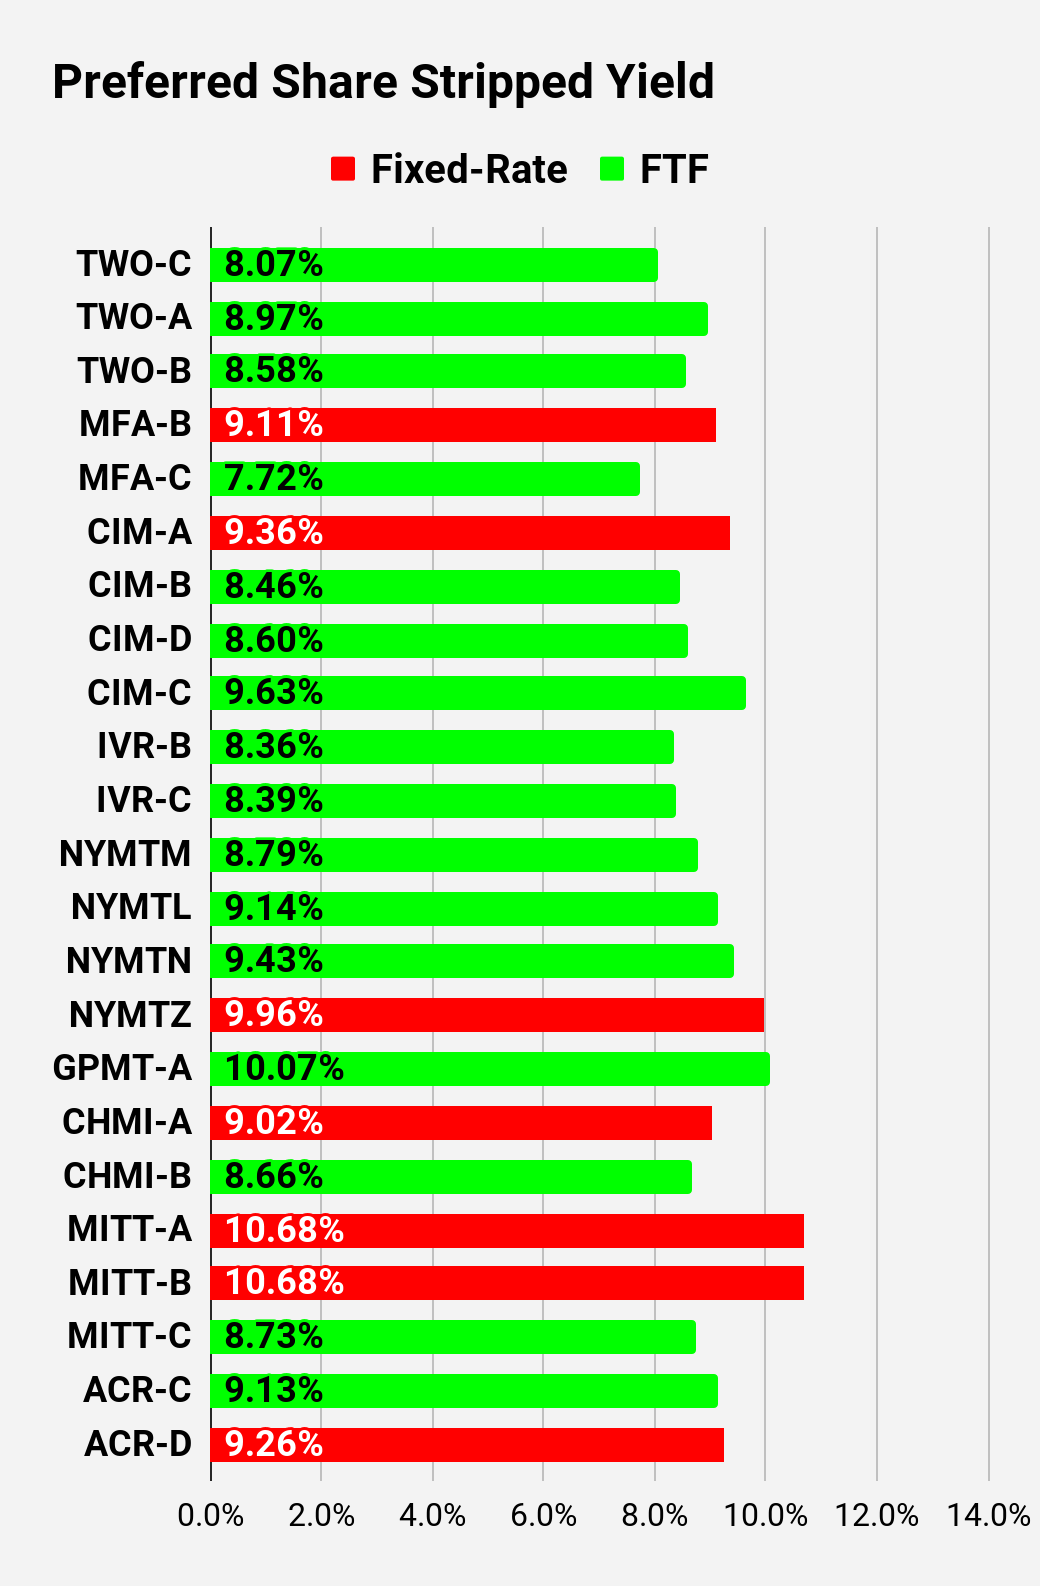 The REIT Forum | 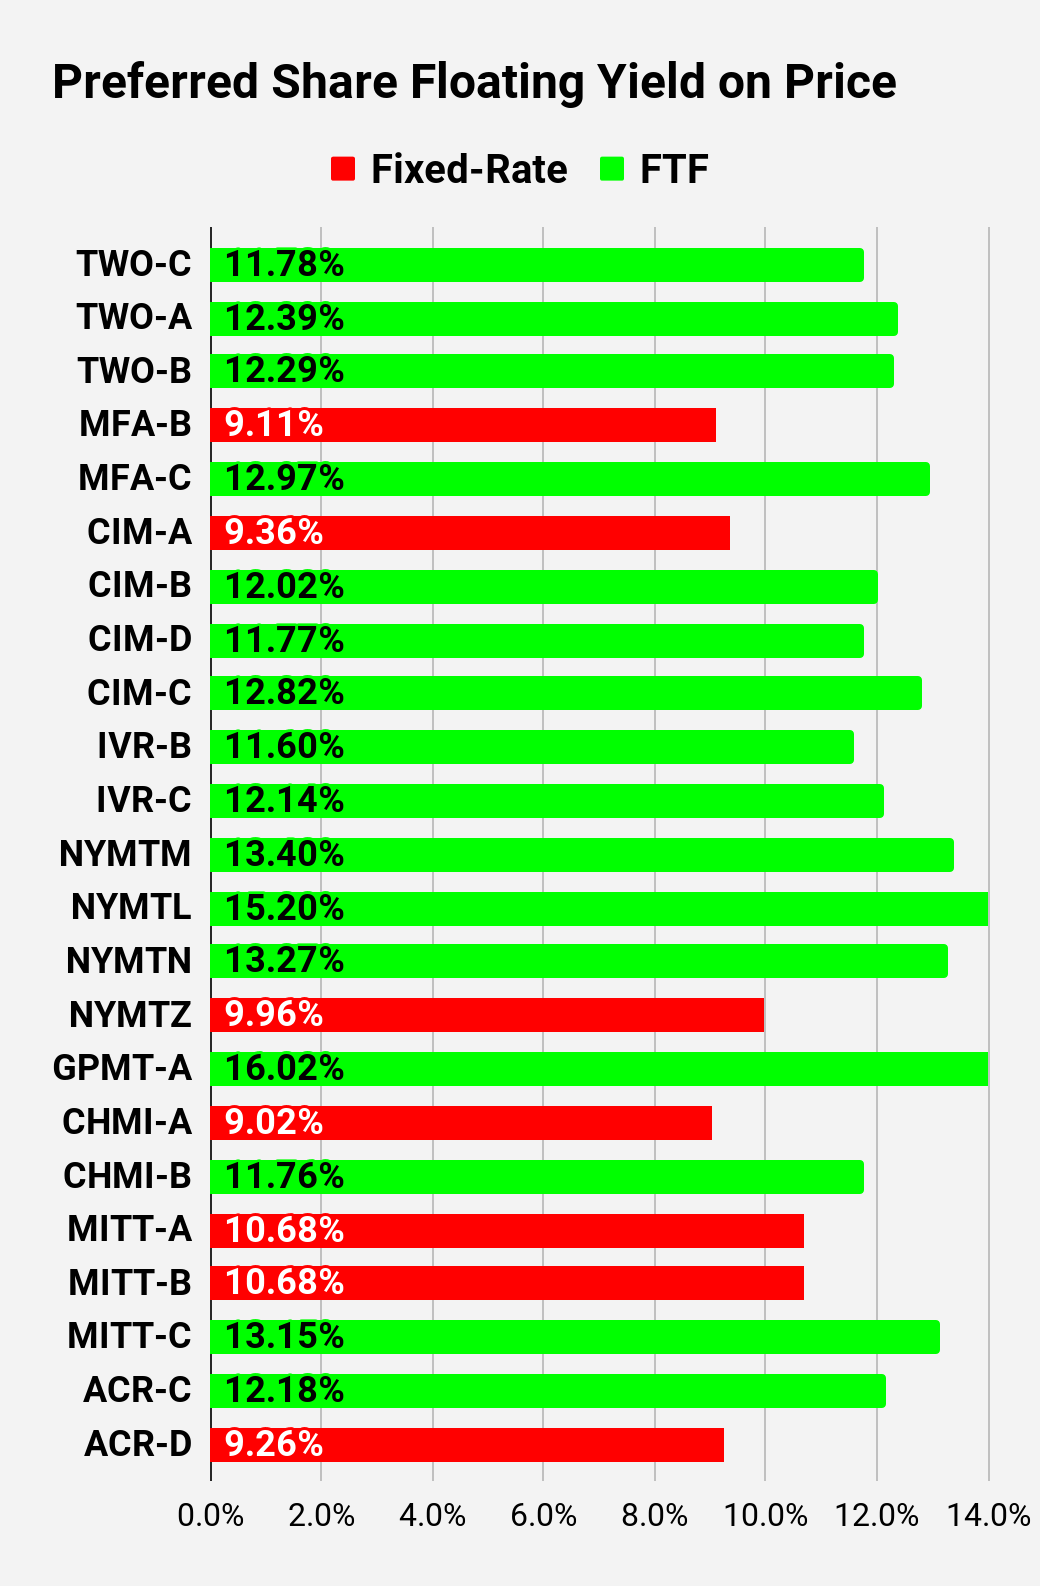 The REIT Forum |
Note: Shares that are classified as "Other" are not necessarily the same. Within The REIT Forum, we provide further distinction. For the purpose of these charts, I lumped all of them together as "Other." Now there are only two left, PMT-A and PMT-B. Those both have the same issue. Management claims the shares will be fixed-rate, even though the prospectus says they should be fixed-to-floating.
Preferred Share Data
Beyond the charts, we're also providing our readers with access to several other metrics for the preferred shares.
After testing out a series on preferred shares, we decided to try merging it into the series on common shares. After all, we are still talking about positions in mortgage REITs. We don't have any desire to cover preferred shares without cumulative dividends, so any preferred shares you see in our column will have cumulative dividends. You can verify that by using Quantum Online. We've included the links in the table below.
To better organize the table, we needed to abbreviate column names as follows:
- Price = Recent Share Price - Shown in Charts.
- S-Yield = Stripped Yield - Shown in Charts.
- Coupon = Initial Fixed-Rate Coupon.
- FYoP = Floating Yield on Price - Shown in Charts.
- NCD = Next Call Date (the soonest shares could be called).
- Note: For all FTF issues, the floating rate would start on NCD.
- WCC = Worst Cash to Call (lowest net cash return possible from a call).
- QO Link = Link to Quantum Online Page.
Ticker | Price | S-Yield | Coupon | FYoP | NCD | WCC | QO Link | P-Link |
$23.81 | 7.60% | 5.00% | 7.60% | 3/9/2024 | $1.33 | |||
$25.49 | 7.73% | 8.00% | 7.73% | 8/1/2025 | $2.52 | |||
$22.72 | 7.38% | 4.88% | 7.38% | 3/9/2024 | $2.41 | |||
$24.11 | 7.97% | 5.75% | 7.97% | 3/9/2024 | $1.05 | |||
$23.82 | 8.67% | 6.20% | 8.67% | 3/9/2024 | $1.35 |
Second batch:
Ticker | Price | S-Yield | Coupon | FYoP | NCD | WCC | QO Link | P-Link |
$25.52 | 10.56% | 10.56% | 10.56% | 3/9/2024 | -$0.01 | |||
$25.26 | 9.83% | 9.74% | 9.83% | 3/9/2024 | $0.21 | |||
$25.04 | 6.83% | 6.75% | 10.68% | 6/30/2024 | $0.81 | |||
$19.35 | 8.48% | 6.50% | 8.48% | 6/10/2026 | $9.50 | |||
$24.20 | 7.19% | 6.90% | 11.49% | 4/15/2025 | $2.96 | |||
$25.60 | 10.65% | 10.78% | 10.56% | 3/9/2024 | -$0.18 | |||
$24.48 | 7.08% | 6.88% | 10.20% | 4/15/2024 | $0.96 | |||
$24.33 | 6.73% | 6.50% | 10.94% | 10/15/2024 | $1.90 | |||
$23.10 | 6.68% | 6.13% | 11.20% | 4/15/2025 | $3.83 | |||
$23.13 | 8.46% | 7.75% | 9.28% | 10/15/2027 | $9.15 | |||
$21.20 | 8.31% | 7.00% | 8.31% | 1/28/2025 | $5.56 | |||
$20.91 | 9.06% | 7.50% | 9.06% | 3/9/2024 | $4.37 | |||
$23.90 | 7.12% | 6.75% | 11.36% | 10/30/2024 | $2.38 | |||
$20.80 | 7.58% | 6.25% | 11.04% | 1/30/2027 | $8.91 | |||
$23.94 | 9.10% | 8.63% | 9.76% | 4/30/2028 | $10.25 | |||
$21.05 | 8.41% | 7.00% | 8.41% | 3/9/2024 | $4.20 | |||
$24.90 | 8.38% | 8.25% | 11.41% | 3/30/2024 | $0.51 | |||
$24.21 | 7.79% | 7.50% | 11.81% | 8/15/2024 | $1.75 | |||
$23.90 | 7.49% | 7.13% | 11.79% | 08/15/2024 | $2.01 | |||
$21.71 | 7.38% | 6.38% | 12.20% | 02/15/2025 | $4.91 | |||
$22.47 | 7.83% | 7.00% | 11.57% | 11/15/2026 | $7.36 | |||
$23.39 | 8.83% | 8.13% | 12.40% | 3/15/2024 | $2.12 | |||
$23.25 | 8.75% | 8.00% | 12.64% | 6/15/2024 | $2.76 | |||
$19.67 | 8.72% | 6.75% | 8.72% | 8/24/2026 | $9.88 |
Third batch:
Ticker | Price | S-Yield | Coupon | FYoP | NCD | WCC | QO Link | P-Link |
$22.59 | 8.07% | 7.25% | 11.78% | 1/27/2025 | $4.22 | |||
$22.81 | 8.97% | 8.13% | 12.39% | 4/27/2027 | $8.79 | |||
$22.36 | 8.58% | 7.63% | 12.29% | 7/27/2027 | $9.30 | |||
$20.94 | 9.11% | 7.50% | 9.11% | 3/9/2024 | $4.43 | |||
$21.36 | 7.72% | 6.50% | 12.97% | 3/31/2025 | $5.68 | |||
$21.69 | 9.36% | 8.00% | 9.36% | 3/9/2024 | $3.70 | |||
$23.95 | 8.46% | 8.00% | 12.02% | 3/30/2024 | $1.56 | |||
$23.57 | 8.60% | 8.00% | 11.77% | 3/30/2024 | $1.94 | |||
$20.42 | 9.63% | 7.75% | 12.82% | 9/30/2025 | $7.99 | |||
$23.53 | 8.36% | 7.75% | 11.60% | 12/27/2024 | $3.42 | |||
$22.70 | 8.39% | 7.50% | 12.14% | 9/27/2027 | $9.35 | |||
$22.62 | 8.79% | 7.88% | 13.40% | 1/15/2025 | $4.36 | |||
$19.01 | 9.14% | 6.88% | 15.20% | 10/15/2026 | $10.72 | |||
$21.45 | 9.43% | 8.00% | 13.27% | 10/15/2027 | $11.06 | |||
$17.78 | 9.96% | 7.00% | 9.96% | 1/15/2027 | $12.48 | |||
$17.59 | 10.07% | 7.00% | 16.02% | 11/30/2026 | $12.44 | |||
$22.97 | 9.02% | 8.20% | 9.02% | 3/9/2024 | $2.27 | |||
$24.06 | 8.66% | 8.25% | 11.76% | 4/15/2024 | $1.39 | |||
$19.72 | 10.68% | 8.25% | 10.68% | 3/9/2024 | $5.71 | |||
$19.12 | 10.68% | 8.00% | 10.68% | 3/9/2024 | $6.30 | |||
$23.30 | 8.73% | 8.00% | 13.15% | 9/17/2024 | $3.17 | |||
$23.85 | 9.13% | 8.63% | 12.18% | 7/30/2024 | $2.24 | |||
$21.49 | 9.26% | 7.88% | 9.26% | 5/21/2026 | $8.06 |
Strategy
Our goal is to maximize total returns. We achieve those most effectively by including "trading" strategies. We regularly trade positions in the mortgage REIT common shares and business development companies ("BDCs") because:
- Prices are inefficient.
- Long-term, share prices generally revolve around book value.
- Short-term, price-to-book ratios can deviate materially.
- Book value isn't the only step in analysis, but it is the cornerstone.
We also allocate to preferred shares and equity REITs. We encourage buy-and-hold investors to consider using more preferred shares and equity REITs.
All of our trades are shared with subscribers in real time along with articles highlighting the top opportunities in the sector before we purchase them.
Take a 2-week free trial on us.