SHansche
Introduction
FLEX LNG (NYSE:FLNG) is an enticing investing idea for shipping investors. The company operates in the LNG shipping industry. It has a young fleet equipped with new-generation propulsion plants. FLNG has leveraged its capital structure due to its intensive capital investments over the last few years. Having new ships with efficient propulsion pays off, and FLNG scores the highest margins against its peers.
LNG carrier's supply side seems to be oversaturated. The order book is 51%. However, we have to look into the details. Compared to tankers and bulkers, LNG carriers have higher safety and efficiency requirements. So, LNG ship power plants must meet higher standards. Older ships with obsolete power plants will be pushed out of the market, reducing the LNG carriers' supply. On the other hand, the demand for LNG transport seems stable due to the Panama Canal drought, the Red Sea crisis, and the growing LNG supply.
LNG market overview
The LNG shipping market is another esoteric niche in the shipping industry. There are only a handful of companies that are publicly traded. The largest LNG shipowner is Nakilat, a Qatari shipping company, owning 24 conventional carriers (145,000 – 170,000 cbm), 31 Q-Flex (210,000 – 217,000 cbm), and 14 Q-max vessels (263,000 – 266,000 cbm).
Apart from Nakilat, a few publicly traded enterprises are involved in LNG transportation. FLNG, Cool Company (CLCO), and Dynagas LNG (DLNG) are some of the companies in the segment. Awilco LNG is a Norwegian company that owns two LNG carriers. Shipping companies operating in other segments, like Tsakos (TNP), which is focused on tankers, and Exmar (EMRF), owning LPG carriers, have a few LNGs. Capital Product Partners (CPLP) is another mixed company with 7 LNG carriers and 14 container vessels. It is worth mentioning Golar LNG (GLNG). GLNG is a company in its league. It owns the largest FLNG (floating LNG) capacity and is the only provider of FLNG as a service. For objective comparison with FLNG, I pick CLCO and DLNG. The other companies involved in the industry are not pure-play LNG shipowners.
Knowing the landscape of LNG shipping moves us to the next step, discussing supply and demand. In shipping, the supply side is defined by the current order book and average ship age. Crude oil, product tankers, and offshore supply vessels have a record low order book. On the side of the scale are containers, car carriers, LPG, and LNG ships.
The chart below shows the order book by type of ship.
Clarksons
LNG order book is at 51%. It significantly exceeds the second and third in the list, containers and car carriers.
Now, let’s dig deeper into the details. The following chart is from the FLNG presentation. It shows the future deliveries and orders by year and by propulsion type.
FLNG 4Q23 presentation 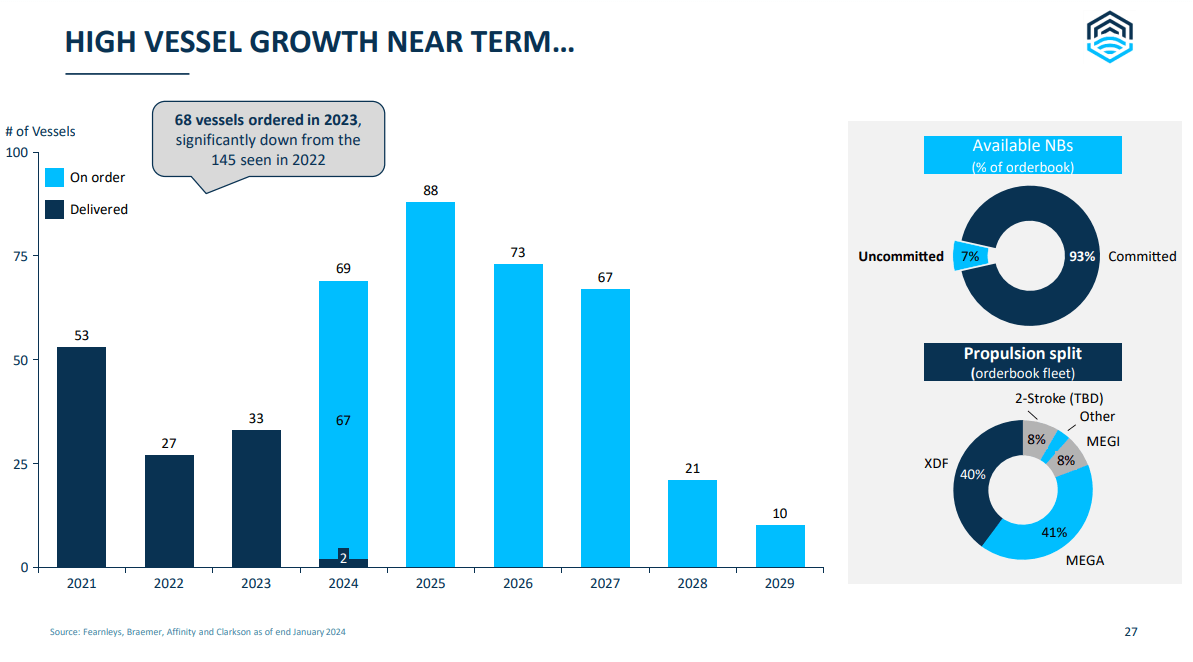
In 2024, two LNGs were already delivered, while 67 are expected to be delivered. It is worth mentioning the propulsion split. Unlike conventional cargo ships like bulkers and tankers that rely on classic propulsion configuration and two-stroke marine diesel engines, LNGs use sophisticated propulsion plants. They share some similarities with passenger ship plants like diesel-electric installations.
In two paragraphs, I will dissect the cryptic names in the pie chart. Until early 2000, steam turbines were the only viable solution to propel LNG ships. Between 2002 and 2012, Dual Fuel Diesel Electric (DFDE) propulsion plants gained traction. They are very similar to cruise ship installation – a few four-stroke diesel engines coupled with alternators generate electricity for electric motors that drive the ship's propeller. They can run on HFO, MGO, or BOG. That’s why sometimes they are referred to as TFDE. BOG means boiling of gas. It is the losses occurring during the storage of LNG. Due to the external heat, some slight evaporation occurs in the cargo, up to 0.10%-0.15% per day. BOG is reliquefied and used as a fuel for the main engines.
XDF and MEGI have become more prevalent in the last decade due to lower construction and maintenance costs. XDF means low-pressure dual-fuel diesel engine. It is a two-stroke engine that runs on BOG, HFO, and MGO. MEGI (mechanically operated, electronically controlled gas injection) is a more sophisticated version of XDF. The difference is in the injection pressure of BOG. MEGA engines are the newest modification of MEGI, representing 41% of the total orders. MEGA/MEGI engines emit 40% less Nitrogen oxide (NOx emissions) than the engines running on HFO. Greenhouse emissions are also lower (by 22%) compared to HFO power plants.
Being familiar with the propulsion types helps us evaluate the quality of companies’ fleets. Similar to scrubbers-equipped ships, vessels with MEGI/MEGA engines are more favorable than the DFDE or steam turbine power plants. This leads us to the following chart.
FLNG 4Q23 presentation 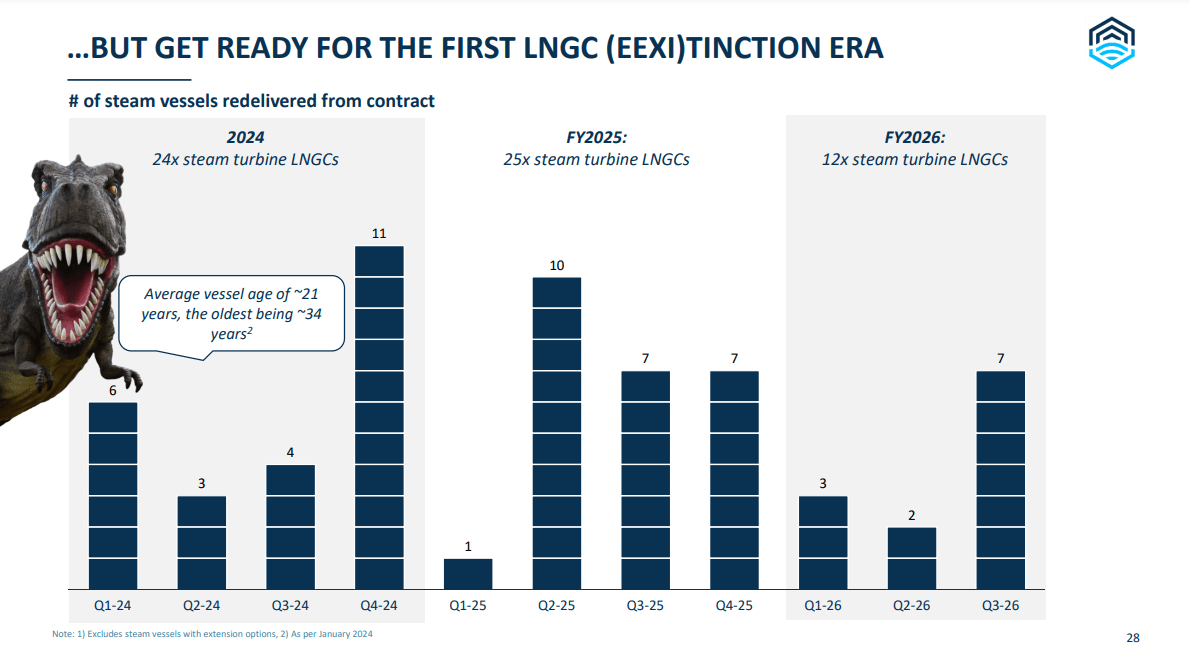
EEXI means Energy Efficiency Existing Ship Index. It measures ships' power plant efficiency. Steam turbines are among the most inefficient power plants despite their advantages, like simple design. LNG carriers with steam turbines can’t meet EEXI requirements and have been redelivered from contracts.
At the end of 2023, there were 709 LNGs globally and around 370 in the order book. As seen above, 61 vessels will be redelivered in the next three years, or 8.6% of the existing fleet. I assume this trend will accelerate, and steam turbine LNG will become an extinct species. Those ships have to be replaced because the LNG demand is growing globally.
The following graph shows the major LNG exporters and importers.
FLNG 4Q23 presentation 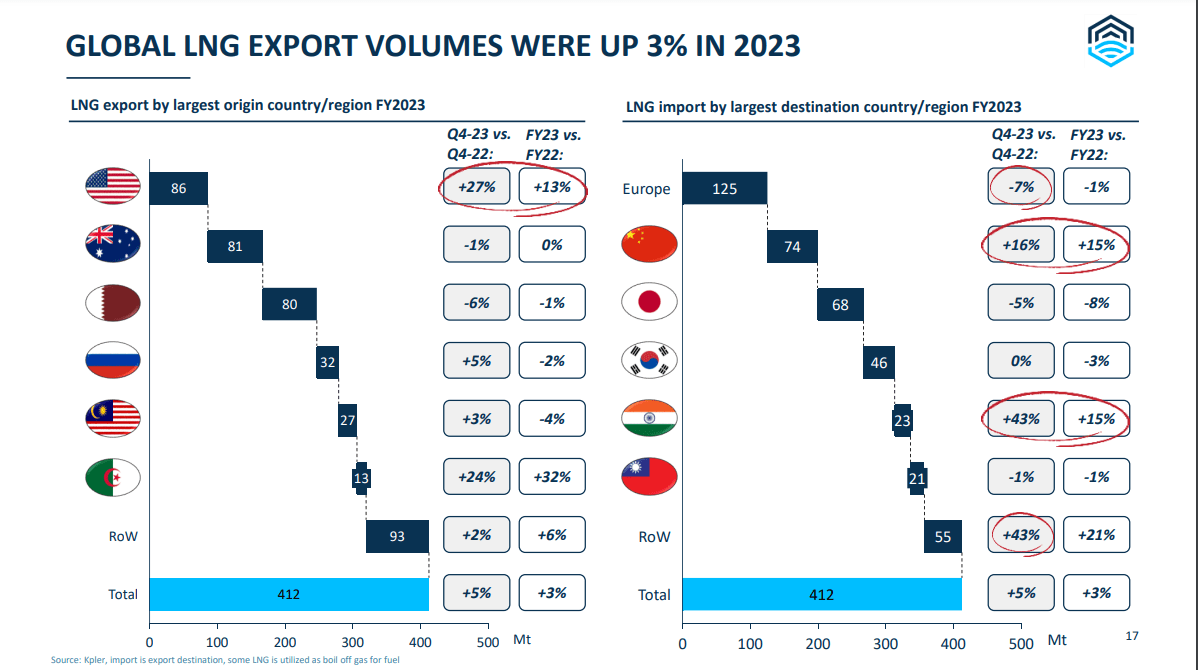
The chart above shows that the US holds a pole position in LNG exports. Australia holds second place despite LNG plants workers' strikes in 2023. On the other hand, the leading importers of LNG are Europe and China. Chinese imports grew 16% YoY, while European declined 7% YoY. India scored the most significant annual growth, 43% 4Q22 vs 4Q23.
The spot rate seasonality is strong, as seen in the chart below.
FLNG 4Q23 presentation 
The LNG carriers are affected, too, by the Panama Canal drought and the Red Sea crisis. The map below from EIA/gCaptain shows the location of all US LNG export terminals.
EIA/gCaptain
All of them are located southeast. US LNG exports to Asia now have to revert via Magellan Straight or Cape of Good Hope, extending the voyage at least by 30%, depending on the delivery destination.
The White House has paused the issuance of permits for new LNG terminals. The Department of Energy must update its assessment of the environmental impact of such projects. All key LNG projects in the US are frozen due to the White House decision. If the moratorium on new projects persists, it will achieve the opposite; more coal and crude oil will be needed globally to offset the declining US LNG exports. Simply put, more carbon emissions will be emitted.
Last but not least, the global LNG supply will grow considerably in the coming few years. The present liquefaction capacity is 468 MTPA. In 2027, it is expected to reach 626 MTPA—a 34% growth for three years.
Despite the record high order book for LNG carriers, I see potential due to the relatively small number of ships with new propulsion plants. Adding the Panama Canal issues and growing demand in Asia, the LNGs will remain an attractive proposal for shipping investors. After the brief primer on the LNG industry, let’s analyze the FLNG fleet and financials.
Company Overview
FLNG has 13 vessels at an average age of 4.5 years. All have 173,400 – 174,000 cbm capacity. The table below shows more details on the FLNG fleet.
FLNG website
69% of the ships are equipped with MEGI, while 31% with XDF. FLNG has the most modern fleet compared to CLCO and DLNG. DLNG owns six vessels at an average age of 13.3 years, three equipped with steam turbines and three with TFDE. CLCO falls in the middle with nine TFDF vessels and two MAGI vessels. TFDF, as discussed above, is a relatively obsolete option, compared to XDF, MEGI, and MAGI alternatives. Nevertheless, CLCO already owns two MAGI-equipped ships, and two more will be delivered in 2024. Its fleet average age is 8.4 years.
Unlike tankers and bulkers, LNGs are mainly employed under long-term time charters. The table below represents FLNG contract coverage until 2030.
FLNG 4Q23 presentation 
For the next two years, 69% of the fleet will be contacted at a fixed rate. Three ships, Rainbow, Vigilant, and Endeavour, are employed at least in 2030. The total charter backlog is 50 years. Considering the extension options, it may grow up to 71 years.
On February 7, FLNG released its 4Q23 results. The table below shows operational highlights for 4Q23.
FLNG 4Q23 presentation 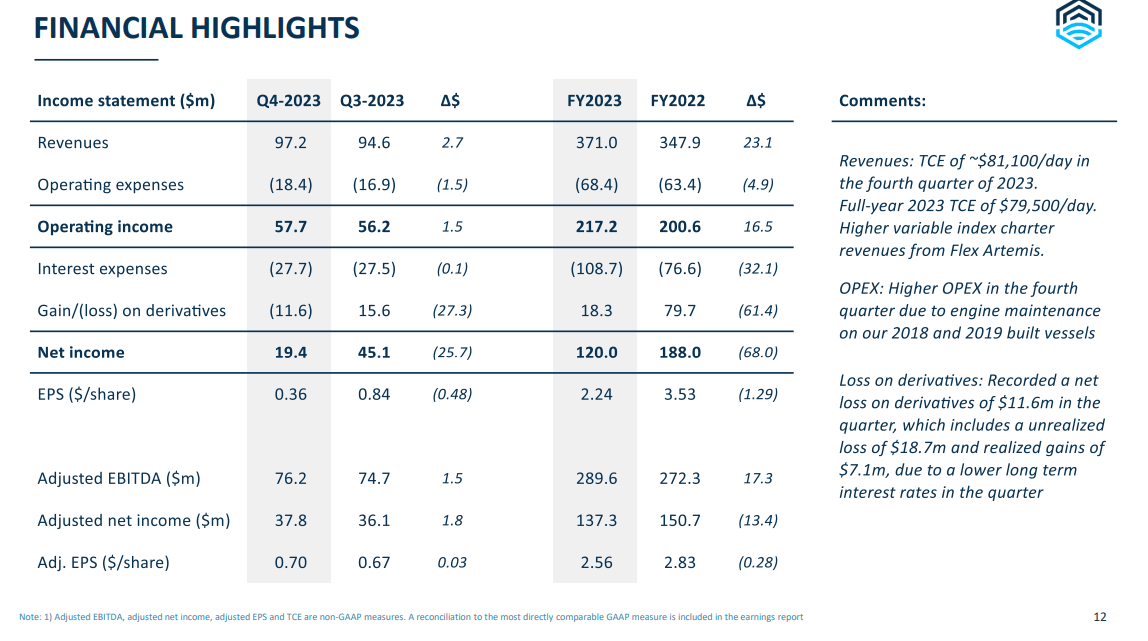
TCE rates in 4Q23 reached $81,100/day, $1,900 higher than 3Q23. The OPEX increased by $1,200 QoQ, reaching $15,400/day. 4Q23 revenue grew by 2.8% YoY, from $94.6 million in 4Q22 to $97.2 million in 4Q23. Operating expenses in 4Q23 increased by 8.8% due to engine maintenance on five company vessels (2018-2019 builds). Operating income reached $57.7 million in 4Q23, a 2.6% YoY change. Interest expenses remained the same YoY. However, FLNG recorded $11.6 million in losses on its derivatives portfolio. Those losses resulted in declining net income. YoY, the net income dropped from $45.1 million to $19.4 million.
FY 2023, revenue grew with the rising TCE rates, reaching $371 million. Operating expenses increased by 7.7%, so operating income FY23 is up 8.2%. In 2022, FLNG gained $79.7 million from derivatives. FY23 derivatives gains/losses are $18.3 million. Despite the higher operating income, the derivative's contracting gains adversely impacted FY23 net income. It declined by 36% compared to 2022.
FLNG financials
Having a new fleet with top-notch propulsion comes at a price. FLNG has increased its leverage over the last few years.
Koyfin
FLNG's total debt is $1.812 billion, including $911 million in lease agreements and $901 million in long-term debt (including a revolving credit facility). Total debt to equity is 213%, and total liabilities to total assets is 68.7%. Despite the leveraged capital structure, FLNG has adequate liquidity. The company delivered $175 million LTM operating cash flow and $217 million LTM operating income, while LTM net interest expenses were $85.6 million.
The chart below shows the FLNG debt amortization schedule.
FLNG 4Q23 presentation 
No debt maturities are due before 2028. In 2028, the company must pay $353 million in debt, while in 2029, it will be $289 million in debt. FLNG has access to $400 million provided by a revolving credit facility. The debt has interest rates at SOFR plus a premium in the 1.03% - 4.11% range.
The chart below compares FLNG, CLCO, and DLNG solvency and liquidity metrics. All figures are LTM.
Koyfin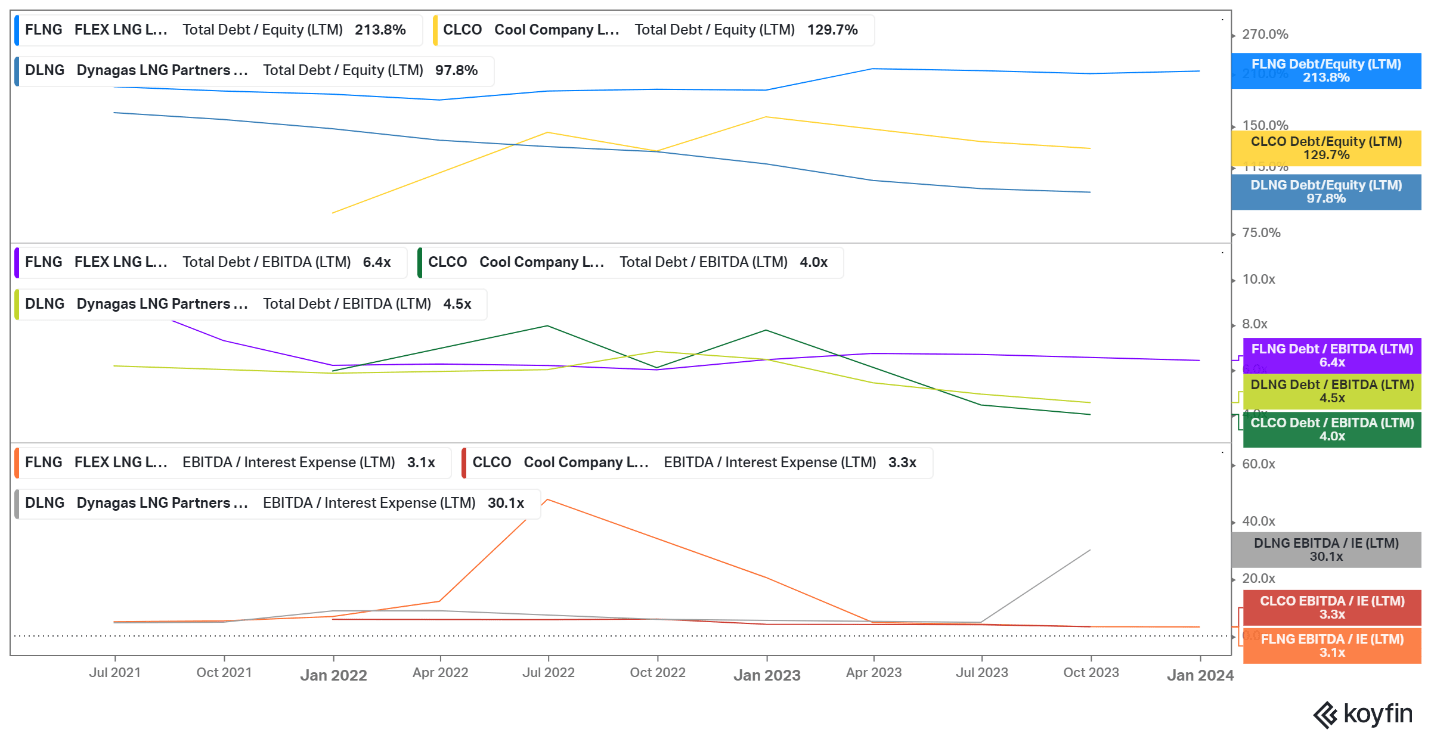
FLNG is the most indebted group. However, we have to consider its fleet quality. DLNG might have the best total debt/equity and EBITDA/Interest expense ratio, although it has old ships with steam turbines and TFDE. CLCO falls in the middle with its relatively younger fleet and not so obsolete propulsion plants.
Koyfin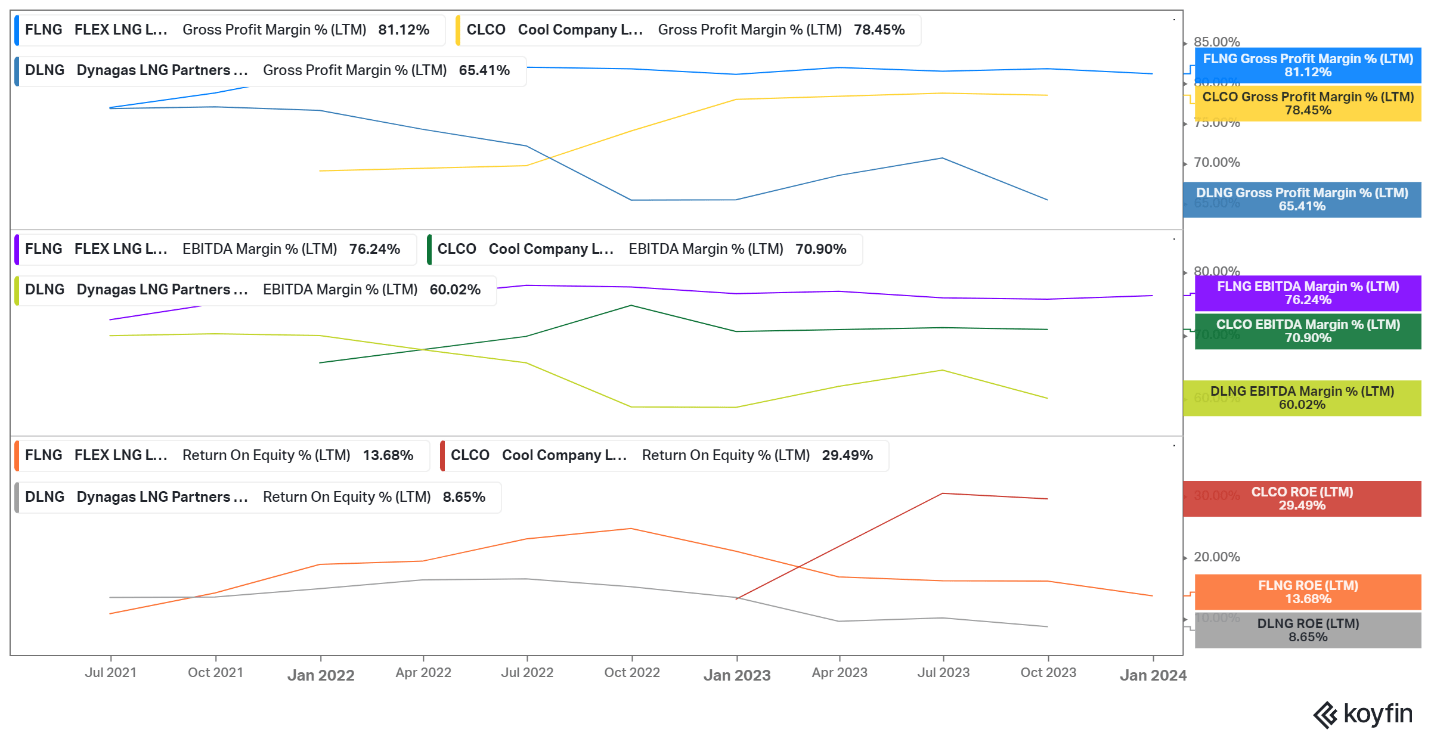
Having a new fleet pays off, as seen in the chart above. FLNG has the highest margins in the group, with an 81.1% gross margin and a 76.2% EBITDA margin. CLCO's Return on Equity is 29.5%, the highest in the group. The underdog is DLNG due to the reasons discussed above.
FLNG pays dividends with an attractive TTM yield of 11.58%.
FLNG 4Q23 presentation 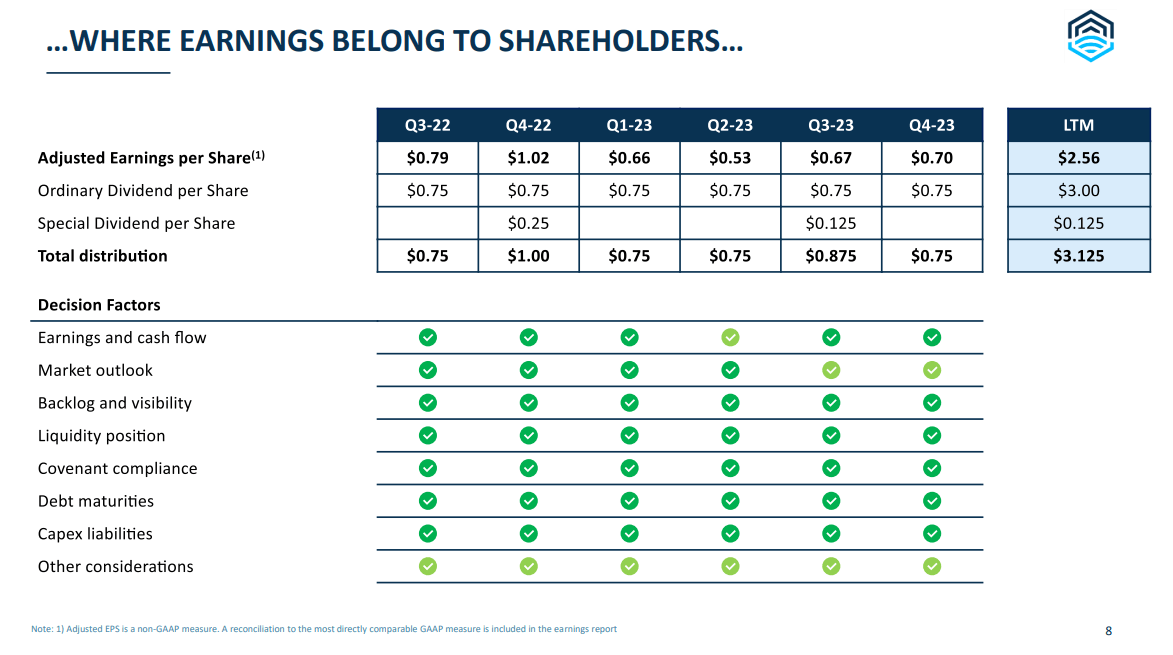
In 3Q23, the company paid a $0.75 ordinary dividend and a $0.125 special dividend. For 4Q23, FLNG will distribute only an ordinary dividend of $0.75. DLNG does not pay any dividends on its common shares. It distributes cash on its preferred units Series A and B. CLCO distributes dividends with a respectable TTM yield of 11.8%.
Valuation
To calculate FLNG NAV, I use the company’s estimates for new-build prices shown in the 4Q23 presentation.
FLNG 4Q23 presentation 
Since FLNG’s fleet is 4.5 years old, I have to discount the price of new vessels. I use a discount factor of 5%.
The list below shows my price estimates:
- 4.5Y old LNG carrier with 173,000 cbm capacity $210 million
Inputs for the FLNG equation are:
- Fleet replacement value: $2,730 million
- Current assets: $443 million
- Total Liabilities: $1,860 million
Based on the above inputs, FLNG's Net Asset value is $1,313 million.
FLNG's market capitalization is $1,390 million, while its net asset value is $1,313 million. Hence, FLNG trades at 106% P/NAV. For reference, DLNG trades at 25% P/NAV and CLCO at 68%. Having new ships with top-grade propulsion comes at a price.
FLNG trades at 7.53 EV/Sales, 9.87 EV/EBITDA, and 1.64 P/BV.
Seeking Alpha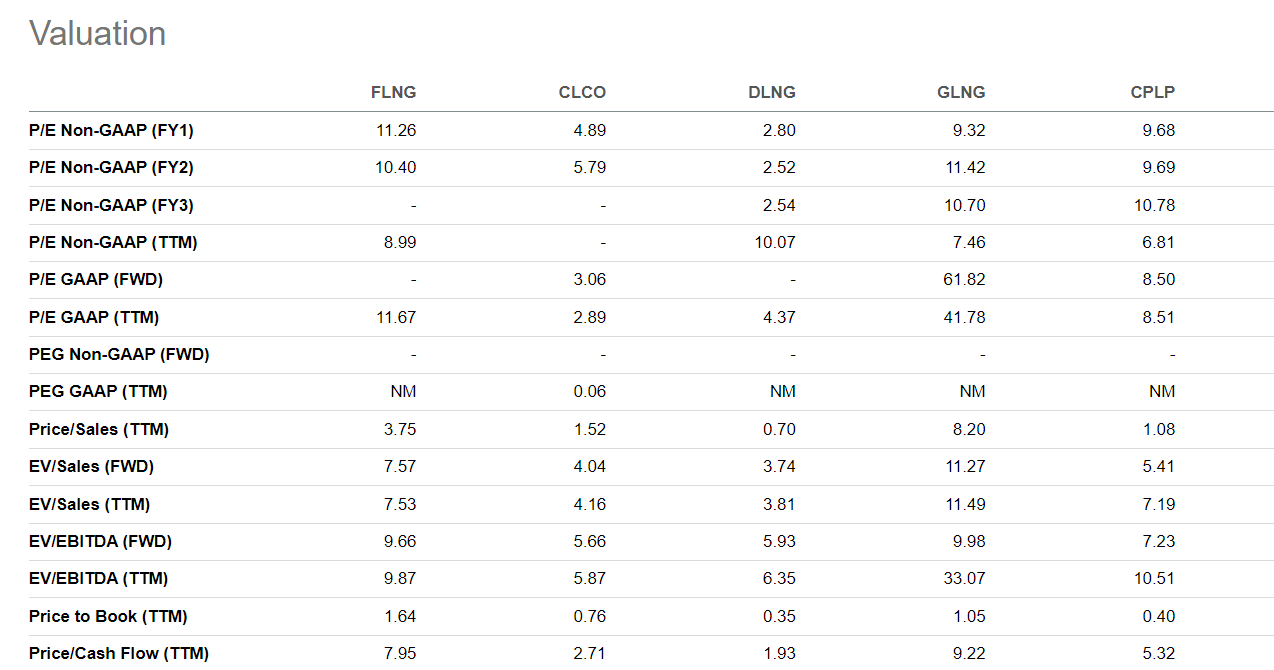
It is the most expensive stock compared to its direct competitors, CLCO and DLNG. However, the other two enterprises involved in the LNG industry, GLNG and CPLP, command higher EV/Sales and EV/EBITDA multiples. CPLP trades at 42% P/NAV. GLNG has two FLNGs (Hilli and Gimi) and two LNGs (Fuji and Artic). Fuji is planning to convert into FLNG, too. Golar's business model makes the company unique, making it almost impossible to pick direct competitors.
Investors Takeaway
FLNG has two inherent risks. The first is the higher leverage. The company maintains adequate liquidity, considering its interest expenses. Inflationary pressure may postpone again interest rate cuts, so debt servicing costs will remain elevated. FLNG owns a young fleet and is not pressed to renew it. So, the company can use the excess cash to reduce its debt burden. The other risk is for the Biden administration to expand the moratorium on LNG projects or even imply an actual LNG export ban. In my opinion, the second scenario is possible, although not so plausible. However, adding more constraints for new LNG projects will increase the uncertainty. Globally, LNG (along with uranium) is part of the clean energy transition.
The LNG market seems oversupplied, considering the record high order book. Going deeper, however, reveals a growth potential. Old vessels powered by steam turbines will become extinct. Ships equipped with MEGA/MEGI plants will be in high demand. On the other hand, regardless of the Biden administration's political decisions, LNG supply keeps rising on a global scale. FLNG is one of the best ways to play those dynamics. The company has a young fleet equipped with the last generation of power plants. The best fleet comes at a price; nevertheless, it has advantages. Because of its superior shipments, FLNG delivers the best margins compared to CLCO and DLNG.
The company trades at 106% P/NAV, which is the highest of its peer group. But let’s not forget that inflationary pressures push tangible asset values higher. FLNG, as all shipowners, will benefit from that. I give FLNG a buy rating.