Lemon_tm
Dear Fellow Shareholders,
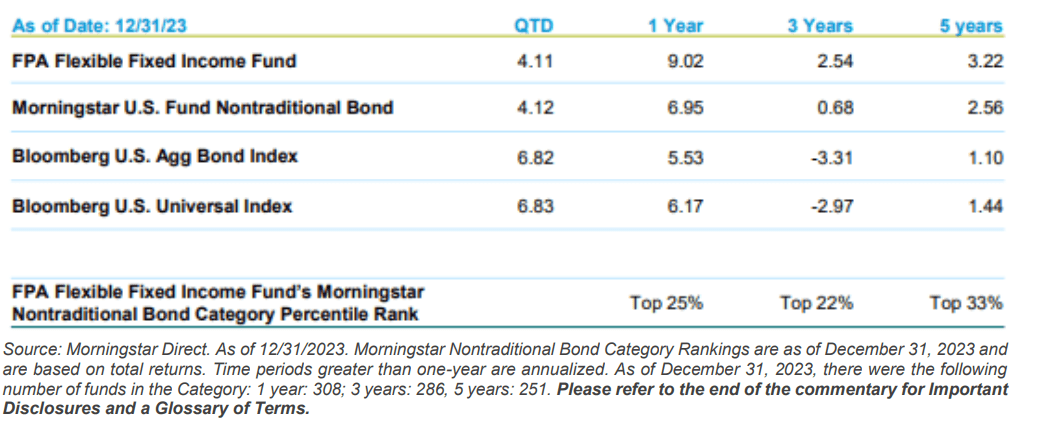
FPA Flexible Fixed Income Fund (the “Fund”) returned 4.11% in the fourth quarter of 2023 and 9.02% for the year ended December 31, 2023.
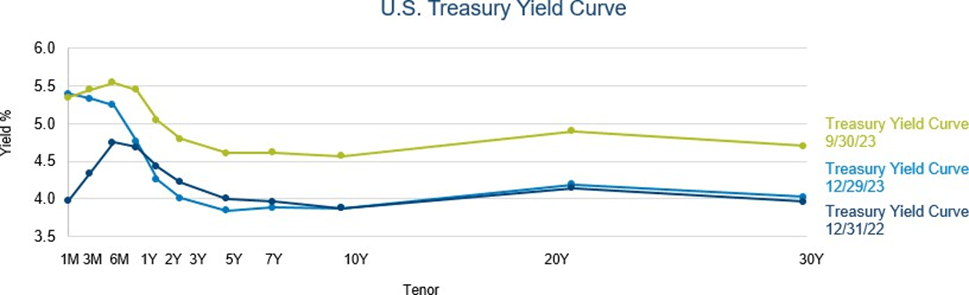
With inflation progressing towards the Federal Reserve’s 2% inflation objective, the Federal Reserve held the Fed Funds rate constant throughout the fourth quarter. The Federal Reserve also noted that discussions about Fed Funds rate cuts had begun.4 In response to macroeconomic data and the Federal Reserve’s commentary, one- to 30-year maturity Treasury yields declined in the fourth quarter. Although Treasury yields increased during most of 2023, the decrease in the fourth quarter resulted in two- to seven-year maturity Treasury yields ending the year lower. Additionally, spreads declined across most sectors of the bond market during the quarter and, in general, prices of riskier assets increased. We do not generally view “Credit” (investments rated BBB or lower, including non-rated investments) as attractively priced, but we continue to search and will seek to opportunistically invest in Credit when we believe that prices adequately compensate for the risk of permanent impairment of capital and near-term mark-to-market risk.
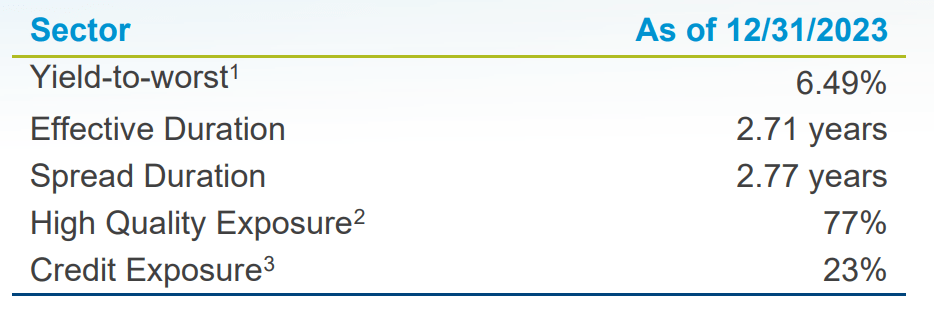
Notwithstanding lower risk-free rates and spreads, on an absolute basis we still see an attractive opportunity to buy longer duration, “High Quality” bonds (rated single-A or higher), which we believe will enhance the Fund’s long-term returns and the Fund’s short-term upside versus downside return profile. The Fund’s Credit exposure was 23.4% on December 31, 2023 versus 26.6% on September 30, 2023. Cash and equivalents represented 6.6% of the portfolio on December 31, 2023, versus 5.6% on September 30, 2023.
Portfolio Attribution5
Fourth Quarter 2023
The Fund’s corporate holdings – including bonds, loans and common stock – were the largest contributor to performance during the quarter. The majority of the corporate holdings’ return came from corporate bonds due mostly to higher prices as a result of lower risk-free rates and spreads. To a lesser extent, corporate loans contributed to performance, largely due to coupon payments. The common stock holdings represented 0.2% of the portfolio, on average, during the quarter and also contributed to returns.6
The second-largest contributor to performance were collateralized loan obligations (CLOs) backed by corporate loans due to a combination of income from coupon payments and higher prices due to lower spreads.
The third-largest contributor to performance during the quarter were asset-backed securities (ABS) backed by equipment, due mostly to higher prices as a result of lower risk-free rates.
Although some individual bonds detracted from performance during the quarter, there were no meaningful detractors at the sector level.
Calendar Year 2023
The Fund’s corporate holdings – including bonds, loans and common stock – were the largest contributor to performance in 2023. The majority of the corporate holdings’ return came from corporate bonds due to a combination of coupon payments and higher prices driven by lower risk-free rates and spreads. Corporate loans were a meaningful contributor as well, mostly due to coupon payments with some additional benefit from higher prices. The common stock holdings represented 0.2% of the portfolio, on average, during the year and also contributed to returns.6
The second-largest contributor to performance were CLOs backed by corporate loans, mostly due to income from coupon payments with some additional benefit from higher prices as a result of lower spreads. Most of the Fund’s CLOs are floating rate, which has been beneficial to returns as their coupons increased alongside increases in the Fed Funds rate.
The third-largest contributor to performance were ABS backed by equipment, due to a combination of income from coupon payments and higher prices caused by lower risk-free rates.
Although there were individual bonds that detracted from performance during the year, there were no meaningful detractors at the sector level.
Portfolio Activity7
The table below shows the portfolio’s sector-level exposures at December 31, 2023, compared to September 30, 2023, and December 31, 2022:
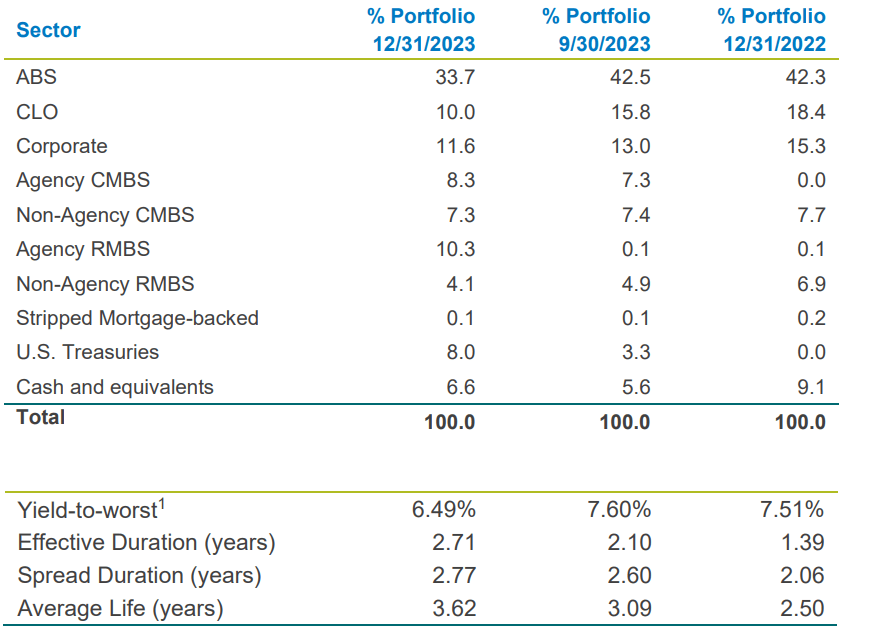
As yields have increased over the past two years, we have taken advantage of this situation to buy longer duration bonds. Notwithstanding a meaningful decrease in yields in the last two months of 2023, we still believe longer duration bonds not only offer an attractive long-term return but also improve the short-term return profile of the portfolio. The duration of these investments is guided by our duration test, which seeks to identify the longest-duration bonds that we expect will produce at least a breakeven return over a 12- month period, assuming a bond’s yield will increase by 100 bps during that period. Consistent with this test, during the fourth quarter, we bought: agency-guaranteed residential mortgage pools; Treasuries; agency- guaranteed commercial mortgage-backed securities (CMBS); AAA-rated non-agency CMBS; AAA-rated utility cost recovery or rate reduction bonds; AAA-rated ABS backed by equipment; AAA-rated ABS backed by prime quality auto loans; and AAA-rated ABS backed by prime quality credit card receivables. On average, these investments had a duration of 4.7 years. We also bought a AAA-rated floating rate CLO.
Within Credit, we bought a BBB-rated corporate bond and added to existing high-yield bond and bank loan investments.
To fund these investments, we used a combination of proceeds from maturing investments and sales of existing short-duration holdings, including High Quality ABS, CLOs (both corporate loan-backed CLOs and commercial real estate-backed CLOs), non-agency CMBS, and agency residential mortgage-backed securities (RMBS) with an average duration of less than a half year. We also sold Treasuries to buy other similar- or longer-duration bonds. Lastly, we sold a short maturity BBB-rated corporate bond to take advantage of other, more attractive opportunities.
Market Commentary
As shown in the following chart, inflation has continued its downward trajectory, moving closer toward the Federal Reserve’s 2% target:
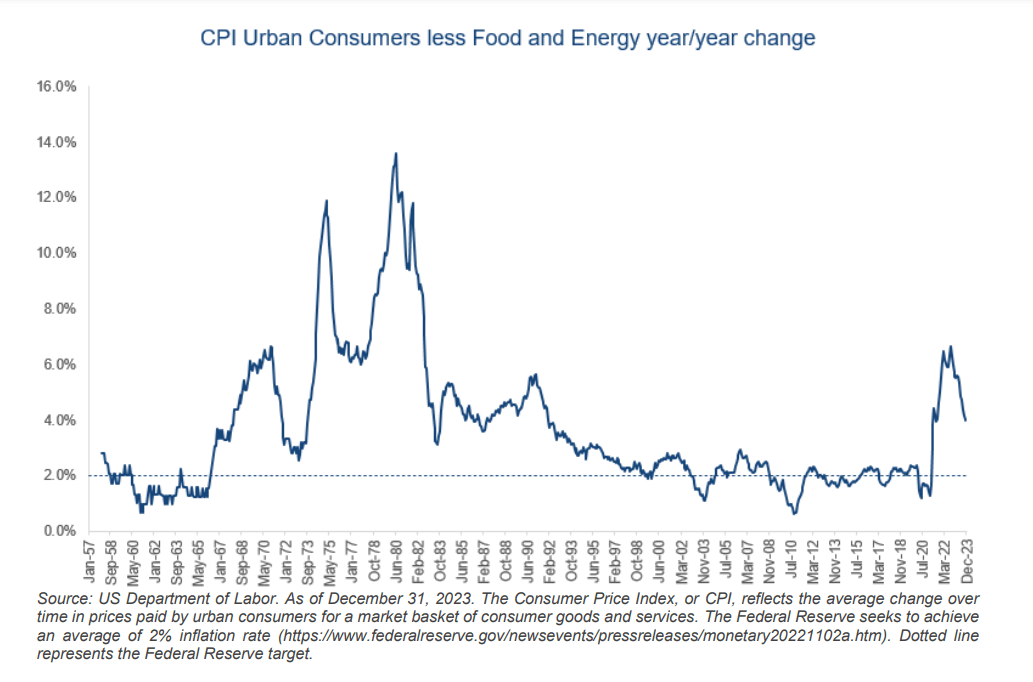
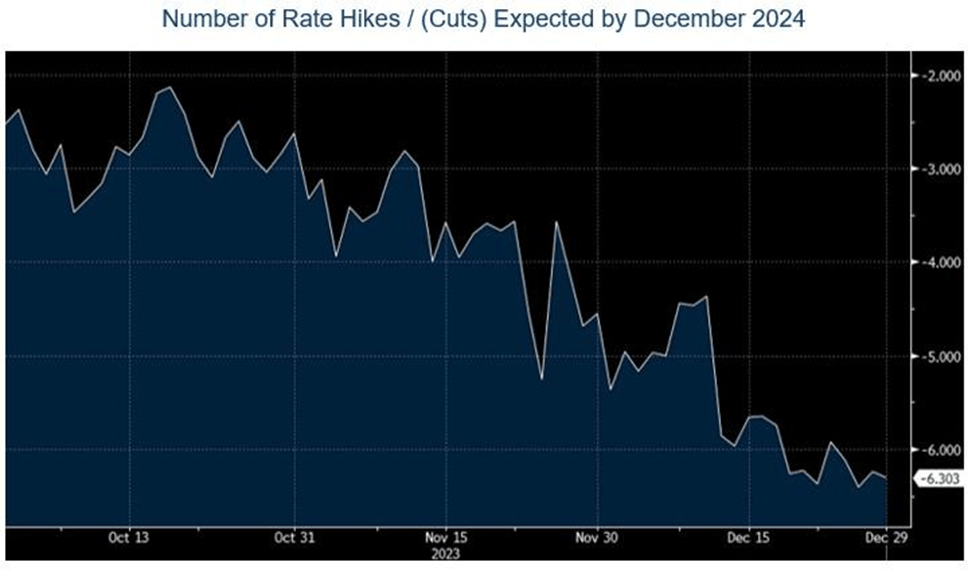
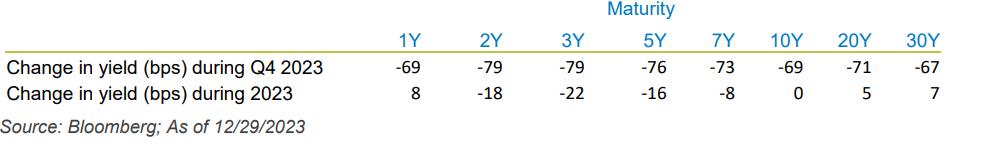
Because inflation is already at or near the 2% objective by some measures, the Federal Reserve held the Fed Funds rate steady in the fourth quarter and in December 2023 disclosed that conversations about cutting interest rates had begun. These comments, combined with inflation reports and other macroeconomic data, drove a decline in Treasury yields, led by the expectation that the Federal Reserve would reduce rates more significantly in 2024 than had been previously expected. The first chart below shows the number of Fed Funds Rate cuts expected by the market increased from three to six in 2024. The second chart shows the change in Treasury yields during the fourth quarter and in the twelve months ended in December 31, 2023.
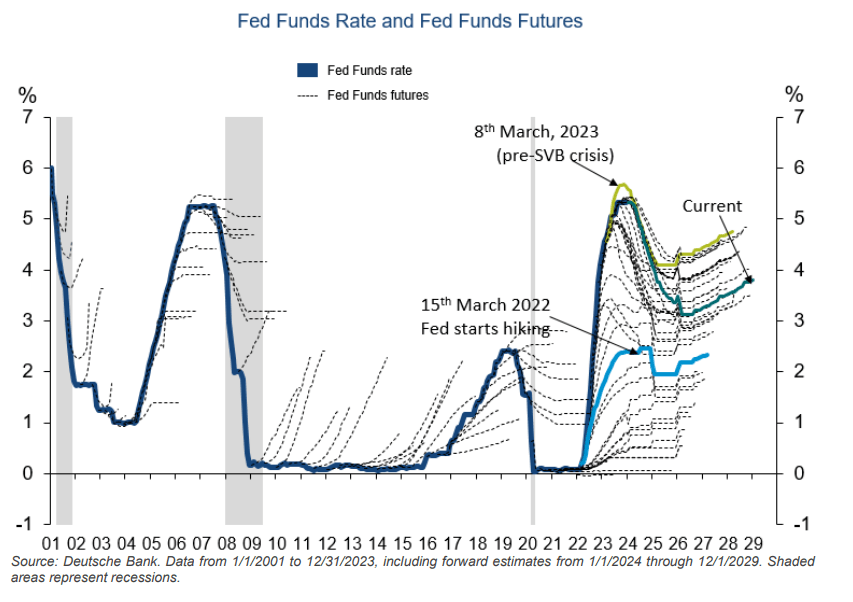
However, the market is not all-knowing, as evidenced by the following chart that plots the market’s expectations for the future path of the Fed Funds rate at any given point in time (dashed line) versus the actual path of the Fed Funds rate (solid line). What is clear is that rates rarely, if ever, end up where the market thinks they will. It is really difficult to predict the future – which is why we do not attempt to.
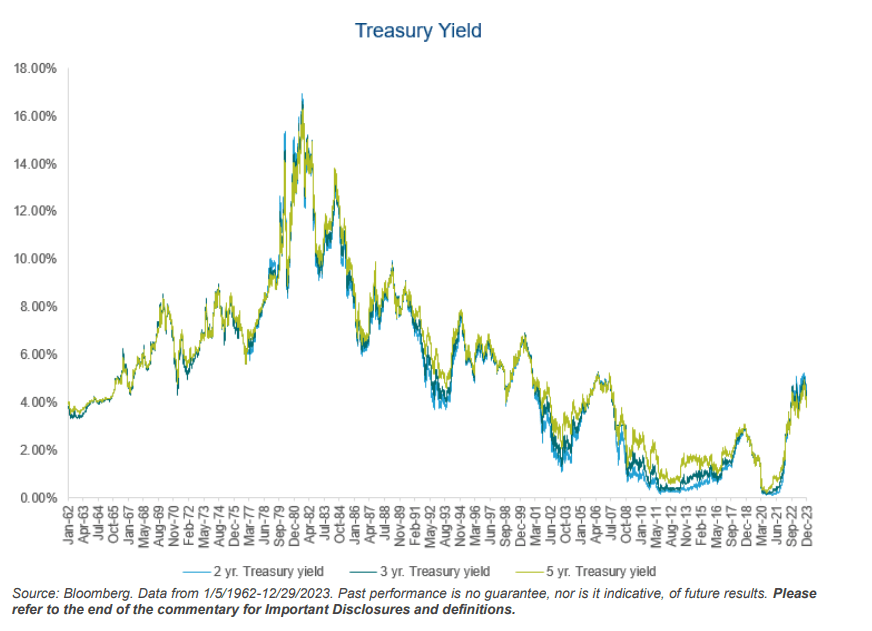
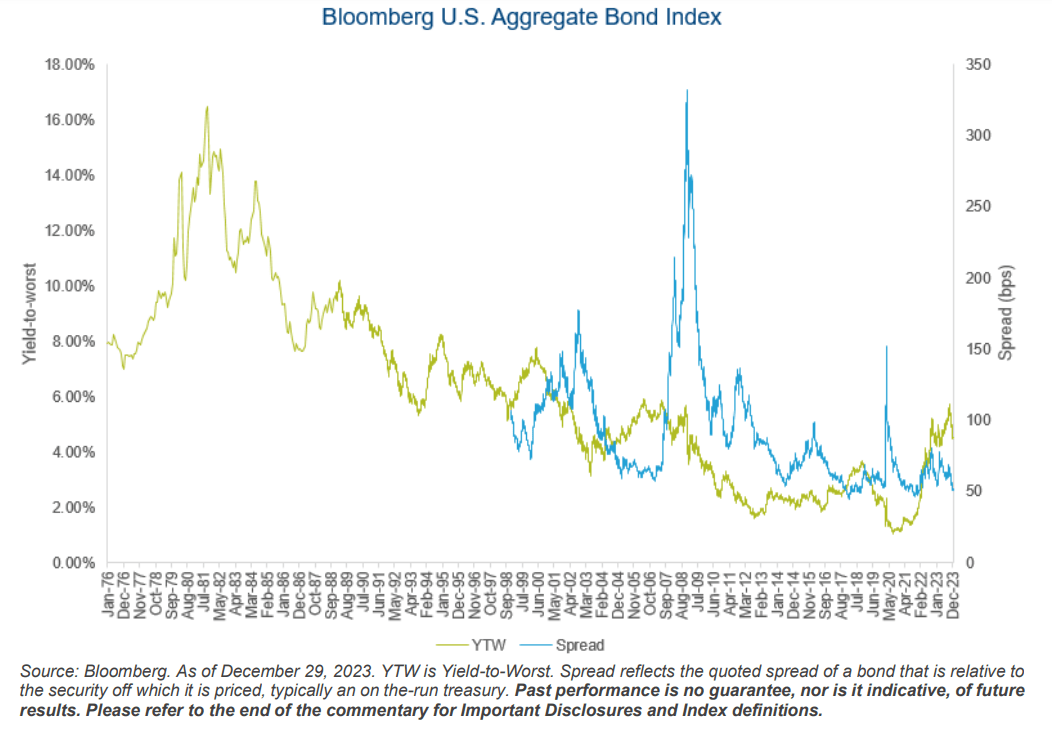
Notwithstanding the decline in yields in the fourth quarter, the following two charts show that Treasury yields and yields on High Quality bonds are still among the highest in 15 years.
As we have described in past commentaries, higher yields over the past couple of years have created what we believe is an attractive opportunity to buy longer-duration, high-quality bonds rated single-A or higher. We believe our investors will be better off in the long term, earning today’s yields for multiple years. Therefore, we want to lock in today’s yields for as long as possible. However, the future is uncertain, so we also want to be thoughtful about limiting the short-term mark-to-market risk associated with increases in interest rates.
To help strike the balance between locking in yields for as long as possible and providing some short-term price-related downside protection, we select the duration of our investments by looking for bonds that have adequate yield to compensate for their duration. Specifically, we try to buy the longest bonds that we expect will produce at least a breakeven return over twelve months if we assume that a bond’s yield will increase by 100 bps over those twelve months. The chart below illustrates our 100 bps duration test.
Source: Bloomberg. ^ Yield-to-maturity is the annualized total return anticipated on a bond if the bond is held until it matures and assumes all payments are made as scheduled and are reinvested at the same rate. The expected return assumes no change in interest rates over the next 12 months. * Upside return estimates the 12-month total return assuming yields decline by 100 bps over 12 months. Downside return estimates the 12-month total return assuming yields increase by 100 bps over 12 months. Return estimates assume gradual change in yield over 12 months. The hypothetical stress test data provided herein is for illustrative and informational purposes only and is intended to demonstrate the mathematical impact of a change in Treasury yields on hypothetical Treasury returns. No representation is being made that any account, product or strategy will or is likely to achieve profits, losses, or results similar to those shown. Hypothetical results do not reflect trading in actual accounts, and does not reflect the impact that all economic, market or other factors may have on the management of the account. Hypothetical results have certain inherent limitations. There are frequently sharp differences between simulated results and the actual results subsequently achieved by any particular account, product or strategy. Past performance is no guarantee, nor is it indicative, of future results. Please refer to the back of the commentary for important disclosures.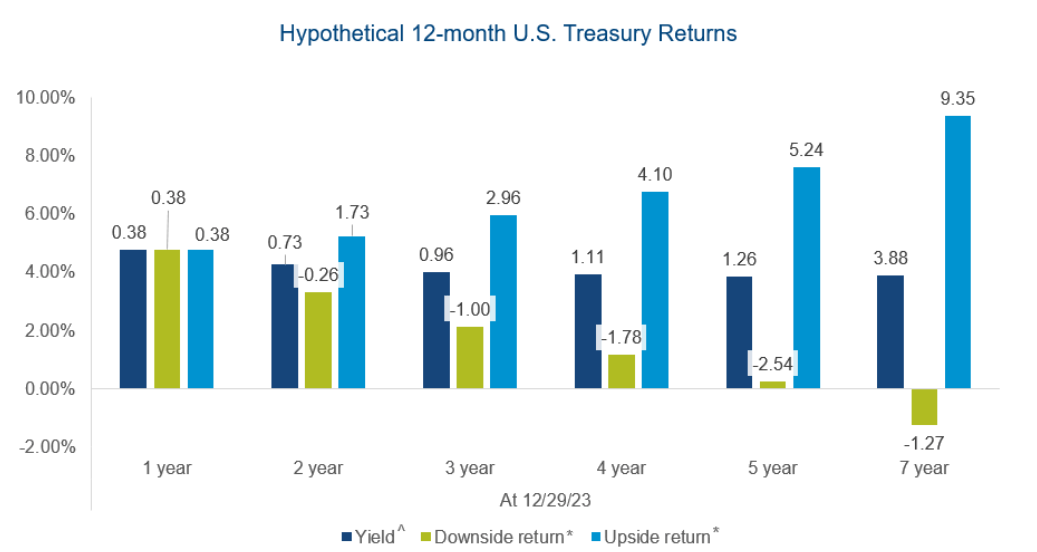
The dark blue bars above represent Treasury yields of various maturities at December 31, 2023. The green bars show the results of our 100 bps duration test. For example, the 5-year Treasury purchased at a 3.85% yield would be expected to return 0.25% over twelve months if its yield increased by 100 bps from 3.85% to 4.85% over those twelve months. A similar analysis applied to the 7-year Treasury would result in a total return loss of -1.27%. With a better-than-breakeven return, the 5-year Treasury would be a candidate for our portfolio but the 7-year Treasury would not because it produces an expected loss over twelve months.
Of course, shorter-maturity bonds would also pass our duration test in today’s market but longer-maturity bonds add more short-term upside potential to the portfolio. The light blue bars on the chart above show the short-term upside return potential, namely the potential total return over twelve months if rates decrease by 100 bps. The 5-year Treasury offers a potential upside return of 7.6%. Although the 7-year Treasury offers a higher potential total return in the upside scenario, that upside should be balanced with the prospect of losing money in the short term. The 5-year Treasury captures over 80% of the upside return of the 7-year Treasury but with less downside risk. Likewise, our investments in longer-duration bonds extend the portfolio’s duration and provide some short-term downside protection against rising rates while also creating the potential to capture a meaningful portion of the upside offered by longer-duration assets like those represented by the Aggregate Bond Index.
To that end, we have spent the past two years increasing the Fund’s duration from 0.98 years at December 31, 2021 to 2.71 years at December 31, 2023, a 1.73 year increase.8 We repositioned the portfolio from an ultra-short duration when rates were very low in 2021 to a longer duration today because we believe investors should take less risk when the market is expensive (i.e., when rates are low) and take more risk when the market is cheaper (i.e., rates are higher) and offers enough return to compensate for the extra risk. Moreover, focusing on downside protection has the added benefit of preserving capital for opportunistic redeployment into more attractive investment opportunities if and when they appear.
Because of our active management, as shown in the table below, the Fund was in the top 25% of its bond category in 2023, notably capturing much of the upside return in the bond market caused by the decline in risk-free rates toward the end of the year.
2023 was just one mile in a marathon. Indeed, the Fund is one of the best performing funds in its category over longer periods as well, specifically the past three years and since the Fund’s inception five years ago. As illustrated in the chart below, in comparison to the other investment alternatives shown, our absolute value-based investment approach has made the Fund’s investors wealthier over the past 10 years with less volatile returns and typically smaller drawdowns along the way.
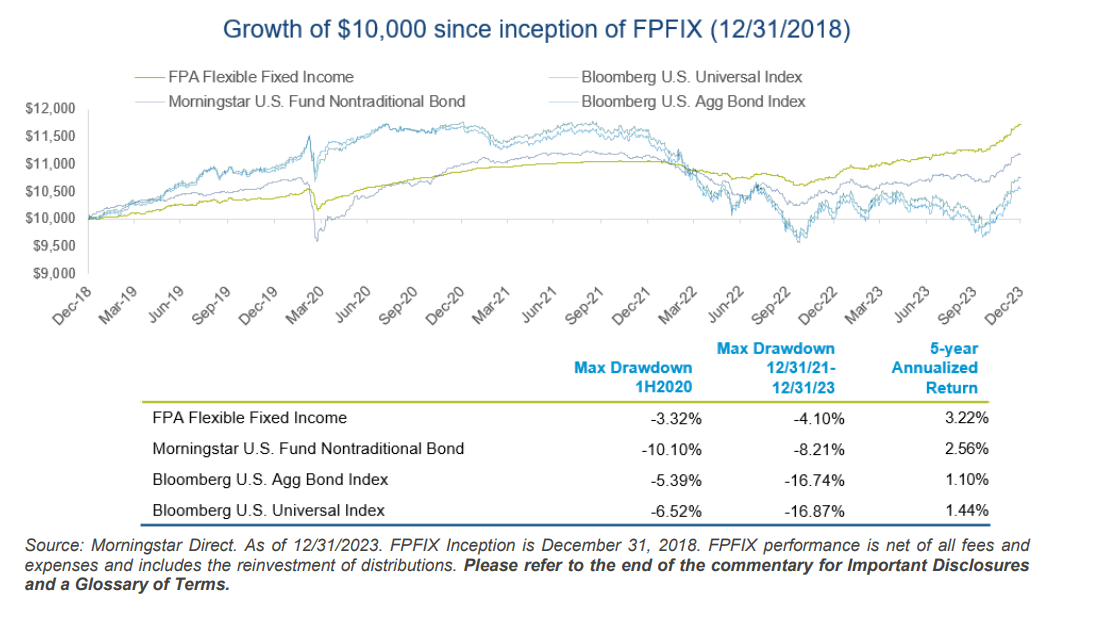
These long-term returns reflect the benefit of preserving capital through expensive markets and using preserved capital to opportunistically purchase more attractive investments that may arise as markets become cheaper. Having done a relatively good job of preserving capital as interest rates began to increase in the past few years, buying longer duration bonds is one of the attractive investments we have turned to. Recently, the opportunity in longer duration bonds has included agency residential mortgage pools, which became a meaningful exposure in the Fund during the fourth quarter of 2023. We took advantage of both the recent peak in interest rates and heightened market volatility to buy deep-out-of-the-money agency residential mortgage pools. We believe these mortgages offer a positive convexity and asymmetrically favorable short-term upside versus downside. Due to the convexity of our pools, we do not expect their duration to change meaningfully as interest rates change. Consequently, we expect our pools to produce breakeven returns if interest rates rise by 100 bps over twelve months (consistent with the 100 bps duration test described above) and to produce relatively linear positive returns if interest rates decrease, with an improving return the more rates decrease. As a point of comparison, we have seen other agency mortgage pools that appear cheaper because they trade at wider spreads, but we believe that their negative convexity and the sensitivity of their duration to changes in interest rates create a poor upside-versus-downside return profile. Specifically, these other pools may, paradoxically, produce positive but increasingly worse returns the more rates decline.
Our view that longer-duration bonds are attractive had for some time been an out of consensus view and only recently became more widely accepted. Similarly, the profile of our agency mortgage pools is out of consensus. However, we do not track an index, so we have the flexibility to deviate from the crowd and focus only on those investments that we believe compensate us for the risks involved and then those that optimize the return of and on our capital.
While our opportunistic investments in Credit over the past couple of years have also been beneficial to the Fund’s returns, we also have the flexibility to deviate from our peers and gravitate toward higher quality bonds, which we believe is appropriate in the current environment. In the high yield market, yields also remain near 15-year highs, but spreads have retreated to the 15th percentile, as measured by the BB component of the Bloomberg U.S. High Yield index (excluding energy), an index we believe provides the most consistent data over time with fewer distortions caused by changes in the composition of the overall high yield index. Although yields in the high yield market are near 15-year highs, we generally find that, in comparison to investment grade bonds, the low spreads in the high yield market do not offer enough incremental compensation for the extra credit risk involved in high yield debt. We continue to research the high yield market for investment opportunities, but these days we typically find High Quality bonds more appealing.
The Fund’s performance in 2023 and cumulative returns over the past several years are the result of a flexible, opportunistic, patient, and long-term -oriented investment approach that ignores the popular trade to focus on achieving attractive short- and long-term risk-adjusted returns. Our approach has not always been easy because it can sometimes mean accepting lower returns in an expensive market. However, we hope our investors feel that their patience has been rewarded. That patience allowed the Fund to achieve a lower drawdown when the market fell. As demonstrated by the Fund’s short- and long-term performance, that patience has now enabled the Fund to reap the rewards of more attractively-priced investments we made in recent years. The Fund was a top performer in 2023, which is great but was not the objective; rather it was a by-product of our investment approach. Much like the fable of the tortoise and the hare, slow and steady wins the race. The Fund may not win each mile of the marathon, but over the past five years the Fund’s performance has placed near the head of the pack.
Thank you for your confidence and continued support.
Abhijeet Patwardhan
Portfolio Manager
Footnotes
1 Yield-to-worst (“YTW”) is presented gross of fees and reflects the lowest potential yield that can be received on a debt investment without the issuer defaulting. YTW considers the impact of expected prepayments, calls and/or sinking funds, among other things. Average YTW is based on the weighted average YTW of the investments held in the Fund’s portfolio. YTW may not represent the yield an investor should expect to receive. As of December 31, 2023, the Fund’s subsidized/unsubsidized 30-day SEC standardized yield ("SEC Yield") was 5.19%/5.07% respectively. The SEC Yield calculation is an annualized measure of the Fund’s dividend and interest payments for the last 30 days, less the Fund expenses. Subsidized yield reflects fee waivers and/or expense reimbursements during the period. Without waivers and/or reimbursements, yields would be reduced. Unsubsidized yield does not adjust for any fee waivers and/or expense reimbursements in effect. The SEC Yield calculation shows investors what they would earn in yield over the course of a 12-month period if the Fund continued earning the same rate for the rest of the year.
2 High Quality is defined as investments rated A or higher, Treasuries, and cash and equivalents.
3 Credit is defined as investments rated BBB or lower, including non-rated investments.
4 Source: The Federal Reserve
5 This information is not a recommendation for a specific security or sector and these securities/sectors may not be in the Fund at the time you receive this report. The information provided does not reflect all positions purchased, sold or recommended by FPA during the quarter. The portfolio holdings as of the most recent quarter-end may be obtained at fpa.com.
6 The common stock holdings represent value received for past investments in corporate bonds or loans which have been restructured. We generally intend to hold these common stock investments until their market price better reflects our estimate of intrinsic value.
7 Portfolio composition will change due to ongoing management of the Fund.
8 Source: Morningstar Direct, FactSet.


Editor's Note: The summary bullets for this article were chosen by Seeking Alpha editors.