Juanmonino
Dimensional US High Profitability ETF (NYSEARCA:DUHP) is a solid, actively managed quality-centered exchange-traded fund that I previously covered in April 2023 with a Hold rating, mostly owing to its valuation issues. Today's note is supposed to offer an overview of the key additions and deletions, a brief performance attribution section, and an analysis of the current factor mix. All these are necessary to check whether the Hold rating is still valid.
But before we delve deeper into the nuances of performance drivers and style factors, it is necessary to provide the ETF's investment strategy recap. Unfortunately, as DUHP is managed actively, there are not many details available on the constituent selection process and rules on the frequency of additions and deletions. As described on pages 11 and 12 of the prospectus:
The Portfolio is designed to purchase a broad and diverse group of readily marketable securities of large U.S. companies that the Advisor determines to have high profitability relative to other U.S. large cap companies at the time of purchase. An equity issuer is considered to have high profitability because it has high earnings or profits from operations in relation to its book value or assets. The Portfolio may emphasize certain stocks, including smaller capitalization companies, lower relative price stocks, and/or higher profitability stocks as compared to their representation in the large-cap, high profitability segment of the U.S. market.
Discussing main contributors and detractors from DUHP performance
Since my April 2023 article, DUHP has surprised to the upside, delivering a fairly robust total return of 26.52% despite the valuation risks I highlighted back then.
Seeking Alpha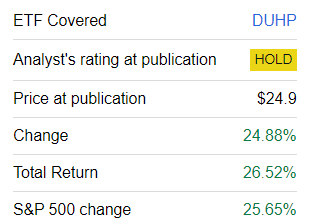
It is necessary to note that even though DUHP is managed actively, it has a meager turnover of just 4%. And this is on par with the 3% turnover of the iShares Core S&P 500 ETF (IVV). So since April 2023, it has removed just 19 stocks, which back then accounted for less than 2% of the net assets. The most notable deletions were Moderna (MRNA) and The Estée Lauder Companies (EL) which had 0.63% and 0.3% weight, respectively. Among 22 additions currently accounting for 6.9%, it is worth highlighting Johnson & Johnson (JNJ) and NVIDIA (NVDA), with 1.73% and 1.62% weight as of March 6, respectively. Overall, there are currently 181 stocks in the basket vs. 178 when I assessed it previously. The fund still has no exposure to the real estate sector.
As the portfolio has not seen profound changes, it should be easier for us to identify contributors to its fairly substantial return and detractors that hindered its price from climbing even higher.
Among those 123 names with positive price returns that were both in the April 2023 and March 2024 versions of the portfolio, the following five stocks have had the strongest momentum over the period concerned:
| Stock | Weight (April 5, 2023) | Sector | % price return |
| Dell Technologies (DELL) | 0.002% | Information Technology | 189.9% |
| Builders FirstSource (BLDR) | 0.03% | Industrials | 129.2% |
| Eli Lilly and Company (LLY) | 2.94% | Health Care | 119.9% |
| Broadcom (AVGO) | 3.11% | Information Technology | 112.8% |
| Advanced Drainage Systems (WMS) | 0.01% | Industrials | 106.2% |
Prepared by the author using data from Seeking Alpha and the ETF. Based on the share prices as of April 5, 2023 and March 7, 2024
Speaking about the narratives that contributed, DELL's meteoric share price rise was most likely supercharged by the AI frenzy. Nevertheless, it is worth highlighting that the ETF has a fairly meager exposure to it, with 505 shares as of March 7, 2024, and 1,018 as of the previous analysis. So the major contributors to DUHP's return were AVGO and LLY, the stocks not only with triple-digit gains but also with sizable weights in the portfolio, as shown below:
| Stock | Weight (March 6, 2024) | Weight (April 5, 2023) |
| LLY | 5.07% | 2.94% |
| AVGO | 4.40% | 3.1% |
Data from the ETF
In the meantime, the following stocks were languishing amid the U.S. market rally:
| Stock | Weight (April 5, 2023) | Sector | % price decline |
| Enphase Energy (ENPH) | 0.07% | Information Technology | -38.1% |
| Etsy (ETSY) | 0.24% | Consumer Discretionary | -37.4% |
| Dollar General (DG) | 0.21% | Consumer Staples | -27.2% |
| The Hershey Company (HSY) | 0.03% | Consumer Staples | -25.3% |
| C.H. Robinson Worldwide (CHRW) | 0.07% | Industrials | -24.0% |
Prepared by the author using data from Seeking Alpha and the ETF
For ENPH, the most notable underperformer, it was the state of the solar market, namely its imbalances, that took their toll on its top and bottom lines and triggered an investor exodus.
What sectors contributed to DUHP's robust performance? Information technology is unrivaled here, as illustrated by the median returns below:
| Sector | % median price return |
| Information Technology | 41.44% |
| Financials | 29.60% |
| Industrials | 23.88% |
| Consumer Discretionary | 20.53% |
| Health Care | 14.44% |
| Materials | 13.41% |
| Energy | 5.05% |
| Communication | -1.86% |
| Consumer Staples | -3.44% |
Prepared by the author using data from Seeking Alpha and the ETF. Utilities are not represented as NRG Energy (NRG), the only stock from the sector, was replaced with Vistra (VST) over the period discussed.
Meanwhile, as consumer staples with their defensive aura fell out of favor amid the growth rally, the sector appeared to be the most significant detractor from DUHP's price return.
Regarding style factors, I believe it was growth that made the largest impact on DUHP's return; for context, a difference can be spotted in the median forward revenue growth rates for the groups of stocks that delivered positive and negative price returns, 7.1% vs. 5.1%, respectively. Interestingly, out of 39 companies with revenue growth above or equal to 10%, 32 delivered gains, while only 7 were in the red.
DUHP factor exposure developments since April 2023
Factor exposures in portfolios can change for different reasons, including notable recalibrations, capital appreciation/depreciation of holdings, or both. In the case of DUHP, it was both. Let us address the nuances below.
For the most recent portfolio, holdings as of March 6 and financial data as of March 7 (Calculated by the author using data from Seeking Alpha and DUHP)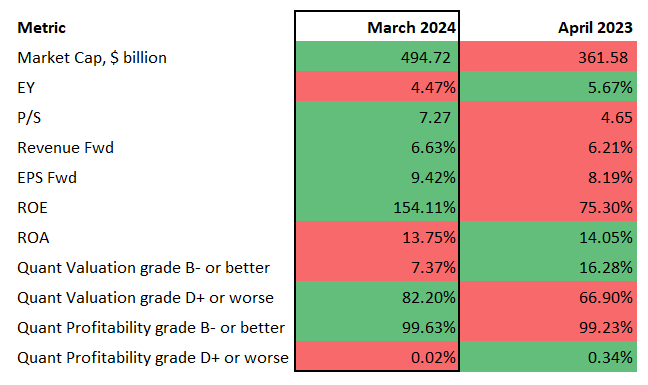
DUHP has become more expensive
The weighted-average market cap has risen solidly to almost $495 billion. It was not only because it has seen rather strong price performance. The addition of NVDA has also solidly contributed. So at this point, DUHP has exposure to three members of the elite Magnificent Seven cohort, namely Microsoft (MSFT), Apple (AAPL), and NVDA. Interestingly, Amazon (AMZN), which had a weight of 0.17% in April 2023, was removed.
At the same time, the earnings yield has contracted while the Price/Sales ratio has climbed higher. To give a bit more color, 132 holdings now have an EY lower than in April 2023. For example, DELL has seen its EY going down from about 13% to just 3.8% due to its capital appreciation. Besides, we see that the share of stocks with no less than a B- Quant Valuation rating has more than halved. So DUHP's valuation issue has become even more acute, but assuming the current environment as the markets are awaiting interest rate cuts this year, it is less of a concern.
Slightly stronger growth characteristics
At this juncture, the portfolio has slightly larger growth exposure. For instance, the main drivers of its forward revenue growth rate are as follows:
| Symbol | Weight | Sector | Revenue FWD |
| NVDA | 1.62% | Information Technology | 69.22% |
| First Citizens BancShares (FCNCA) | 0.16% | Financials | 30.36% |
| Royal Caribbean Cruises (RCL) | 0.38% | Consumer Discretionary | 25.36% |
| LLY | 5.07% | Health Care | 21.44% |
| Lamb Weston Holdings (LW) | 0.07% | Consumer Staples | 21.21% |
Data from Seeking Alpha and the ETF
Three of them, namely the above-mentioned NVDA, FCNCA, and RCL, were absent in the April 2023 version of the portfolio.
However, even with these improvements, the ETF's growth characteristics are still fairly unimpressive. In the previous article, I mentioned the estimated 3-5-year EPS growth rate for the S&P 500 for a better context. I suppose it is worth doing so this time: as shown on the website of the SPDR Portfolio S&P 500 ETF (SPLG), the rate is currently at 14.07%. DUHP's weighted-average forward rate is only 9.42%, as per my calculations.
Quality factor
DUHP's quality characteristics are close to perfect, as over 94% of the holdings have an A (including A- and A+) Quant Profitability grade. Return on Assets is materially above 10%, even though it is a few bps lower than in April 2023. As to the weighted-average Return on Equity, it is not informative as it is hugely distorted by Booking Holdings (BKNG), which has an ROE of 22,573.68%.
Should my rating on DUHP be upgraded today?
DUHP has a lot to offer regarding profitability but not much growth, and its performance is lagging a bit. Its annualized total return over the March 2022–February 2024 period remains above IVV's, but here it is worth reminding that this CAGR is primarily driven by its 2022 performance, while in 2023, it underperformed significantly, with a 21.1% total return vs. IVV's 26.3%.
| ETF | 2023 total return |
| QUAL | 30.9% |
| IVV | 26.3% |
| JQUA | 25.1% |
| SPHQ | 24.8% |
| DUHP | 21.1% |
Data from Portfolio Visualizer
Additionally, over this period, DUHP beat the Invesco S&P 500 Quality ETF (SPHQ) but the JPMorgan U.S. Quality Factor ETF (JQUA) and the iShares MSCI USA Quality Factor ETF (QUAL) did much better, as shown below.
| Portfolio | IVV | DUHP | JQUA | SPHQ | QUAL |
| Initial Balance | $10,000 | $10,000 | $10,000 | $10,000 | $10,000 |
| Final Balance | $12,013 | $12,401 | $12,896 | $12,178 | $12,705 |
| CAGR | 9.60% | 11.36% | 13.56% | 10.35% | 12.71% |
| Stdev | 19.65% | 19.46% | 17.90% | 19.07% | 20.59% |
| Best Year | 26.32% | 21.11% | 25.13% | 24.82% | 30.89% |
| Worst Year | -11.02% | -4.38% | -4.45% | -9.73% | -10.90% |
| Max. Drawdown | -20.28% | -18.45% | -17.60% | -19.61% | -22.13% |
| Sharpe Ratio | 0.37 | 0.45 | 0.59 | 0.41 | 0.5 |
| Sortino Ratio | 0.55 | 0.73 | 0.94 | 0.61 | 0.76 |
| Market Correlation | 1 | 0.98 | 0.99 | 0.96 | 0.99 |
Data from Portfolio Visualizer
All in all, I maintain the Hold rating on DUHP.