Tippapatt
Investment Thesis
iShares Core S&P U.S. Value ETF (NASDAQ:IUSV) warrants a buy rating due to its ability to achieve returns roughly on par with cap-weighted S&P 500 Index or total market funds while currently providing diversification away from mega-cap, big tech holdings including the “Magnificent Seven”. Additionally, IUSV has achieved these returns while seeing relatively lower volatility than the market overall. Finally, IUSV matches top value peer funds for the lowest expense ratio while having the greatest diversification in terms of the quantity of its holdings.
Fund Overview and Compared ETFs
IUSV is a passively managed exchange-traded fund or ETF that seeks to track the S&P 900 Value Index. The fund therefore captures large-cap and mid-cap holdings that demonstrate value characteristics. iShares defines these characteristics as stocks that are undervalued by the market relative to comparable companies. With its inception in 2000, IUSV has 741 holdings and $16.51B in AUM. IUSV has the largest weight by market sector on financials (22.36%), followed by healthcare (18.01%) and industrials (11.63%).
For comparison purposes, other funds examined are the SPDR Portfolio S&P 500 Value ETF (SPYV), the Fidelity Value Factor ETF (FVAL), and the Vanguard Value ETF (VTV). IUSV is the closest in holdings and performance to SPYV which tracks the S&P 500 Value Index. FVAL tracks Fidelity’s own Fidelity U.S. Value Factor Index. Compared to IUSV, FVAL is much heavier on information technology (28.66%) and includes a number of mega-cap, big tech holdings in its top 10. VTV tracks the CRSP U.S. Large Cap Value Index. It is another passively managed fund that captures large cap U.S. holdings. Therefore, VTV has several similar characteristics to IUSV and FVAL.
Performance, Expense Ratio, and Dividend Yield
IUSV has demonstrated a 5-year average annual return of 14.00%. By comparison, SPYV has seen a 5-year average return of 12.43%, FVAL has a 5-year average annual return of 14.19%, and VTV has a 5-year annualized return of 11.21%. IUSV has only lagged the S&P 500 Index slightly over the past five years, which has seen a 5-year average annual return of 14.72%.
5-Year Total Price Return: IUSV and Peer Examined Value ETFs (Seeking Alpha)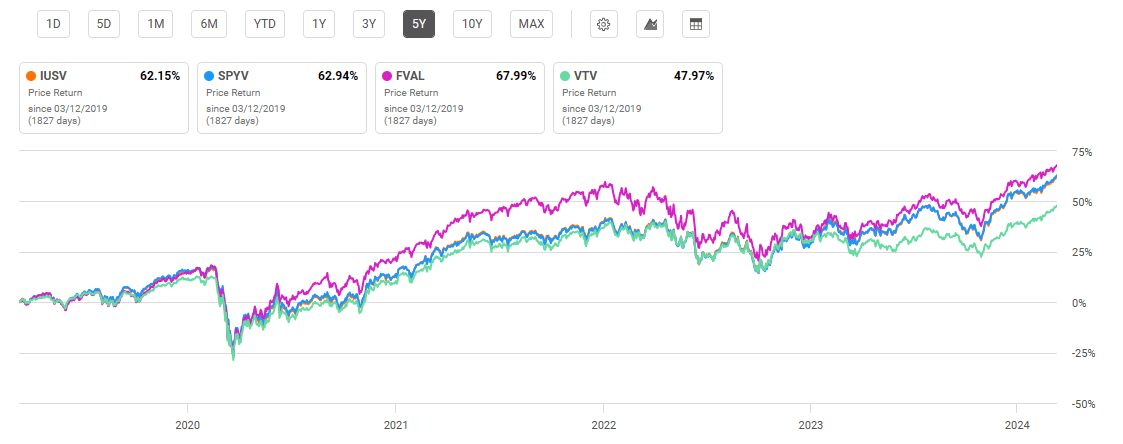
IUSV is tied for the lowest expense ratio of compared peer value funds at a very low 0.04%. Additionally, IUSV offers a noteworthy dividend yield of 1.67%. However, VTV’s dividend yield is higher at 2.31%. Yields for all funds have been growing over the past five years, and IUSV has a 5-year dividend yield CAGR of 2.49%.
Expense Ratio, AUM, and Dividend Yield Comparison
IUSV | SPYV | FVAL | VTV | |
Expense Ratio | 0.04% | 0.04% | 0.15% | 0.04% |
AUM | $16.51B | $20.72B | $749.14M | $162.66B |
Dividend Yield TTM | 1.67% | 1.67% | 1.62% | 2.31% |
Dividend Growth 5 YR CAGR | 2.49% | 0.18% | 7.89% | 6.57% |
Source: Seeking Alpha, 12 Mar 24
IUSV Holdings and Its Competitive Advantages
IUSV has the greatest diversification of compared value funds at 741 holdings. Despite this high diversification, the fund still manages to capture 17.35% weight on its top 10 holdings. IUSV is similar in holdings mix to SPYV and VTV. However, it differs significantly from FVAL which has greater weight on the IT sector.
Top 10 Holdings for IUSV and Peer Value ETFs
IUSV – 741 holdings | SPYV – 444 holdings | FVAL – 131 holdings | VTV – 350 holdings |
BRKB – 3.53% | BRKB – 3.74% | MSFT – 7.49% | BRKB – 3.70% |
JPM – 2.60% | JPM – 2.78% | AAPL – 6.52% | AVGO – 2.78% |
XOM – 2.09% | XOM – 2.20% | AMZN – 3.92% | JPM – 2.67% |
JNJ – 1.86% | JNJ – 1.95% | GOOGL – 3.48% | UNH – 2.51% |
UNH – 1.34% | UNH – 1.40% | META – 2.64% | XOM – 2.18% |
CVX – 1.28% | CVX – 1.34% | BRKB – 2.10% | JNJ – 2.03% |
WMT – 1.24% | WMT – 1.32% | JPM – 1.67% | PG – 1.96% |
BAC – 1.18% | BAC – 1.25% | CRM – 1.66% | MRK – 1.62% |
HD – 1.12% | HD – 1.21% | UNH – 1.64% | ABBV – 1.54% |
PG – 1.11% | PG – 1.18% | JNJ – 1.52% | CVX – 1.40% |
Source: Multiple, compiled by author on 12 Mar 24
Value funds like IUSV have two key advantages over the preponderance of other ETFs. First, IUSV offers diversification away from mega-cap, big tech holdings included in the “Magnificent Seven” but still includes companies identified as having strong fundamentals. Second, IUSV offers strong historic performance while demonstrating relatively lower volatility than “the market” overall. These competitive advantages are discussed in further detail below.
Key Advantage #1: Diversification Away from the “Magnificent Seven”
The first difference is that IUSV lacks the Magnificent Seven in its top 10 holdings. This represents a distinct difference from any S&P 500 Index fund or even FVAL, a peer value fund. In addition to S&P 500 Index funds, total market funds also include a strong mix of mega-cap, tech-heavy holdings. Vanguard’s Total Stock Market Index Fund Admiral Shares (VTSAX), for example, is a broad-based, low-cost index fund that captures 3,747 holdings. Despite this massive diversification, 23.31% of the fund’s weight is in Magnificent Seven stocks. Additionally, of the top 10 holdings for Vanguard’s S&P 500 ETF (VOO), 26.95% of the fund’s weight is from Magnificent Seven stocks.
The danger of such heavy holdings in these few tech stocks is their current valuation. NVIDIA Corporation (NVDA), for example, has seen a one-year price return of over 290%. Meta Platforms, Inc. (META), another Magnificent Seven example, has seen a one-year return of 175%. Therefore, even if investors passively buy-and-hold S&P 500 Index or total market funds, they are inherently becoming relatively heavy on Magnificent Seven stocks. IUSV allows investors to capture large cap stocks with strong fundamentals, while intentionally providing diversification away from these mega caps in the event of a pullback.
Key Advantage #2: Solid Returns at Lower Volatility
The second key advantage for IUSV is that the fund is able to achieve similar performance compared to a broad-based S&P 500 Index or total market fund while seeing relatively lower volatility. For example, VTSAX has seen an average annual five-year return of 13.85%. This is lower than IUSV’s average five-year annual return of 14%. However, VOO, which includes greater weight on mega-cap, big tech holdings, has an average five-year annual return of 14.72%.
Despite this similar performance, IUSV has demonstrated relatively lower volatility than “the market” overall. While beta values are a measure of correlation, they also provide an implied metric for volatility. IUSV has seen a 3-year beta value of 0.89, indicating lower volatility than the market. This can be contributed to the inclusion of stable healthcare and industrial holdings that typically see lower volatility than IT holdings. By comparison, FVAL, which includes mega-cap big tech in its top 10 holdings, has a 3-year beta value of 0.96. VTV, which includes similar holdings to IUSV, has a 3-year beta value of 0.89 also.
Valuation and Risks to Investors
IUSV has a current price of $88.60 at the time of writing this article. This price is roughly at its all-time high and the upper limit of its 52-week range of $69.38 to $88.77. IUSV has seen a one-year performance roughly on par with peers, with a return of over 26%. Due to the strong performance of mega-cap, big tech previously discussed, the S&P 500 Index has seen a one-year return of roughly 34%.
One-Year Price Performance: IUSV and Compared Value Funds (Seeking Alpha)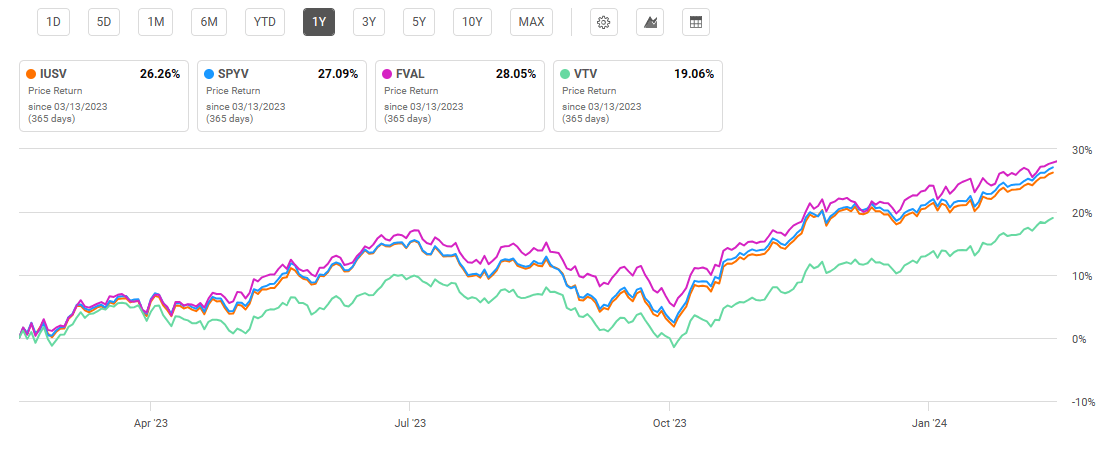
Despite the S&P 500 outperforming value funds including IUSV, the S&P 500 Index’s P/E ratio is 28.05. This is significantly higher than its historical median of roughly 15.0. By comparison, value funds such as IUSV have a lower P/E ratio. Specifically, IUSV has a P/E ratio of 24.44, lower than competitors except for VTV. Additionally, IUSV has the lowest P/B ratio of compared value funds at 5.23.
Valuation Metrics for IUSV and Peer Competitors
IUSV | SPYV | FVAL | VTV | |
P/E ratio | 24.44 | 24.58 | 25.25 | 23.20 |
P/B ratio | 5.23 | 5.40 | 7.53 | 5.53 |
Source: Compiled by Author from Multiple Sources, 12 Mar 24
Despite having a lower P/E ratio and relatively lower volatility than the market overall, investment in value funds does not come without risk. During the COVID pandemic in 2020, IUSV dropped from a value of $63.79 per share to $39.87 per share, representing a decline of 37%. By comparison, VTSAX saw a decline from $83.79 to $54.49, representing a fall of 35%. Therefore, historically lower volatility does not necessarily mean protection against steep corrections and bear markets.
Concluding Summary
Given the strong recent performance of the “Magnificent Seven,” most broad-based total market funds and S&P 500 Index funds have a relatively solid weight on mega-cap, big tech holdings. IUSV is a value fund that can provide investors with an ability to intentionally diversify their portfolio with fundamentally strong holdings not included in the “Magnificent Seven.” Additionally, IUSV has a track record of historically strong returns while offering relatively lower volatility than “the market” overall. Compared to other popular value funds, IUSV ties for the lowest expense ratio and currently has relatively attractive valuation metrics when examining its P/E and P/B ratios.