Jonathan Knowles
Introduction
On April 19th, 2023 I had published an article recommending a "Hold" on Gaming and Leisure Properties, Inc. (NASDAQ:GLPI). At the time of the publication, the stock was at $51.38 and, in my summary, I stated, "For an investor looking to initiate a position and some margin of safety, a price under $50 would be worth considering".
In general, there are three reasons that have prompted the change in my recommendation to a "Buy". Firstly, the macro picture has changed. The federal funds rate has remained at about the same level since last summer following a steady climb upwards that began in early 2022. Secondly, the three recent transactions of GLPI were closed at an 8.18% cap rate as compared to a cap rate of 7.52% for 2022 into 2023 transactions. Finally, the stock is ~12% below when we last appraised the stock. The dividend yield is almost a full percentage point above the yield in the previous analysis. Taken together, we have GLPI achieving a higher cap rate in a more stable macro environment available at a lower price.
Source: GLPI 10-K for 2023, Company Overview/Investor Presentation for March 4, 2024.
In this article, we evaluate GLPI's operating performance in light of the current macroeconomic environment. We first look at interest rates briefly and offer commentary on how the level and direction of interest rates could impact REITs. We use the US 10-year Treasury as our measure of interest rates and connect how interest rates impact GLPI's ability to create value. We distinguish between GLPI's ability to create value as a business and whether the stock is priced at a reasonable discount to value for equity investors.
For those that have read my previous article on GLPI, I have made some updates to my model. The most notable will be the input used to estimate the cost of debt. I will provide more color on this in the relevant section.
REITs and Interest Rates
Please take a look at the following chart that plots the All Equity REITs Implied Cap Rates and the 10-year Treasury from 2014 - the year GLPI elected to be taxed as a REIT.
Exhibit 1 (Nareit and St. Louis Federal Reserve)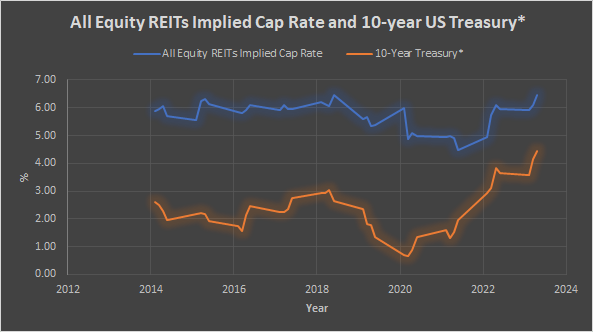
Source: Nareit, St. Louis Federal Reserve.
The average spread between the All Equity REITs Implied Cap Rates and the 10-year Treasury during the time period presented is 343 basis points. One interpretation of this is that investors generally expect a 3.43% premium over the 10-year Treasury for REIT assets given the risk profile of the asset class. As of Q3 2023 (the latest available data), the spread was 201 basis points. The last time the spread was in the vicinity of 343 basis points was in Q3 2021 when the spread stood at 338 basis points. Having a narrower-than-usual spread is a headwind for REITs. Investors could potentially shift their allocation from REITs into safer and relatively high-yielding fixed-income investments which would have the effect of depressing the stock price of REITs. Also, given that REITs are required to distribute an amount equal to at least 90% of taxable income each year, they are reliant on external forms of capital. In an elevated interest rate environment, REITs are exposed to potentially refinancing loans that are coming due at a higher interest rate which would crimp profitability. In terms of acquisition, if it costs more to fund acquisitions, then sellers might decide to sit on the sidelines until more favorable times when buyers are plentiful. This would curtail the deal flow for REITs.
In these and other ways, many REITs including GLPI have had to weather the brunt of the recent monetary tightening cycle. But it is not just the level of interest rates that affect REITs, the perceived direction of interest rates also has an impact. And it is here that the picture is very different. The CME FedWatch Tool has a 58.4% probability of a 25-basis point cut at the June 12 FOMC meeting. When interest rates are expected to go down, investors may shift their portfolios back to higher-yielding investments such as REITs. If REITs expect interest rates to come down, they can plan their capital raise and/or plan to refinance higher interest rate debt accordingly. If financing costs come down, more buyers enter the market, and sellers of real estate may be more open to offers. Asset prices are based on future expectations and the perception of lower interest rates should buoy REIT stocks.
Now that we have a general idea of what may be on the horizon for REITs, let's quantify the value that GLPI can generate by incorporating the current macroeconomic environment.
GLPI as a Spread Investor
In a triple-net lease, the lessee pays rent to the lessor and is responsible for all taxes, insurance, utilities, and maintenance expenses that arise from the use of the property. Essentially, GLPI is a spread investor. They obtain capital from creditors and investors and put that capital to use by acquiring real estate assets and leasing them out. Crucially, the rental income earned must be more than the cost to finance the acquisition of the real estate. GLPI earns an economic profit that is the difference between the rent and the cost to finance. For us to evaluate the health of GLPI, we need some measure of this spread. The wider the spread, the better. Furthermore, as investors, we want a piece of this spread, preferably at a discount to intrinsic value. For a REIT, this spread can be estimated as the difference between the capitalization rate, or cap rate, and the cost of capital. The cap rate is the net operating income divided by the asset value and the cost of capital is the cost of debt financing and the cost of equity financing in proportion to how much of each is used by the business. Let us evaluate each of these:
Cap Rate
Please take a look at Exhibit 2 presents GPLI's transaction activity since their formation. I am going to use their last three transactions as representative of the cap rates they can achieve in the current environment.
Exhibit 2 (GLPI March 4th 2024 Company Overview)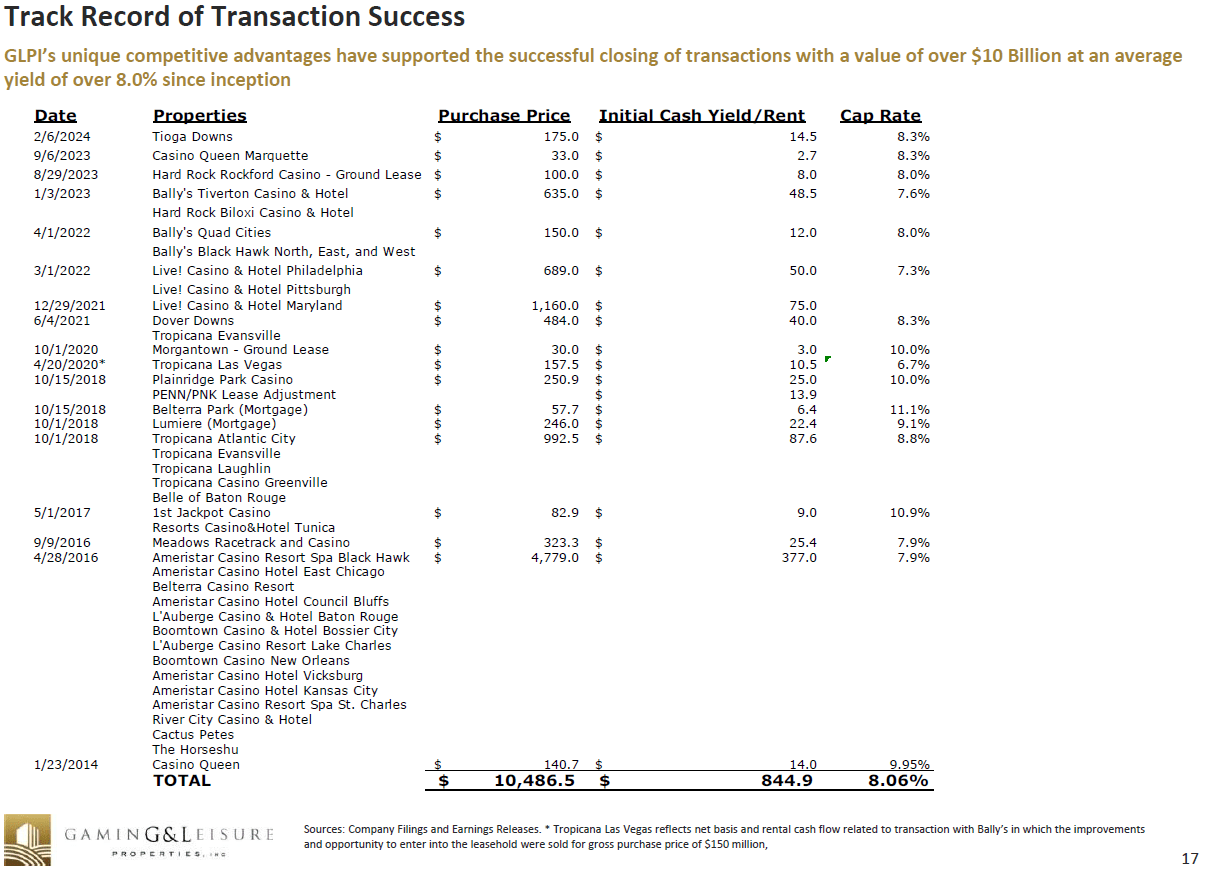
The last three transactions include the Tioga Downs acquisition in February of this year. The total purchase price of the three transactions total $308 million and the initial cash yield rent for the last four transactions is $25.2 million for a representative cap rate of 8.18%. For GLPI to pursue accretive transactions in the current macro environment, their cost of capital must be less than 8.18%.
Cost of Debt
GLPI has a long-term issuer rating of investment grade rating from Fitch with a stable outlook. S&P has a rating below investment grade and Moody's does not have an opinion currently. This is something to watch. VICI Properties Inc. (VICI), their chief competitor, has an investment grade issuer rating from two of the three major credit rating agencies. GLPI's Net Debt/EBITDA has come down from 6.3x in 2018 to 4.5x in 2023. Still, it is not unreasonable to expect that they have an issuer credit rating of investment grade with at least two credit rating agencies, as VICI does.
| Table 1: Issuer Rating and Cost of Debt | ||
| Description | Rating/Yield | Outlook/Maturity |
| Standard & Poor's Rating Services | BB+ | Stable |
| Moody's | Withdrawn (2020) | N/A |
| Fitch | BBB- | Stable |
| Senior Unsecured Note | 5.82% | January 2032 |
Source: Moody's, S&P, Fitch and Finra.
GLPI has a 3.25% note maturing on January 15, 2032, that recently exchanged hands at a yield of 5.82%. We shall use this as our estimate for the cost of debt. This is a departure from my previous analysis in which I used the interest expense as the input for the cost of debt. While interest expense is the actual cost of long-term debt, it understates the cost of debt in a rising interest rate environment because long-term debt in the company's books would have originated in a lower interest rate regime. Using actual transaction data is the best estimate of what the company expects to pay should it fund an acquisition today.
Cost of Equity
There are different methods and philosophies around calculating the cost of equity. We use the Capital Asset Pricing Model (CAPM) in which we essentially add a spread to the risk-free rate and scale the spread by the beta statistic of the particular stock. Let us review this in some detail. Please take a look at Table 2.
| Table 2: Cost of Equity | |
| β | 0.95 |
| Risk-free Rate | 4.19% |
| Equity Risk Premium | 3.43% |
| Cost of Equity | 7.45% |
Source: www.cnbc.com on March 13th, 2024.
The beta statistic is a measure of systematic risk. It is measured by regressing the returns of the stock against the market. The stock's beta can be influenced by the volatility of the revenue stream and/or the amount of debt employed in the business. The market as a whole has a beta statistic of 1.0. One would expect that a REIT that has a revenue stream that is contractual in nature and provides some degree of certainty would have a beta statistic well below the market. However, GLPI's tenant base is not diverse. More than half of revenues come from their largest tenant - PENN. In this context, a beta statistic of 0.95 seems justified.
For the risk-free rate, I use the US 10-year Treasury which is a commonly used proxy for the risk-free rate.
The equity risk premium is simply the 343 basis point spread observed between equity REITs and 10-year Treasury as mentioned at the top of the article. It is a measure of the premium required by investors over the 10-year Treasury given the risk profile of the asset class.
Now that we have the cost of debt and the cost of equity financing, we now weigh each source of capital in proportion to how much of each is used in the business. Please look at Table 3 for GLPI's capital structure.
| Table 3: Capital Structure | ||
| Form | Value ($ billions) | Weight |
| Equity market capitalization | $12.62 | 65.55% |
| Total debt (book value) | $6.63 | 34.45% |
| Total | $19.25 | 100% |
Source: www.cnbc.com, GLPI 10-K for 2023.
We now have the inputs we need to estimate GLPI's weighted average cost of capital. Please see Table 4.
| Table 4: Weighted Average Cost of Capital ("WACC") | |
| % | |
| Weight of debt | 34.45% |
| Weight of equity | 65.55% |
| Cost of debt | 5.82% |
| Cost of equity | 7.45% |
| WACC | 6.89% |
The tax shield normally included in the calculation of the WACC is ignored because REITs do not pay taxes at the corporate level.
In Table 5, we calculate the difference between GLPI's cap rate and the weighted average cost of capital. This spread is a measure of how much economic profit GLPI is able to generate given their operating environment and their cost of capital. GLPI is able to generate an economic profit of 129 basis points, which is a healthy spread. By comparison, I estimated VICI's spread to be 47 basis points.
| Table 5: Cap Rate Minus WACC | |
| Cap Rate | 8.18% |
| WACC | 6.89% |
| Difference | 1.29% |
Just because the business generates more value currently, doesn't automatically justify an investment in the stock. It is just as important to consider to whom does that 129 basis points of value accrue to? Management? Fixed income investors? Holders of OP units?
To estimate how much value is created on behalf of equity investors, we revisit the cost of equity calculated previously.
We estimated the cost of equity using CAPM which is a statistical method of ascertaining the cost of equity. There are other methods to calculate the cost of equity. Also, cost of equity is the terminology used from the company's perspective. It is the cost for them to obtain equity capital. From an investor's point of view, the cost of equity is the required rate of return. And for many investors, particularly REIT investors, the required rate of return has two components: the current dividend yield and the growth rate of the dividends.
Please take a look at Table 6 which presents GLPI's total return as a combination of the current dividend yield and the growth rate of the dividends.
| Table 6: Total Return | |
| Dividend yield | 6.56% |
| Dividend CAGR 2014-2023 | 3.76% |
| Total return | 10.32% |
Source: Seeking Alpha. Dividend CAGR for 2014 to 2023 includes regular dividends, not special dividends.
In Table 7, we compare the total return with the cost of equity calculated using CAPM. The cost of equity in this case can be thought of as the opportunity cost for investing in the stock akin to a "hurdle rate".
| Table 7: Total Return Minus Cost of Equity | |
| Total Return | 10.32% |
| Cost of Equity | 7.45% |
| Difference | 2.87% |
The difference of 287 basis points should not be taken as some definitive measure of discount to fair value. There are many inputs used in this framework and small changes in the inputs will impact the result. However, having a sizeable difference as we have here can form a reasonable basis that a sufficient margin of safety is present in GLPI's stock at the current price.
Conclusion
If we incorporate recent transactions, we can conclude that GLPI is able to transact at a healthy spread to their cost of capital. In and of itself, this speaks to GLPI having some degree of competitive advantage. When interest rates increased, they took steps to successfully protect their spread. Moreover, the stock is available at a sufficient margin of safety at the current price. The business is doing well, and the stock is cheaper than it was when there was much more uncertainty in the macroeconomic setting.
There is an item that investors should monitor. Having an issuer rating that is lower than medium grade on the investment-grade spectrum in one of the three credit rating agencies is something that management should improve on. Enhancing their investment-grade issuer status will lower their cost of capital and strengthen their competitive position. They are taking steps in this direction as evidenced by the trend down of the Net Debt/EBITDA ratio.
On balance, taking into account their business model, track record, and current conditions, GLPI's stock offers a compelling value at the current price. Dividend-oriented investors should consider it a worthwhile addition to their portfolio.