LilliDay
Thesis
In a recent article on Exxon Mobil Corporation (XOM), I argued that oil prices could return to $100 per barrel in the near future. The article then detailed the potential impacts of a higher oil price on XOM’s profits and stock prices. The main drivers that I analyzed in that article are two-fold and quoted below:
The first one is inflation. As shown in the next chart, oil’s current prices are still about the same as they were back in 2014. Historically, oil prices have been rising more rapidly than inflation (see the chart below provided by the U.S. Energy Information Administration, EIA). The CPI (Consumer Price Index) was 234 in 2014 and is now above 310. If oil prices were to rise in tandem with CPI, it would be about $114 per barrel now.
The second one involves the supply-demand imbalance caused by ongoing geopolitical conflicts. On the supply end, geopolitical tensions and production cuts by the OPEC (Organization of the Petroleum Exporting Countries) can persist and keep restricting oil supply. On the demand end, as global economies recover and travel restrictions ease, I expect demand (in terms of volume) to keep rising.
Seeking Alpha
The March CPI data (see this SA news for more details) came in handy to support my first point of view. March CPI was hotter than expected, and a key driver was fuel/energy cost (with shelter as another key driver). Among all the inflation drivers, I view fuel/energy as the most fundamental one because energy is ultimately needed for our other problems (building more houses, producing/transporting the raw materials to build those houses, etc.)
Against this background, the goal of this article is to extend my analysis to the broader energy sectors represented by the Energy Select Sector SPDR® Fund ETF (NYSEARCA:XLE). If energy/fuel prices do rise, it is of course good news for holdings in XLE in general. However, by knowing the different levels of sensitivity of each sub-sector to oil prices, investors could optimize their strategy. In the remainder of this article, I will focus on the following three sub-sectors in particular, which represent a large portion of XLE’s assets as seen in the next below.
- Integrated players with an emphasis on production, such as Exxon Mobil and Chevron
- Refineries (such as Phillips 66 and Valero)
- Service companies such as Schlumberger Limited and Halliburton Company.
XLE fund description
Integrated Producers - XOM and CVX
Integrated producers, especially the leaders such as Exxon Mobil and Chevron (CVX), are well-rounded and best suited for more conservative investors. They have complimentary business segments and well-diversified income streams. They are also the largest holdings in XLE.
Thanks to their scale and technology, XOM and CVX enjoy some of the most competitive breakeven costs for producing oil. As detailed in my XOM article, even with CAPEX investment and depreciation included, XOM’s breakeven cost was around $45 in my analysis. With its acquisition of Pioneer Natural Resources, the breakeven price could be even lower. XOM is not the only one doing this. Its close peers like CVX and Occidental Petroleum (OXY) also have similar acquisitions ongoing to control assets with lower production costs. For instance, CVX recently announced that it had agreed to acquire Hess Corp. (HES). After the acquisition, CVX will have access to Hess’ stake in the Stabroek Block in Guyana. This block also features a highly lucrative breakeven price in the $25 to $35 per barrel range.
As the current level of oil prices is far below their production cost, every dollar of increase directly translates into net profit for these producers. Even assuming a $45 breakeven cost (just to be on the conservative side), my following calculations indicate that each dollar of oil price increase can add $0.21 dollar to XOM’s EPS (more details are provided in my XOM article). Combined with a potential valuation renormalization as seen in the second chart, XOM’s stock price could well reach the $200 level. These analyses and results are equally applicable to CVX (and OXY, too).
Author Author 

Refineries - PSX and VLO
If you recall from an earlier chart showing XLE’s top 10 holdings, refinery stock occupies a few spots on that list. And here I will focus on Phillips 66 (PSX) and Valero Energy Corporation (VLO). My opinion on refineries is less clear-cut compared to those on producers. Refineries face two forces pulling them in opposite directions as/if fuel prices increase.
The first force is that increased oil/fuel prices tend to increase their costs because refiners consume oil as feedstock. This is the reason that some of you might have heard the strategy of holding refineries together with producers, so they hedge against each other and dampen the sensitivity of your portfolio regarding oil prices.
Then there is the second force that could help them when oil prices rise. As both inflation and energy prices stay elevated (like the situation we are in now), these refinery stocks typically enjoy a favorable price on their end products such as gasoline, diesel, jet fuel, etc. These forces also make their profits highly sensitive to commodity prices. You can get a pretty good idea just by looking at the chart below plotting their P/E and see how wide the fluctuations are (the top panel).
Finally, in terms of valuation, my view is that they are on the more expensive end of their historical spectrum now. We just see how little insight their P/E offers. So, the bottom panel of the next chart shows the price-to-sales ratio. As seen, both stocks are currently trading above their historical averages and actually quite close to the most expensive multiple in the past 5 years.
As such, we have a more neutral view on these refinery stocks.
Seeking Alpha
Service stocks - SBL and HAL
Another major sub-sector held in XLE is energy service stocks. Schlumberger Limited (SLB) is currently the 6th largest holding in the fund, and Halliburton Company (HAL) is the 13th largest.
My very intuitive way to understand these service stocks is that they are like leveraged bets, say compared to stocks like XOM and CVX. Producers benefit from energy prices (oil and natural gas mainly) directly – or LINEARLY in math terminology. If you recall my analysis on XOM earlier, my estimate is that each dollar of oil price increase above its breakeven point adds $0.21 to its EPS, which is a linear relationship.
Services stocks benefit from the profits of other players. Hence, their response to oil prices is indirect and can be nonlinear. As you can see clearly from the two charts below. When times are good, they rise more quickly. The past year is a good example. As seen in the first chart, XOM delivered a total return of 10.5% (a terrific return in its own right). But HAL’s return is more than 2x of that. Of course, when times are bad, they correct more drastically also (see the second chart, especially the period highlighted by the red box). These observations made on HAL are also applicable to other service stocks, as you can see from their much higher beta in the longer term, shown in the third chart below.
Seeking Alpha Seeking Alpha Seeking Alpha


We feel they are appealing to more risk-prone investors for a few good reasons now:
In terms of valuation, my view is that these stocks are about fairly valued now. Again, for the same reason as the refineries, their P/E fluctuations are too much and offer little insight. Thus, I will rely on their P/S ratio again to gauge their valuation. As seen in the chart below, both SLB and HAL are trading at P/S ratios close to their historical average.
Looking ahead, I have an overall positive outlook for these service stocks. Major producers such as XOM and CVX are likely to expand on their CAPEX spending in the years to come and thus support the earnings of service stocks. And producers like XOM and CVX certainly have the means to afford it given the robust cash being generated now.
Considering the combination of profit tailwinds and a reasonable valuation, I think these service stocks offer an enticing opportunity for more risk-tolerant investors.
Seeking Alpha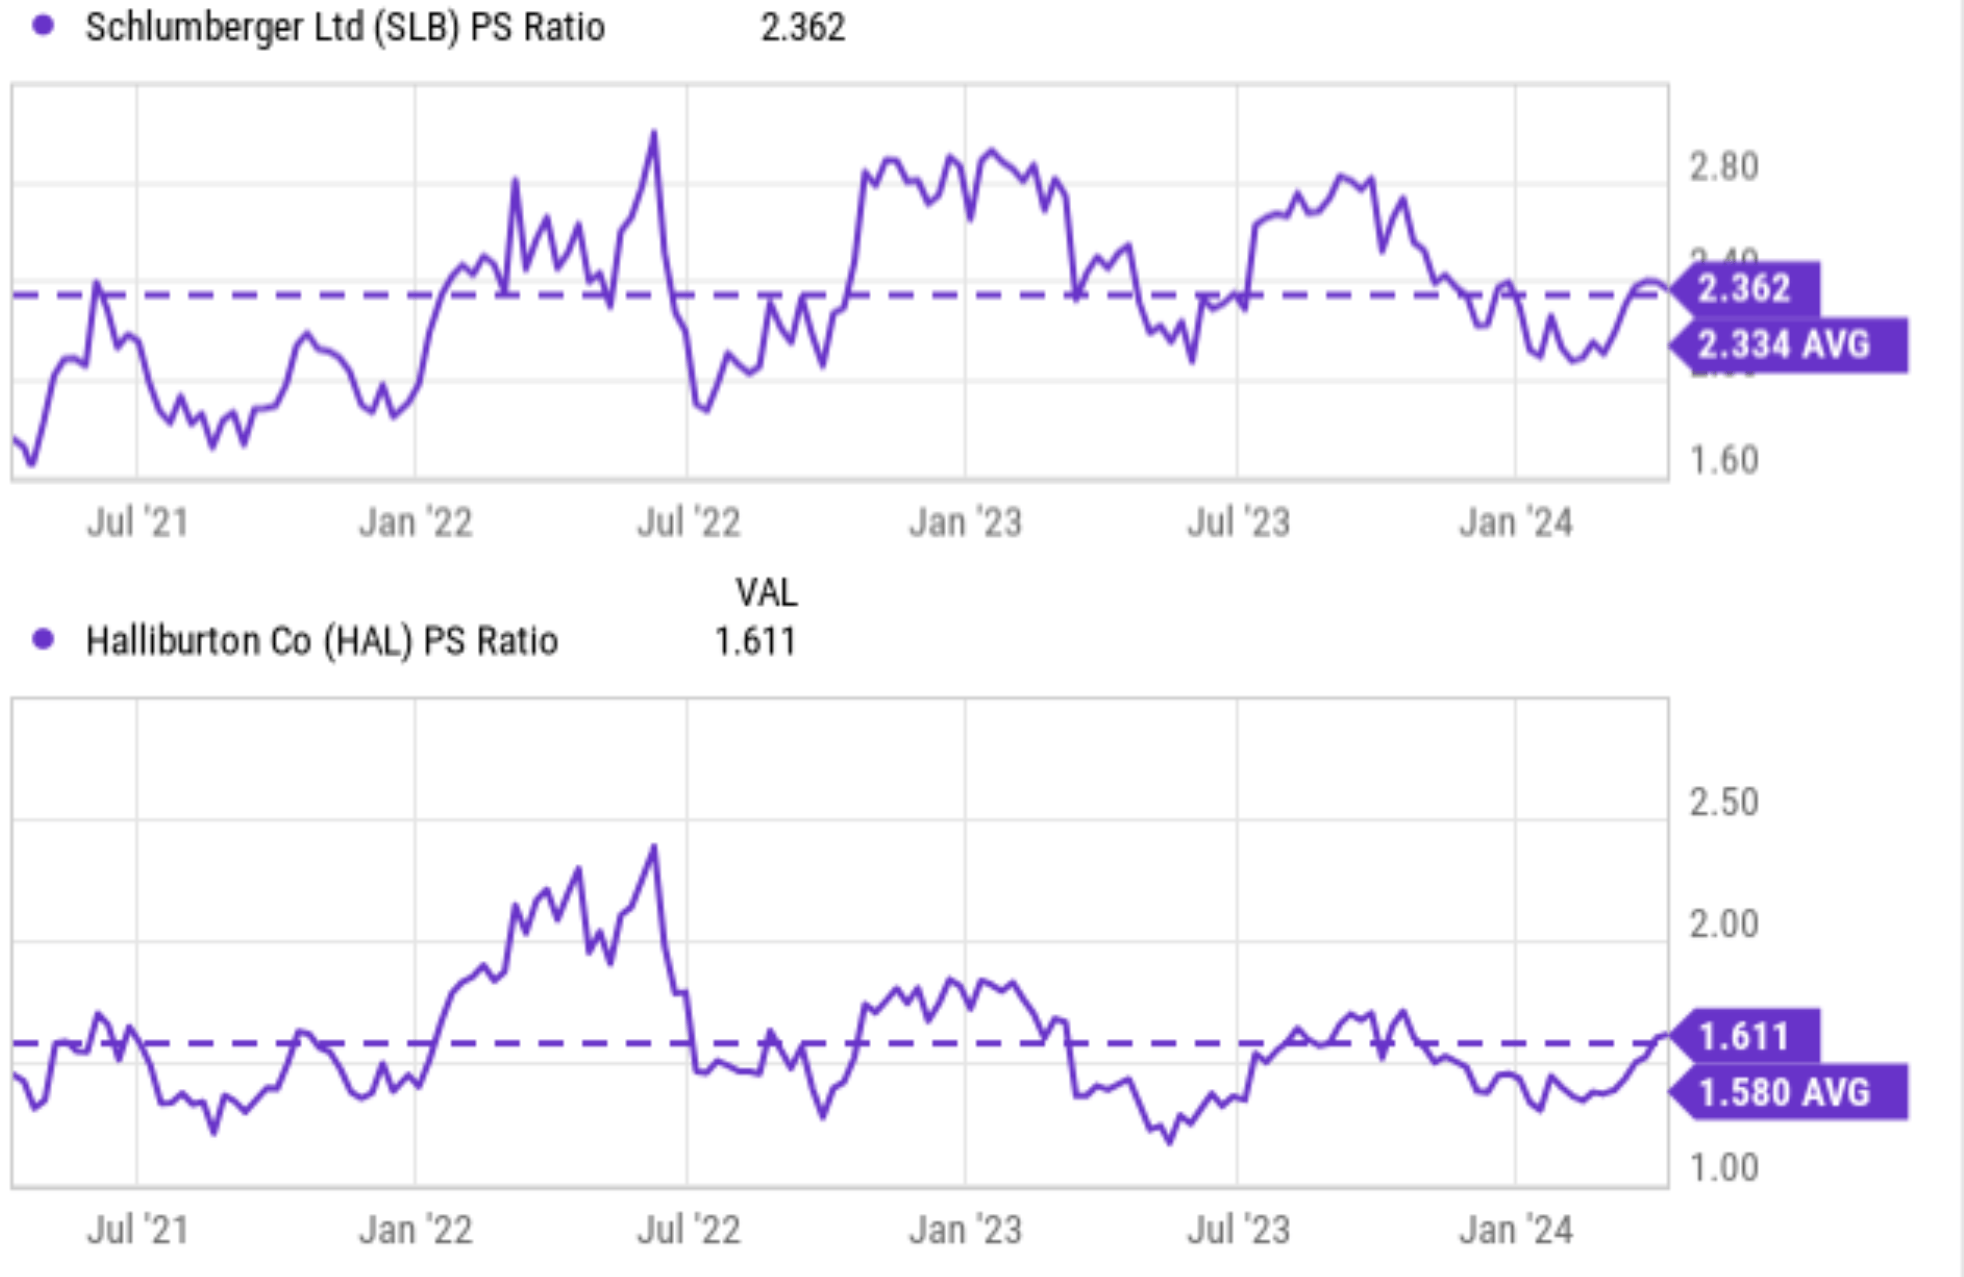
Risks, expected returns, and final thoughts
All the stocks discussed above and XLE face largely the same set of risks. Price volatility and geopolitical risks are the top two in my mind. Energy commodity prices, especially oil, can fluctuate wildly. This volatility can lead to big swings in the stock prices of companies that produce or rely on these commodities, as seen in the charts above. The energy sector is also heavily influenced by geopolitical events, especially in regions with major oil reserves like the Middle East and Russia. The duration and out of the current instabilities in these regions is ultimately unpredictable.
For investors interested in sub-sectors, there are risks more peculiar to each sub-sector. To recap, my view is that integrated producers such as XOM and CVX are well-rounded and best suited for more conservative investors. Refineries face more uncertainties and also more valuation risks. Service stocks can be viewed as a leveraged bet and thus create even more extreme volatility risk – both in the upward and downward directions.
All told, I am bullish on the overall sector represented by XLE. The sector is trading at an average FY1 P/E of 13.5x as seen in the first chart below, not even ½ of the P/E of the S&P 500 (about 28x as of this writing). Yet, XLE enjoys about the same profitability measured by ROE as the S&P 500 (both are about 18%). Given the profitability and my outlook for oil prices, I see a much better return profile from XLE than the overall market, as shown in the last chart below.
XLE fund description Author 

As you can tell, our core style is to provide actionable and unambiguous ideas from our independent research. If your share this investment style, check out Envision Early Retirement. It provides at least 1x in-depth articles per week on such ideas.
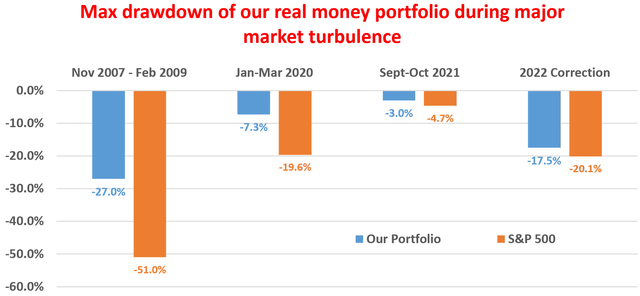
We have helped our members not only to beat S&P 500 but also avoid heavy drawdowns despite the extreme volatilities in BOTH the equity AND bond market.
Join for a 100% Risk-Free trial and see if our proven method can help you too.