J Studios/DigitalVision via Getty Images
This is a follow-up to my article in November, Where is Gold Going? Watch Sentiment, Not Fundamentals. The data shows the flaws in conventional wisdom regarding the effects of inflation, Fed policy, and the dollar on gold prices.
On the contrary, Robert Prechter’s “The Socionomic Theory of Finance” offers a compelling explanation for gold’s price movements. More specifically, I am referring to sentiment. SA’s Avi Gilburt, arguably the world’s leading Elliott Wave practitioner, has also written about this topic. Many months ago while gold was grabbing few headlines, Mr. Gilburt was calling for $2,400 gold as his next price target, a level recently achieved.
My article demonstrated that the Commitment of Traders (COT) Report has an excellent track record over the past ten years in signaling major turns. It accurately signaled the last four major gold price bottoms and the last three tops.
Here we review the current COT data and explore what it might tell us regarding gold’s direction. We will also explore recent media coverage for additional clues.
Why the COT Report Is a Useful Gauge of Gold’s Price Direction
For those of you who haven’t read my last article, here’s a recap. The COT report shows the long and short gold futures trading positions of non-commercial and commercial traders. The former are speculators, i.e. those buying purely for investment returns. The commercial traders are producers, typically mining companies.
Prechter’s Socionomic Theory of Finance book, Chapter 17, explains the rationale as to why these data may be useful:
Small speculators are typically on the wrong side of the market at the turns. You might think that large speculators, because they have a lot more money, are right a lot, but they are likewise usually wrong at the turns. Commercials are the only participants in commodity markets who generally buy low and sell high. As noted in Chapter 13, our financial/economic dichotomy explains the reason: Commercials are in the business of manufacturing, not speculating, so they think economically rather than financially. They do not perceive commodities as investment items, so they are not participating in the herd. They perceive commodities as economic goods, so they search out bargains, just as a consumer does in a store. As a result, they are comfortable taking the other side of a trade from speculators at market extremes. If they think a price is exceptionally low, they might even buy futures contracts to lock in the current price and they may sell excess contracts later at a high price.”
My last article tested Prechter’s theory as it applies to gold traders’ activity. The data depicted in the tables below show what happened after trader extremes, based on number of trade positions as a gauge of sentiment. The results are rather eye-opening.
Author, Kitco Author, Kitco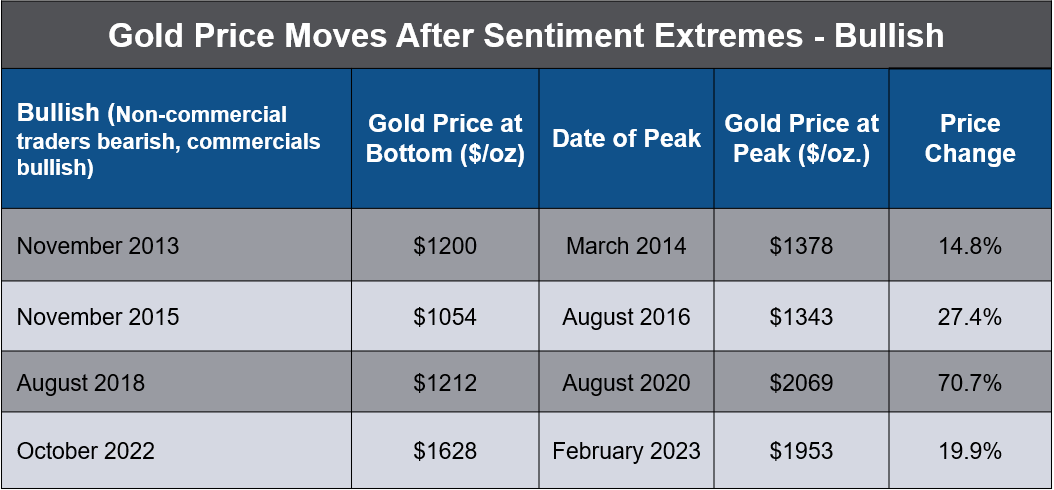

The data show that when the commercials were very bullish and non-commercials (speculators) were very bearish, gold went up. When the commercials were very bearish and the speculators very bullish, gold went down. The data show that gold gained between 15-71% after strong buy signals and declined 6-18% after strong sell signals.
The only blemish was an early (by five months) top signal in March 2020. The early false signal from the commercials could be explained by their desire to ensure cash flows to fund operations at the onset of the pandemic. Due to lockdowns, miners were unable to carry on operations at usual production levels, forfeiting revenue.
Current Gold COT Report: We Haven’t Yet Reached a Major Top, But Caution Ahead
Now let’s turn to the most recent data. The chart below shows the most recent COT report.
Tradingster.com, Author Edited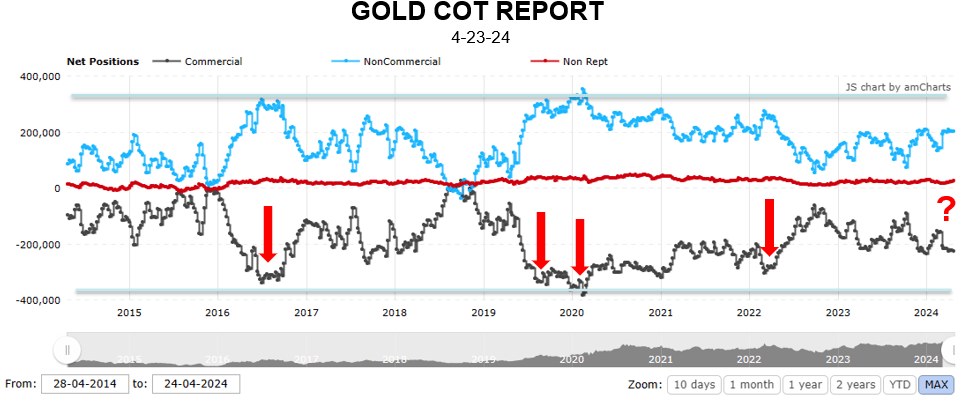
The current net long position (203K contracts of 100 ounces) of the speculators (non-commercials) is elevated. Yet, it is still well below the peaks that occurred at tops in 2016, 2019, 2020 and 2022. Similarly, commercial traders’ net short positions (227K contracts) are well above the bearishness they displayed at previous gold price tops. During those occurrences, the long/short differential between bullish speculators and bearish commercials was on the order of 650-700K contracts. However, the most recent reported differential was well below that, at about 430K contracts.
This suggests gold has more upside. However, the diverging trend lines of the two trader types have reached one of the highest spreads since the March 2022 gold top (558K contracts), signaling caution near-term.
A Rash of Recent Bullish Gold Articles Suggests Frothiness
Another sign of sentiment appears in the financial media. I did a Bing search using ChatGPT looking for bullish gold articles in April. It generated a long list. Besides numerous secondary outlet stories, there have been notable bullish pieces from very popular media sources. Here is a sampler:
- Bloomberg: “Bullish Gold Wagers Swell as Funds Climb Aboard Record Price Run”
- CBS News via MSN: “Should You Invest in Gold Before the Fed’s April Meeting?”
- Financial Times: “Gold is Back – And it Has a Message for Us”
- NASDAQ: “Why Gold Will Go Even Higher”
- FXStreet: “Gold Targets $3,000 Amid Geopolitical Tensions”
Such sentiment should raise the antennae of any good contrarian. Mark Hulbert, the veteran researcher/financial markets author, has been tracking gold sentiment among newsletter writers for over 25 years. In early April, he reported that gold market timers were at the 98th percentile of bullishness. Hulbert views this as a strong contrarian indicator.
There have been nine articles on SA so far this month. All rated GLD buy or hold. A few called for a near-term correction. All but one of the analysts looked at fundamentals such as the economy, interest rates, inflation, debt and the dollar. Several cited geopolitical forces, highlighting recent global turmoil in the Middle East and the ongoing Russia-Ukraine war. Yet, I demonstrated in my last article that these indicators were unreliable at best and useless at worst.
However, Michael James McDonald wrote an excellent piece, Why The Gold Rally Is Probably Stopping Here, emphasizing the importance of sentiment. He showed many good metrics, including what appears to be a homemade interpretation of the COT data. The author draws similar conclusions as I have stated here regarding the near-term and long-term outlook.
Limitations
As I warned in my last article, although the COT report provides a useful sentiment gauge, there are a limited number of data points. And it’s hard to say what levels provide actionable and reliable trading signals.
Similarly, indicators such as newsletter and media bullishness have limitations. They can serve as markers as to the general state of sentiment but using them to pinpoint price turns to inform trading is hazardous. Alternatively, those making near-term buy and sell decisions may wish to view these data in conjunction with other tools such as Elliott Wave analysis, particularly from authorities such as Avi Gilburt.
Conclusion
Sentiment, as measured by the COT report and recent media coverage, suggests gold may be due for a significant correction. However, the data do not yet signal a major top. As always, traders should be cautious. None of these indicators are foolproof. While such data may be useful as a contributor to help inform near-term portfolio decisions, in my view they are not reliable trading tools.
Nonetheless, as I’ve written in numerous SA articles about gold and all-weather portfolio construction, I am a firm believer in gold as a solid long-term holding in a diversified portfolio.
I look forward to your comments.