Monty Rakusen
The Industrial Production and Capacity Utilization Report, corresponding to activity during the month of June 2024, was published by the U.S. Federal Reserve on July 17, 2024, at 9:15 AM. This report is widely considered to provide some of the best indicators of the production of goods in the U.S. economy that are available at a monthly frequency.
According to the U.S. Federal Reserve, total industrial production grew by +0.64% on a Month-on-Month (MoM) basis. This was +0.34% greater than the median forecasted growth of +0.30%.
The question now is: Based on a thorough analysis of the consumer Industrial Production data, and the initial market reactions to it, should investors make any adjustments to their economic forecasts, and/or to their investment strategies?
The right answer is never an obvious one. Success in investing largely depends on finding difficult-to-obtain information and/or insights that supply an informational and/or analytical edge. This requires both diligence and skill. Our method, focused on five key questions, helps us generate an edge from analyses of just-released economic reports:
Was there any surprise?
What caused the surprise?
Did the surprise alter the macroeconomic outlook?
Is anything in this report being misunderstood or overlooked?
Has the initial market reaction given rise to any actionable opportunities?
In this article, these questions will be addressed as we walk readers through a four-step process. First, we will perform a comprehensive analysis of the just-released report. Second, we will update macroeconomic forecasts, based on this analysis. Third, we will adjust our investment assessments of major asset classes. Finally, we will deliver actionable insights that will enable readers to capitalize on our analysis.
Headline Data & Analysis
We begin our analysis of the Industrial Production Report by reviewing the summary information highlighted in Figure 1. We recommend that readers pay particular attention to the percent rank of Month-on-Month (MoM) growth, MoM acceleration, and the surprises relative to forecasts.
Figure 1: Change, Acceleration, Expectations, and Surprise
Industrial Production & Capacity Utilization (Federal Reserve & Investor Acumen)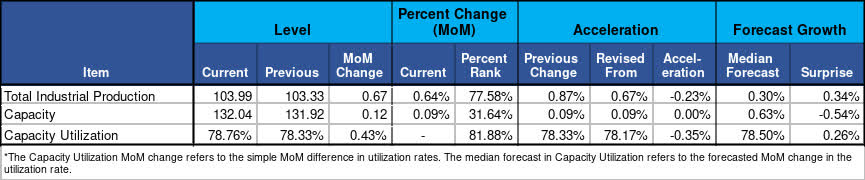
Total Industrial Production grew by +0.64%, which ranks in the 78th percentile. This string performance represents a deceleration of -0.23% compared to the prior month's even stronger growth of +0.87% (revised up from +0.67%). The reported growth this month was an upside surprise compared to the median forecast of +0.30%.
We will now proceed to our detailed analysis of the Industrial Production data.
A Deep Dive Into The Industrial Production Data
In this section of our report, we will walk our readers through a comprehensive analysis of the latest Industrial Production data. The analysis is broken down into two subsections: 1) Rates of change and momentum of the components, and 2) Attribution analysis. Our goal in this section is to pinpoint the specific causes of any major accelerations and to uncover anything which may have been misunderstood or overlooked by market participants.
Rates of Change and Momentum of Industrial Production
Industrial Production data can be broken down in three different ways: by Industry Group, Market Group, and by Stages. In Figure 2 we take these breakdowns and display their annualized growth rates and respective historical percentile ranks over various time frames (1m, 3m, 6m, and 12m). The objective of this analysis is to compare the growth rates of different components and to compare growth rates across different time frames.
Figure 2: Annualized Growth Rates of Key Components
3 Breakdowns of Annualized Returns (Federal Reserve & Investor Acumen)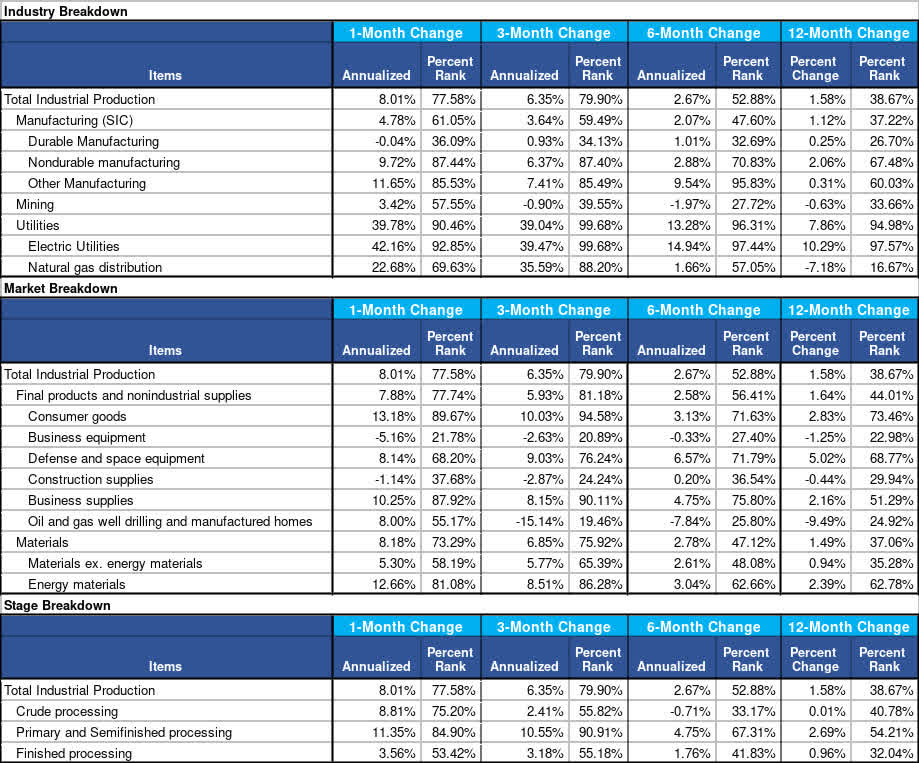
Strength and momentum of overall growth. As can be seen in Figure 2, overall industrial production growth, on a 3-month annualized basis (+6.35%), remained above the historical median (80th percentile), with a strong rate of change data (78th percentile) for the most recent month. It is also significant to note that the 3-month annualized growth rate of industrial production has accelerated relative to the 6-month annualized growth rate of +2.67% (53rd percentile).
Due to the strong showing in June, the 3-month annualized growth rate of the manufacturing sector also accelerated, but its percent rank (60th percentile) was significantly below that of Total IP. Utilities have shown massive strength, with a 3-month annualized growth rate of 39.04% (100th percentile). Utilities have been a major driver of overall Industrial production growth; this aspect is likely not sustainable.
Attribution Analysis: Change and Acceleration of Industrial Production
In Figure 3, we perform a decomposition analysis of the MoM growth in Industrial Production according to three different ways of breaking down the data into different economic categories.
Figure 3: Contributions of Components to Change and Acceleration
3 Breakdowns of Component Contribution (Federal Reserve & Investor Acumen)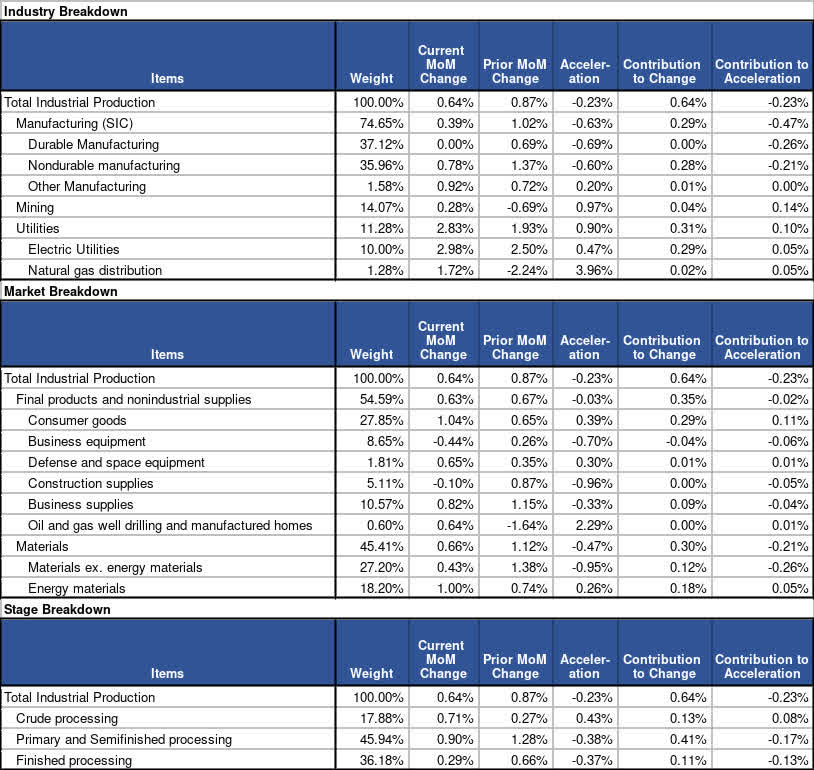
As can be seen in Figure 3, the MoM rate of change in total IP this month (+0.64%) decelerated by -0.23% compared to the prior month (+0.87%). The deceleration is attributable mostly to manufacturing, with -0.47% coming from this sector. The Durable manufacturing category was the largest contributor within manufacturing (-0.26%). Acceleration in Mining and Utilities offset this strong deceleration in the manufacturing sector.
Looking at the Market Breakdown, you can see that Materials ex. energy materials were a massive contributor to deceleration at -0.26%.
U.S. Economy Outlook
In this section, we address the following question: Based on our comprehensive analysis of the just-released Industrial Production data, what (if any) changes should we make to our macroeconomic forecasts and/or our overall outlook for the U.S. economy?
Updates to U.S. Economic Forecasts
Let's begin with a brief review of forecasters' expectations leading into this report. The median forecast of professional economists expected to report that IP grew at +0.30% during the most recent month (56th percentile). Assuming that this forecast had been entirely correct and that there were no revisions to prior data, the 3-month annualized change of IP would have been a +3.62% growth rate, a result that would have ranked in the 60th percentile historically.
As it turns out, the reported data (including the figures for the most recent month and revisions to prior months) surprised to the upside and indicated that IP grew at a 3-month annualized rate of +6.35%, a rate of change which ranks in the 80th percentile historically. This represents a significant increase in the estimate of IP during the past three months. It also represents a major acceleration in growth compared to the prior three months.
Update of the Overall Outlook for U.S. Economy
Currently, the overall outlook for the U.S. economy is dominated by whether the U.S. economy will achieve a "soft landing." How does our thorough analysis of the just-released Industrial Production data impact the analysis of this question?
The prospect for a soft landing was supported by the industrial production data. A wide array of data showed that the U.S. economy slowed substantially in April and May. Data in June have been better, including yesterday's retail sales report, as analyzed here. The strong Industrial production data allays fears that the economy was slowing too fast. Industrial production growth has accelerated from a below-average pace to an above-average pace in the past three months.
Market Outlook
On the margin, the strong industrial production data decreases any plausible urgency for a Fed rate cut. This should be negative for bonds. However, this will not be enough, by itself, to derail the ongoing Treasury rally on a multi-week or multi-month view.
The outlook for equities is more complicated. Industrial production growth stabilizing at an average rate reduces recession risk and associated risk to earnings. However, to the extent that rate cut expectations are moderated, this is a negative for equities at the margin. The macro environment for equities is not at all bad, but valuations are pricing in extremely optimistic scenarios for both interest rates and earnings.
Concluding Thoughts
We have been positioning our portfolios in a manner that accounts for various risks. First and foremost, we are positioning our portfolios for the risks of severe oil price shocks, particularly in the second half of 2024. In this context, we believe that very extraordinary opportunities are going to emerge in the second half of 2024.
If you are really serious about improving your investment performance -- during this historic moment that is providing once-in-a-decade opportunities -- I highly recommend that you subscribe to Successful Portfolio Strategy. This service is designed to empower you to become a successful strategic manager of your investments. It has rarely been as important as it is now to have a winning portfolio strategy approach. Now is the time to be proactive and take decisive action.