da-kuk
Global stock markets were mixed in the second quarter, with U.S. Large Cap growth stocks continuing to march to their own beat, U.S. Small Cap stocks declining, and International stocks treading water. Economic growth in the U.S. has been resilient, while Europe and Japan have been softer. Inflation is stable, labor markets are easing (but still tight), and global trade is starting to rebound. Geopolitical risks remain high. Speculation is widespread with growth continuing to outperform value year-to-date across the board. Fortunately, one thing is always true about stock markets: trends don't last forever, and inflection points typically happen when investors least expect them.
Our second quarter performance commentary is outlined below:
FMI Small Cap Equity
In the second quarter, the FMI Small Cap Strategy declined by approximately 3.8% (gross) / 4.0% (net), compared with a 3.28% and 3.64% drop for the Russell 2000 Index ("Russell 2000") and Russell 2000 Value Index ("Russell 2000 Value"), respectively. Relative to the Russell 2000, FMI's top-performing sectors included Electronic Technology, Retail Trade, and Technology Services while Producer Manufacturing, Distribution Services, and Commercial Services each underperformed. Strong individual contributors included BJ's Wholesale Club Holdings Inc. (BJ), Skechers U.S.A. Inc. - Cl A (SKX), and Fabrinet Inc. (FN) as Fortune Brands Innovations Inc. (FBIN), Simpson Manufacturing Co. Inc. (SSD), and Henry Schein Inc. (HSIC) lagged the market. Small Cap stocks continue to fall behind their Large Cap counterparts thus far this year.
FMI Large Cap Equity
In the second quarter, the FMI Large Cap Strategy lost approximately 0.2% (gross) / 0.3% (net), compared with a 4.28% gain and a 2.20% decline for the S&P 500 Index (S&P 500) and iShares Russell 1000 Value ETF[1], respectively. Growth outperformed value by over 10% in the period, driven in large part by just a select few Mega Cap technology stocks. Relative to the S&P 500, sector performance was driven by Health Technology, Consumer Services, and Consumer Non-Durables, while the strategy gave up ground in Electronic Technology, Retail Trade, and Distribution Services. Individual holdings Alphabet Inc. - Cl A (GOOG,GOOGL), Booking Holdings Inc. (BKNG), and Micron Technology Inc. (MU) outpaced the market, as CarMax Inc. (KMX), Masco Corp. (MAS), and Dollar Tree Inc. (DLTR) detracted.
FMI All Cap Equity
In the second quarter, the FMI All Cap Strategy dropped approximately 0.4% (gross) / 0.6% (net), compared with an increase of 3.12% for the iShares Russell 3000 ETF1. Relative to the iShares Russell 3000 ETF, sectors that benefited performance included Consumer Non-Durables, Health Technology, and Consumer Services while Electronic Technology, Distribution Services, and Commercial Services were a draw from performance. BJ's Wholesale Club Holdings Inc., Koninklijke Philips N.V. ADR (PHG), and Skechers U.S.A. Inc. - Cl A were a boost to performance, while Robert Half Inc. (RHI), CarMax Inc., and Masco Corp. trailed the market.
FMI International Equity
In the second quarter, the FMI International Strategies fell approximately 1.4% (gross) / 1.6% (net) on a currency hedged basis and 2.2% (gross) / 2.4% (net) currency unhedged, compared with the iShares Currency Hedged MSCI EAFE ETF1, the iShares MSCI EAFE ETF1, and the iShares MSCI EAFE Value ETF1 gain of 1.94%, loss of 0.19%, and gain of 0.32%, respectively. Relative to the iShares MSCI EAFE ETF, the International Strategies' Consumer Services, Consumer Non-Durables, and Health Technology sector exposures were a tailwind for performance, while Retail Trade, Distribution Services, and Transportation weighed on the results. Koninklijke Philips N.V., Unilever PLC (UL), and DBS Group Holdings Ltd. (OTCPK:DBSDF) performed well in the quarter, while B&M European Value Retail S.A. (OTCPK:BMRRY), Ferguson PLC (FERG), and Ryanair Holdings PLC ADR (RYAAY) failed to keep pace. USD strength was additive for the currency hedged portfolio.
Narrowing and Harrowing
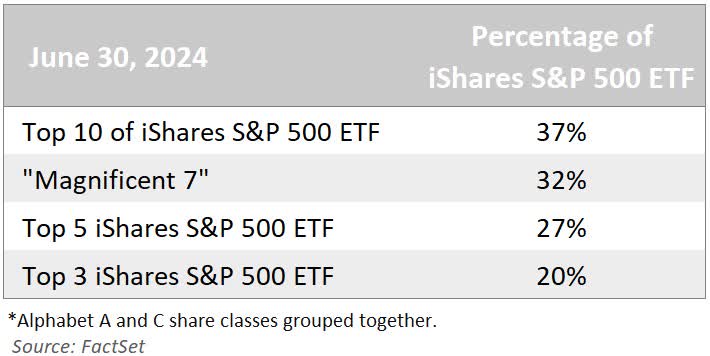
In the U.S., the Large Cap universe continues to be dominated by just a handful of anointed stocks. Today's concentration of the S&P 500 (SP500,SPX) is unprecedented. The top 10 stocks make up 37% of the iShares S&P 500 ETF (IVV). For comparison, at the peak of the 2000 tech bubble, the top 10 accounted for about 25% of the index. Performance of the S&P 500 this year has been similarly lopsided. Of the 15.29% year-to date return for the S&P 500, an astounding 30% has come from Nvidia (NVDA) alone, with 58% from Nvidia, Microsoft (MSFT), META Platforms, Amazon (AMZN), and Alphabet (GOOG,GOOGL). The S&P 500 Equal-Weighted Index trails the S&P 500 (market-capitalization weighted) by 10.21% this year, after losing by 12.42% last year, further illustrating the lack of breadth in the market. Historically, extremely narrow markets have been a harbinger of tougher stock markets to come. This time may be no different.
We marvel at the unwavering euphoria encompassing Nvidia's stock. In under 30 trading days ending June 18, 2024, Nvidia added $1.1 trillion to its market cap. In the 6 months prior, it added over $2.0 trillion, larger than the entire market cap of Amazon! Nvidia briefly became the world's most highly valued company, worth as much as $3.3 trillion, exceeding the value of the entire UK, German, and Canadian stock markets, respectively. Nvidia is a key beneficiary of the generative artificial intelligence ('AI') craze, selling expensive AI chips into data centers, with over a 70% market share. Large cloud computing providers such as Microsoft, Amazon, and Google account for almost half of Nvidia's data center revenue. Over the long-term, Nvidia's rapid growth and high margins will attract increased competition, including from some of their biggest customers, which may weigh on future growth rates and returns. Expectations are high, as Wall Street currently projects Nvidia's sales to increase at nearly 7-fold over the five years from 2022 through 2027, with earnings per share growing 14-fold. At a valuation of 39 times sales and 69 times trailing earnings, the margin for error is narrow.
While we certainly acknowledge the vast possibilities of generative AI, and we remain in observation mode, it appears that the hype is at a fever pitch. Sequoia Capital, one of Silicon Valley's biggest start-up investors, warns of an "AI bubble" and "speculative frenzies." On an annual run-rate basis, Sequoia estimates that there is over $180 billion of data center AI spend as of the first quarter of 2024, increasing to a whopping $300 billion by year-end. There is little AI revenue to show for all this spend, with OpenAI thought to have the lion's share of generative AI revenue today, at only $3.4 billion. Sequoia estimates $600 billion of revenue would be required annually to payback the projected spending levels. We have yet to see blockbuster products get launched (admittedly, it is still early days), but the buzz reminds us of driverless cars and the metaverse in recent years. Both have come up well short of very lofty expectations. Another thing to consider is that the cost to run generative AI queries is extremely high, as the power requirements are substantial. Eventually, this will get factored into revenue and profit models. If companies do not ultimately see adequate sales, productivity, earnings, and returns on capital from their investments, AI expenditures should slow. Only time can tell.
Anecdotes of Exuberance
Unfortunately, the speculative fervor is not confined to Nvidia, AI, and Mega Cap technology. Other top-performing themes in the U.S. include Bitcoin sensitive equities, obesity drugs, and high beta 12-month winners (i.e., momentum stocks), according to Goldman Sachs. On May 16, penny stocks also captured investor imaginations, as it was reported that 45% of the total market volume traded was in less than $1 stocks, which compares to a year-to-date average of ~12%. Additionally, meme stocks are back in vogue, with low-quality GameStop (GME) up 97% over the last three months on the heels of an endorsement from social media investment influencer "Roaring Kitty" (no, this is not a joke). GameStop currently has a market cap of $10.2 billion, yet lost money from 2019-23, with projected sales in 2024 at about half of where they were in 2017. Clearly business fundamentals are not driving the story.
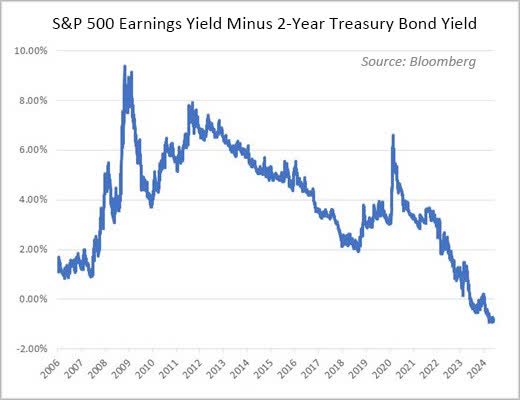
Complacent, risk-seeking behavior can also be found in the spread between the S&P 500 earnings yield (earnings/price) versus the 2-year Treasury bond yield (US2Y, risk-free yield). For the first time in over 20 years (since the 2000 tech bubble), the spread has turned negative, suggesting that investors are no longer requiring a sizeable risk premium (i.e., higher earnings yield) for investing in equities vs. risk-free bonds. The current reading of -0.8% is over two standard deviations below the long-term average spread of 3.9%.
Lastly, with growth stocks sucking the air out of the room, it was not surprising to read that "Investors poured a net $8.7 billion into U.S. tech funds over the seven days through Tuesday [June 18, 2024] per data from EPFR, the largest weekly inflow on record. Growth-oriented mutual funds attracted upwards of $10 billion over the same stretch, likewise its most bountiful week since at least 2017," according to Almost Daily Grant's. When the good times are rolling, investors rarely contemplate whether the music will stop. Aggressive buying near the top is all but guaranteed. These recent fund flows remind us of three famous Warren Buffet quotes, all of which may prove valuable as the current cycle unfolds:
- "What the wise man does in the beginning, the fool does in the end."
- "Be fearful when others are greedy, and greedy when others are fearful."
- "Most people get interested in stocks when everyone else is. The time to get interested is when no one else is. You can't buy what is popular and do well."
Greed is running rampant as the herd rushes into today's popular trades. All roads appear to lead to technology and growth stocks … until they don't. Eventually this cycle, too, shall pass.
Small Cap: Quality Wins
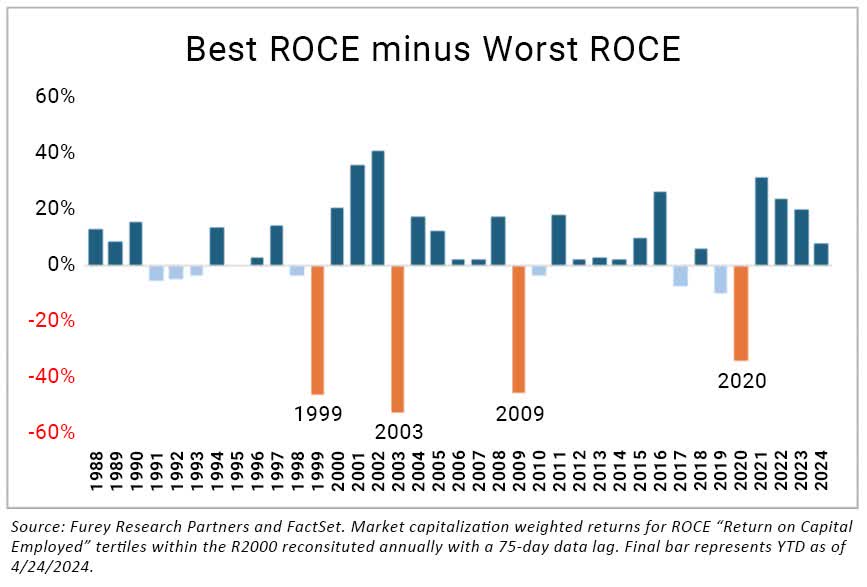
Our focus on quality has really paid off in recent years. A 15year period of interest rate suppression induced a massive wave of M&A, significantly shrinking the number of quality Small Cap companies. The Russell 2000 has been left with over 40% of its constituents losing money. As illustrated in the chart to the right, quality companies (high return on capital employed, or ROCE) in the Russell 2000 win over the longterm. While lower-quality stocks have outperformed from time to time (most notably in 1999, 2003, 2009, and 2020), the duration is typically short-lived.
When looking for a combination of quality and liquidity, we estimate that only about 20% of the Russell 2000 both make money and are liquid, so buying quality in the current environment has become more challenging. As a result, FMI and many of our peers that also focus on quality, have been investing in modestly higher market capitalizations. By simply expanding the investable universe to the Russell 2500, for example, it roughly doubles the number of profitable, liquid companies.
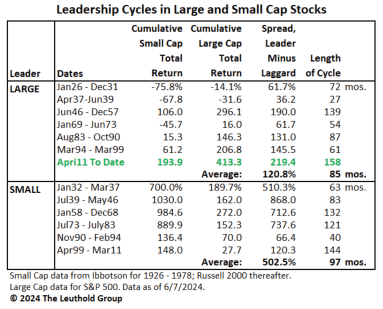
As illustrated above, during the current cycle, U.S. Small Cap stocks have underperformed their Large Cap counterparts for the longest stretch (158 months) and largest spread (-219.4%) on record. Some of this gap is warranted, as rising interest rates and wages have negatively impacted Small Cap companies more (a higher percentage of floating rate debt, shorter debt maturities, and more labor-intensive businesses). Additionally, the quality of the Small Cap universe has deteriorated in recent years, as mentioned above. Even with these stark realities, the current valuation spread is still very wide by historical standards. Profitable Small Cap companies now trade near the lowest level to profitable Large Cap companies in over 20 years. If history is any indication, there will be brighter days ahead for Small Cap.
Japan: Cart Before the Horse
The Japanese stock market is off to a blistering start this year, with the Nikkei 225 up 19.30%, outpacing even the tech-driven S&P 500. This has been a meaningful headwind for our International Strategies' relative performance, given that we have a 16% underweight in Japanese stocks vs. MSCI EAFE. Gains in Japanese equities have been boosted by positive sentiment around improving corporate governance (which we view as modest and incremental in nature), the exit from a deflationary spiral, and profit tailwinds for exporters that are benefiting from a collapse of the Japanese yen (weakest vs. USD since 1986).
We question whether the Japanese market has gotten a bit ahead of itself, as Japan now trades at a healthy premium to Europe. After its recent run, the Nikkei 225 (NKY:IND) trades at around 20 times next-twelve-months price-to-earnings versus the STOXX 600 at 14 times, despite having a significantly lower return profile. The return on equity ('ROE') for the Nikkei 225 stands at 8.3% versus the STOXX 600 at 11.7%, according to Bloomberg. It's also worth mentioning that over 50% of the Nikkei 225's revenue is generated in Japan, where they have an aging and shrinking population, extremely low average birth rates (1.2), the developed world's largest government debt load, and expectations for slower GDP growth than Europe in the coming years. Japan's GDP declined 2.9% in the first quarter of 2024, amid sluggish consumption. We question the level of enthusiasm for the Japanese equity market and have yet to see many compelling bottom-up fundamental opportunities. We will continue to actively research new candidates in Japan but remain prudent.
As described above, the speculative backdrop across today's global markets is extreme, with growth beating value handily. Over short periods of time, stock markets can reward stocks, sectors, and even countries regardless of the underlying fundamentals. When a stock or theme has momentum, people are quick to jump on the bandwagon. As investors capitulate and all but give up on value, it makes us even more excited about the future. Value investing has a 100+ year track record of outperformance and we are confident it will be back on top before long.
Listed below are a few portfolio investments where the long-term prospects are compelling:
Henry Schein Inc. (HSIC) - Small Cap/All Cap
Henry Schein is the largest dental distributor in the world, holding a leading market share position in all of its main geographies, and is also a leader in medical distribution. Henry Schein provides value to both product manufacturers and its customers. Manufacturers benefit from cost effective access to a highly fragmented customer base, as well as sales and marketing support for products. Practitioner customers benefit from timely access to a broad range of products, a reduction in the number of vendors they need to deal with directly, inventory management services, and equipment servicing. Henry Schein also sells practice management software that is used by ~40% of dental practices in the U.S., which is a very sticky business. We expect continued strong long-term growth in spending on dental services, which will be driven by an aging population, along with a focus on preventive care and demand for cosmetic dentistry procedures. Schein's stock has been under pressure in the near term because it is still recovering from a cyber-attack that took place late last year, and the macro backdrop continues to be challenged, which has led to muted elective/discretionary sales across the business. The stock is trading well below the market, which we view as attractive given its above-average business quality.
Quest Diagnostics Inc. (DGX) - Large Cap/All Cap
Quest Diagnostics is one of the largest independent clinical laboratory testing companies in the U.S. with a 24% market share of independent lab testing, and its scale gives it a cost advantage. The clinical testing industry sees steady volume growth, helped by increasing test volume due to an aging population, higher prevalence of chronic disease, and advancements in medical technology that continue to expand the scope of clinical testing.
The broader lab industry is an $85 billion market, accounting for only 2% of total healthcare spending, yet influencing over 70% of medical decisions. Today, nearly 60% of diagnostic tests are performed in a hospital or at a hospital outreach laboratory. Importantly, performing the same diagnostic test at an independent lab can cost anywhere between two and five times less than performing the same test in a hospital lab. Quest's average revenue per requisition is under $50. There is a nationwide focus on increasing preventative healthcare and lowering healthcare costs in general. Independent labs are part of the solution, as there is a huge value to be reaped by pushing more volumes through them. In the past, Quest has seen reimbursement challenges from both government and commercial payors. We believe that reimbursement headwinds have largely abated due to all payors recognizing the large cost benefit of higher volumes flowing through the independent labs. We expect Quest to generate mid-single-digit topline growth and expand margins, leading to high-single-digit earnings growth. With Quest's dividend and share repurchases, there are prospects for a low-double-digit total annual return, which is attractive given the defensive nature of the business and well-below market valuation.
Ryanair Holdings PLC-SP-ADR (RYAAY) - International
Ryanair is Europe's largest airline by passenger volume (~20% market share). It employs a very simple, yet unique business model. It flies only point-to-point, books flights almost solely through its website/app, heavily utilizes secondary airports, flies a single-variant fleet, and has a widespread geographic distribution (40 countries and 96 bases), which helps mitigate the impact of strikes or unfavorable regulations that occur in a single geography. Ryanair is one of the only international airlines to post high growth and stellar returns through a full cycle, owing mostly to the company's obsessive focus around efficiency and agility. Ryanair has created a deep cost advantage that allows it to price fares at levels that would be unprofitable for the vast majority of peers, leading to continued market share gains. The current industry setup is favorable, as the European in-service short-haul fleet is in short supply. Elevated storage rates are unlikely to revert due to aircraft age and restoration costs. Additionally, there are supply chain challenges and large backlogs that are limiting the pace of delivery of new planes. Ryanair's mid-single-digit capacity growth is locked in through 2034. Recently, its fares have been a bit softer than expected due to a weak consumer in Europe, and capacity hasn't expanded as quickly as expected due to Boeing delivery delays. We view both issues as transitory in nature. Valuation is well below historical averages and is likely to recover over a 3-5 year time horizon.
Thank you for your continued support of Fiduciary Management, Inc.
| Footnotes 1Source: Bloomberg - returns do not reflect management fees, transaction costs or expenses. Performance is based on market price returns. Beginning 8/10/20, market price returns are calculated using closing price. Prior to 8/10/20, market price returns were calculated using midpoint bid/ask spread at 4:00 PM ET. |
Editor's Note: The summary bullets for this article were chosen by Seeking Alpha editors.
Editor's Note: This article discusses one or more securities that do not trade on a major U.S. exchange. Please be aware of the risks associated with these stocks.