Gary Yeowell
Dear Fellow Shareholders,
We are pleased to provide you with the Third Avenue Real Estate Value Fund's (the "Fund") report for the quarter ended June 30, 2024. For the first half of the calendar year, the Fund generated a return of -1.66% (after fees) versus -3.17% (before fees) for the Fund's most relevant benchmark, the FTSE EPRA NAREIT Developed Index[1].
The primary contributors to performance during the period included the Fund's investments in the preferred equity of the GSEs[2] (Fannie Mae and Freddie Mac) and the common stock of certain U.K.-based real estate enterprises (Big Yellow Group plc and Savills plc). Notwithstanding, these gains were more than offset by detractors in the quarter, including the Fund's holdings of various residential-related businesses (Lennar (LEN), D.R. Horton (DHI), Weyerhaeuser (WY), and Rayonier (RYN)) and U.S.-based industrial real estate owners (Prologis (PLD) and First Industrial (FR)). Further insights into these holdings, portfolio positioning, and the Fund's most recent addition (Wesco International (WCC)) are included herein.
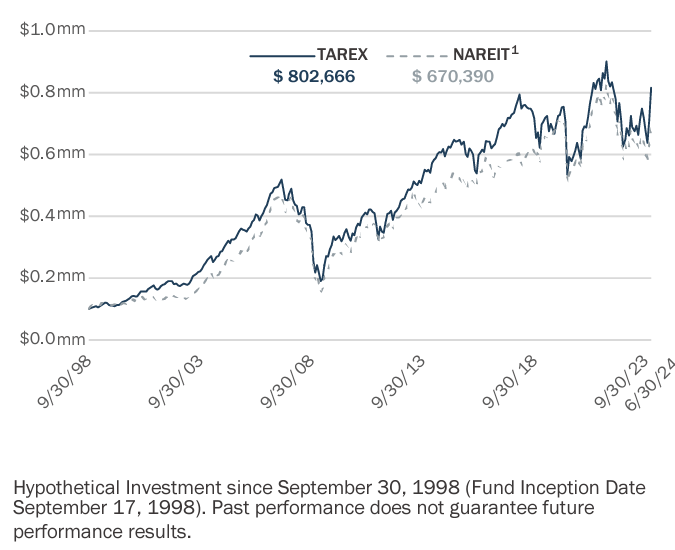
Although the Fund has outperformed its benchmark so far this year, Fund Management continues to believe the strategy's long-term results are the most relevant gauge of performance. To that end, the Fund has generated an annualized return of +8.40% (after fees) since its inception, more than twenty-five years ago. As a result, this performance indicates that an initial investment of $100,000 in the Fund would have a market value exceeding $800,000 (assuming distributions had been reinvested), or more than the same $100,000 would be worth had it been placed into a passive mutual fund tracking the Fund's benchmark over the same time-period.
Value Of $100,000 Since September 1998 (As of June 30, 2024)
Activity
In the International Energy Agency's ("IEA") November 2023 report, Electricity Grids and Secure Energy Transitions, it is noted that "power grids are major pieces of infrastructure" and their expansion is "critical to enable growth as the world deploys more electrical vehicles, heating and cooling systems, and scales up hydrogen production". Notwithstanding, the amount of global investment in electrical grids has largely remained "static" at around $300 billion annually for the past 15 years. Consequently, there appears to be a scarcity of distribution and transmission availability forming in most developed markets with nearly 1,500 gigawatts ("GW") of power projects estimated to be in "grid connection queues"-a number that has likely increased since the report was published given the rapid adoption of Artificial Intelligence ("AI") and the accelerated build out of energy-intensive data centers necessary to support that ecosystem.
As a result, electricity grids are increasingly serving as a "bottleneck" for various secular shifts underway, as well as everyday residential, commercial, and industrial users. Therefore, the IEA estimates that grid investment needs to "nearly double" to $600 billion annually by 2030, with an emphasis on digitalization and distribution, and believes that "robust supply chains" will be "essential" in completing these infrastructure upgrades. While Fund Management recognizes that several factors are likely to prevent this scale of investment from being reached by 2030 (e.g., permitting, capital availability, transformer availability, et al), the direction of travel forms a constructive backdrop for Wesco International ("Wesco"), in our opinion.
Founded more than a century ago, Wesco is a leading provider of commercial distribution, logistics services, and supply chain solutions on a global basis. Originally formed as a subsidiary of Westinghouse Electric, Wesco has now operated independently for the past 30 years and is recognized for its leading positions in the distribution of parts and components underpinning electrical, communications, and utility-related property and infrastructure-a network that was bolstered further through its acquisition of wire and cable distributor Anixter International in 2020.
The distribution business is like most, though-it has its tradeoffs. On one hand, a well-established network can act as a "quasi tax" on goods as they move throughout the supply chain, without the distributor having to take on manufacturing or development risk. On the other hand, the distribution of parts, components, and materials tied to discretionary investments can often be quite cyclical, leading to significant "swings" in working capital as well as obsolete inventories. Therefore, Third Avenue has always favored industry players with (i) entrenched positions within specific product categories, (ii) super-strong financial positions, and (iii) appropriate scale to "cross-sell" products and services to enhance returns in what is otherwise a "low margin" business.
Insofar as Fund Management is concerned, Wesco scores well on all three fronts. Put otherwise, the company has a nearly unmatched portfolio of products and services across its business-to-business distribution network with more than 50,000 suppliers (70% of which provide exclusive product offerings through Wesco) and 150,000 customers (including 90% of Fortune 100 companies). The company is also well-capitalized, with a loan-to-value ratio[3] of approximately 30% and a fixed-charge coverage ratio[4] of more than 4.0 times. In addition, Wesco has leading positions in North America within its Electrical, Communications, and Utility segments in terms of overall market share.
That said, Wesco has yet to realize the full efficiencies it gained through the Anixter acquisition in 2020, in our view, as the company has been operating with excess capital tied up in inventories following the supply chain disruptions stemming from the Covid-19 pandemic. Further, the Anixter transaction was financed amidst extreme volatility in the capital markets in mid-2020, leaving Wesco with debt and preferred equity that is now perceived to be at "above market" rates.
In Fund Management's view, both issues seem likely to be addressed over time though, and in combination would (i) release more than $500 million of working capital and (ii) increase Wesco's free cash flow[5] by nearly 10%, without factoring in any fundamental improvement in the operations or further margin expansion, despite management's plans to boost operating margins by 300 basis points[6]. Such developments could also improve the company's cost of capital as Wesco common currently trades at a double-digit free cash flow yield[7] (when factoring in the anticipated refinancing transactions) as well as a significant discount to its Net-Asset Value ("NAV") when considering transaction multiples in the distribution space-a disconnect that is unlikely to persist, in our opinion, given the durability of Wesco's network and the secular drivers behind its key segments (e.g., grid upgrades, nearshoring, automation, data center investment, et al.).
The Fund also added to its investment in the common stock of Prologis, Inc. ("Prologis") during the quarter. Held in the portfolio in its current iteration since 2020, the company is the largest owner of modern industrial and logistic facilities globally with approximately 1.2 billion square feet of space (on a pro rata basis) that is 97.0% leased and generating nearly $6.0 billion of recurring cash flow each year-placing the value of its stabilized portfolio at more than $100 billion, by Fund Management's estimates.
With such a valuable platform, Prologis is now the largest listed Real Estate Investment Trust ("REIT") by equity market capitalization-and one that is well followed with nearly thirty "sell-side" analysts covering the company and multiples more on the "buy-side". To some, such wide coverage may suggest a lack of opportunity with more "efficient" pricing. However, Fund Management would argue that most of these market participants are only focused on the near-term outlook and would submit the company's most recent earnings results as "Exhibit A" in that regard (i.e., Prologis reduced its guidance by 3% for the year but the stock price declined by nearly 20% in the ensuing days).
To the contrary, Fund Management is much more focused on a company's financial position, the price of its securities, and the issuer's prospects for long-term wealth creation. Through this lens, Prologis remains one of the most compelling opportunities in listed real estate, in our opinion.
That is to say, not only does Prologis have an irreplaceable portfolio that essentially acts as a "toll booth" on the flow of goods globally with approximately 3% of worldwide Gross Domestic Product ("GDP") traveling through its facilities, but the company also has incredibly attractive access to the capital markets with conservative amounts of debt locked in at an average rate of 3.0% for a term exceeding 9 years-a capital structure that would be considered an asset in the private markets.
In addition, the company's stock traded at a meaningful discount to NAV during the quarter, in Fund Management's view, with prices at one point implying less than $160 per square foot for the stabilized portfolio, which represents a 7.5% cap rate[8] (i.e., initial yield) on "market" rental rates and more than a 20% discount to estimates of replacement cost. Prologis also has several drivers to potentially increase the underlying NAV over time, including: (i) realizing the significant gap between its "in-place" rental rates and "market" rates which could yield an additional $2.0 billion of recurring cash flow annually, (ii) further establishing its Essentials platform, primarily by adding "rooftop" solar to its facilities with the potential for 7 GW of capacity relative to the 511 MW of installed capacity today, and (iii) developing out its well-located landbank, which has the potential to accommodate more than 200 million square feet of additional space and is increasingly being utilized to deliver hyperscale data centers given the power access and premium capital values relative to traditional industrial properties.
Along those lines, the Fund now has approximately 30% of its capital invested in companies with some ties to the data center "value chain". As outlined in greater detail within the previous shareholder letter, these holdings primarily include issuers involved with leasing-powered shells (Segro), realizing higher-and-better use opportunities by repositioning land to accommodate data center development (Prologis and Five Point Holdings), providing property management and other services (CBRE Group, JLL, and Savills plc), as well as energy and logistics services (Brookfield and Wesco). However, Fund Management continues to hesitate to allocate capital to "pure play" data center REITs due to the prevailing valuations and other considerations facing legacy owners (e.g., new supply, maintenance costs, obsolescence risk, capital needs, et al.).
During the quarter, the Fund also added to Grainger plc (the largest private owner of rental housing in the U.K.) and Sun Communities, Inc. (the largest owner of manufactured housing, RV parks, and marinas in the U.S.). Conversely, the Fund reduced certain exposures for portfolio management purposes, including those involved with the U.S. residential markets (Lennar, D.R. Horton, AMH, and Lowe's) and various international holdings (Wharf, Segro plc, and Berkeley Group). In addition, the Fund implemented a "collar" around a portion of its position in D.R. Horton, as well as a hedge relating to its British Pound exposure with the U.K.-based holdings accounting for more than 16% of the Fund's capital at quarter end.
Positioning
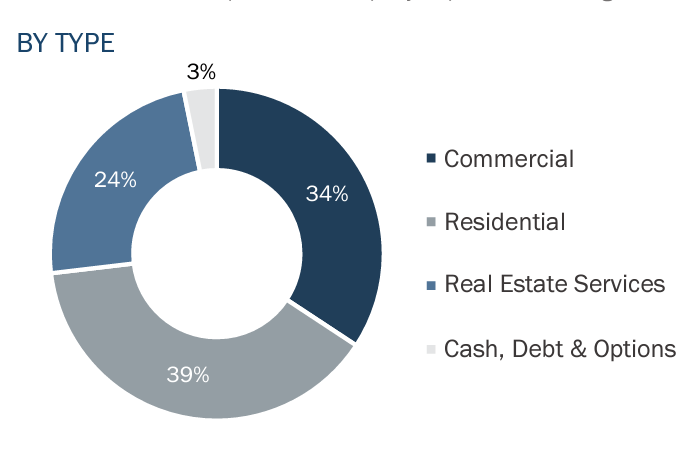
After incorporating this activity, the Fund had approximately 38.8% of its capital invested in Residential Real Estate companies with strong ties to the U.S. and U.K. residential markets-where supply deficits remain after years of under-building. Together with near record-low levels of for-sale inventory, as well as a recent surge in immigration, there remains significant demand for single-family product at affordable price points (both for-sale and for-rent). Therefore, these Fund holdings seem positioned to benefit from durable demand on the rental side, as well as an extended recovery in the construction of new product for-sale, particularly if mortgage rates further subside. At the end of the quarter, these holdings included a diversified set of residential-related businesses including niche rental platforms (AMH, Grainger plc, Sun Communities, and Ingenia Communities), homebuilding (Lennar Group and DR Horton), planned development (Berkeley Group and Five Point Holdings), timberland ownership and management (Weyerhaeuser and Rayonier), as well as other ancillary businesses (Lowe's and Trinity Place Holdings).
The Fund also had 34.2% of its capital invested in Commercial Real Estate enterprises that are involved with select segments of the property markets. At the current time, these holdings are primarily focused on companies capitalizing on secular trends, including structural changes driving more demand for industrial properties, self-storage facilities, and fulfillment (Prologis, U-Haul, Segro plc, First Industrial, Big Yellow, National Storage, and Wesco) as well as more diversified businesses engaged in "long-term wealth creation" (Brookfield Corp., CK Asset Holdings, and Wharf Holdings). In Fund Management's view, each of these enterprises is very well-capitalized, their securities trade at discounts to private-market values, and they seem capable of providing compelling "real" returns-primarily by increasing rents, undertaking development activities, and by making opportunistic acquisitions given their favorable financial positions.
An additional 23.7% of the Fund's capital is invested in companies engaged in Real Estate Services. These real estate-related businesses are generally less capital-intensive than direct property ownership and have historically offered much higher returns on capital over the course of a cycle-provided they have favorable positioning within their respective segments. At the present time, these holdings include franchises involved with brokerage and property management (CBRE Group, Savills plc, and JLL), investment management (Brookfield Asset Management), as well as mortgage and title insurance (Freddie Mac, Fannie Mae, and FNF Group).
The remaining 3.3% of the Fund's capital is in Cash, Debt & Options. These holdings include U.S.-dollar-based cash and equivalents, short-term Treasuries, and hedges relating to certain foreign currency exposures (Hong Kong Dollar and British Pound) as well as individual holdings (D.R. Horton).
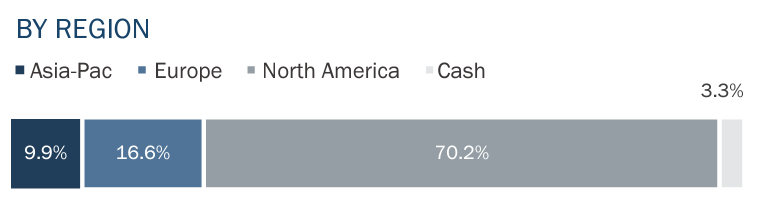
Asset Allocation
As of June 30, 2024| Source: Company Reports, Bloomberg
During the Milken Institute's Annual Conference, one of the participants on the Global Real Estate panel shared a unique take on the evolving investment environment for commercial real estate. More specifically, this private market investor suggested that the last several decades of real estate investing had been similar to "downhill skiing" with declining interest rates (and thus declining cap rates) driving values higher for nearly all property types and markets. Nonetheless, the more recent emergence of a "positive real rate regime" (i.e., nominal interest rates exceeding nominal inflation rates) had shifted the investment environment to one that was more comparable to "cross country skiing" with differentiated returns likely to be driven by skilled operators as opposed to simply being invested in the sector.
Fund Management largely agrees with the premise, particularly as it relates to investing in direct real estate. However, it is our view that a focus on three other factors will also be paramount to navigating the shift to higher "real rates" in the listed real estate markets, including:
- Balance Sheet Strength: Real Estate is generally a capital-intensive business and access to financing on attractive terms offers key advantages. Most notably, well-financed businesses can navigate through more challenging markets, thus preserving value, while also having prospects to make accretive investments when capital is scarce, thereby emerging from challenging periods more valuable. The Fund's capital is therefore concentrated in issuers that are financed with modest amounts of leverage, with the loan-to-value ratio for the portfolio holdings below 15%, on average, at the end of the quarter. Further, the Fund is focused on enterprises that can retain cash flow to reinvest in the business with approximately 70% of the portfolio in Real Estate Operating Companies ("REOCs") as opposed to REITs (which are required to distribute most of the cash flow as dividends). As a result, Fund Management is of the view that the Fund's well-capitalized holdings face significantly less refinancing risk, can self-finance further expansion, and have the resources to make meaningful investments if attractive opportunities arise-which is not the case for a considerable portion of the real estate sector.
- Strategic Exposures: The property markets are currently experiencing a divergence of fundamental performance between sectors, property types, and regions that have not been endured since the 1980's, in our opinion. Fund Management is therefore utilizing the Third Avenue Real Estate Value Fund's flexible mandate to (i) invest in a wider set of real estate businesses including some of the premier commercial, residential, and service platforms in both the U.S. and international markets as well as (ii) sidestep certain exposures that seem to be facing serious secular challenges. Put otherwise, the Fund has approximately two-thirds of its capital invested in residential-related and real estate services businesses, with the remaining one-third of the Fund's exposure comprised of very select areas of the commercial real estate markets. The unifying theme behind these investments is that the holdings operate in real estate sectors that are structurally supported with (i) favorable supply-and-demand dynamics or (ii) leading positions in more consolidated parts of the industry and continue to take share. As a result, these select-set of issuers seem to exhibit "pricing power" or distinct "operating leverage", leaving them less dependent upon nominal inflation to increase revenues (and profits) and enhancing their prospects to earn "real returns" over time.
- Value Prices: Real Estate appears to be a contrarian allocation at present, with a greater share of generalist investors "underweight" the sector than at any point since 2009 per BofA Research. Not by coincidence, Real Estate securities are also more attractively priced relative to broad-based equity allocations (i.e., the S&P 500 Index) than at any time in the past 25 years by some measures, outside of the "global financial crisis" in 2008-2009 and the "tech boom" in the late 1990's and early 2000's. Both of those instances proved to be rewarding times to be invested in listed real estate and Fund Management is of the view that this is also an interesting moment, with one caveat: that a real estate allocation should offer exposure to value-oriented opportunities. To wit, the holdings in the Third Avenue Real Estate Value Fund traded at more than a 20% discount to our conservative estimates of NAV at the end of the quarter, when viewed in the aggregate, a historically wide ratio. The Fund also seems to offer a more compelling price-to-value proposition than some of the largest passive funds (such as the Vanguard Real Estate Fund or "VNQ") with a price to book ratio[9] of 1.2 times, when viewed in the aggregate, relative to 2.4 times for the VNQ at the end of the quarter.
Fund Management acknowledges that focusing on these factors may not prove to be the optimal strategy should a period of "negative real rates" resurface (i.e., when significant leverage and financial engineering tends to be rewarded). However, placing emphasis on well-capitalized businesses managed by aligned control groups, along with securities priced at discounts to NAV despite prospects for further compounding has always been a sound strategy for Third Avenue. It is also an approach that remains particularly well-suited for a shift to "positive real rates", in our opinion. In fact, Fund Management is of the view that anything to the contrary may prove to be the equivalent of trying to "ski uphill" when investing in listed real estate.
We thank you for your continued support and look forward to writing to you again at the end of the next quarter. In the meantime, please don't hesitate to contact us with any questions or comments atrealestate@thirdave.com.
Sincerely,
The Third Avenue Real Estate Value Team
| Performance is shown for the Third Avenue Real Estate Value Fund (Institutional Class). Past performance is no guarantee of future results; returns include reinvestment of all distributions. Past performance and current performance may be lower or higher than performance quoted above. Investment return and principal value fluctuate so that an investor's shares, when redeemed, may be worth more or less than the original cost. For the most recent month-end performance, please visit the Fund's website at www.thirdave.com. The U.S. Lipper Fund Award for Best Equity Small Fund Family is based on a review of 185 qualified fund management companies that were eligible for the three-year period ending on 11/30/23. To qualify for Lipper's Overall Small Fund Family Group Award, Small fund family groups must have at least three equity portfolios. The group award will be given to the group with the lowest average decile ranking of its respective asset class results based on the three-year Consistent Return measure of the eligible funds. From LSEG Lipper Fund Award© 2024 LSEG. All rights reserved. Used under license. Important Information This publication does not constitute an offer or solicitation of any transaction in any securities. Any recommendation contained herein may not be suitable for all investors. Information contained in this publication has been obtained from sources we believe to be reliable, but cannot be guaranteed. The information in this portfolio manager letter represents the opinions of the portfolio manager(s) and is not intended to be a forecast of future events, a guarantee of future results or investment advice. Views expressed are those of the portfolio manager(s) and may differ from those of other portfolio managers or of the firm as a whole. Also, please note that any discussion of the Fund's holdings, the Fund's performance, and the portfolio manager(s) views are as of June 30, 2024 (except as otherwise stated), and are subject to change without notice. Certain information contained in this letter constitutes "forward-looking statements," which can be identified by the use of forward-looking terminology such as "may," "will," "should," "expect," "anticipate," "project," "estimate," "intend," "continue" or "believe," or the negatives thereof (such as "may not," "should not," "are not expected to," etc.) or other variations thereon or comparable terminology. Due to various risks and uncertainties, actual events or results or the actual performance of any fund may differ materially from those reflected or contemplated in any such forward-looking statement. Current performance results may be lower or higher than performance numbers quoted in certain letters to shareholders. Date of first use of portfolio manager commentary: July 23, 2024 [1] The FTSE EPRA/NAREIT Developed Real Estate Index was developed by the European Public Real Estate Association (EPRA), a common interest group aiming to promote, develop and represent the European public real estate sector, and the North American Association of Real Estate Investment Trusts (NAREIT), the representative voice of the US REIT industry. The index series is designed to reflect the stock performance of companies engaged in specific aspects of the North American, European and Asian Real Estate markets. The Index is capitalization-weighted. The index is not a security that can be purchased or sold. [2] A government-sponsored enterprise (GSE) is a quasi-governmental entity established to enhance the flow of credit to specific sectors of the U.S. economy. [3] Loan to Value ("LTV"): LTV represents the proportion of an asset that is being debt-financed or in other cases the debt to enterprise value ratio. [4] Coverage Ratio: A coverage ratio, broadly, is a metric intended to measure a company's ability to service its debt and meet its financial obligations, such as interest payments or dividends. [5] Free Cash Flow: Free cash flow (FCF) represents the cash that a company generates after accounting for cash outflows to support operations and maintain its capital assets. [6] Basis Points: Basis points, otherwise known as bps or bips, are a unit of measure used in finance to describe the percentage change in the value of financial instruments or the rate change in an index or other benchmark. One basis point is equivalent to 0.01% (1/100th of a percent) or 0.0001 in decimal form. [7] Free Cash Flow Yield: Free cash flow yield is a financial solvency ratio that compares the free cash flow per share a company is expected to earn against its market value per share. The ratio is calculated by taking the free cash flow per share divided by the current share price. [8] Capitalization Rate ("Cap Rate"): The capitalization rate (also known as cap rate) is used in the world of commercial real estate to indicate the initial rate of return that is expected to be generated on a real estate investment property on an unlevered basis. [9] Price to Book Ratio: A company's price-to-book ratio is the company's current stock price per share divided by its book value per share (BVPS). This shows the market valuation of a company compared to its book value. 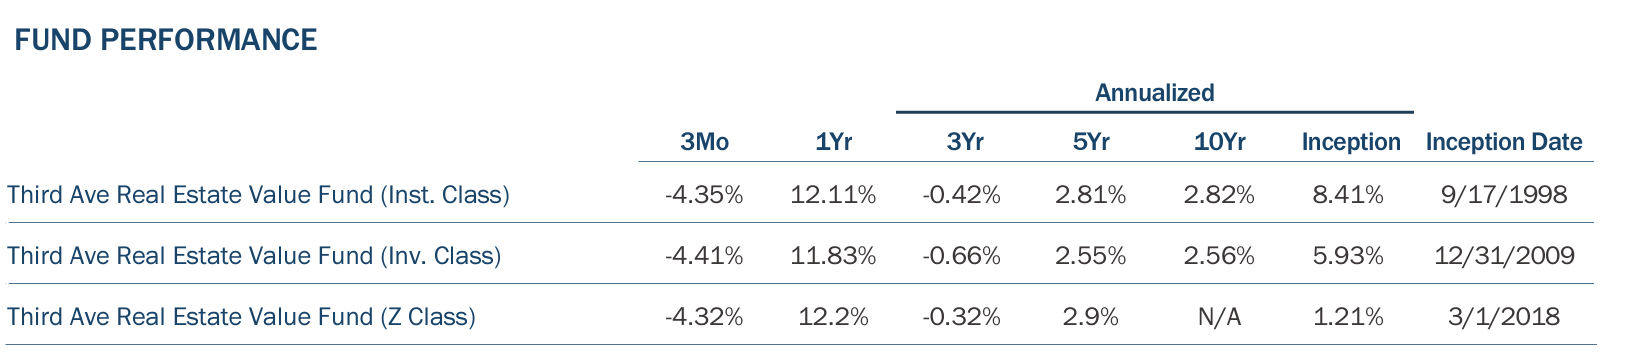 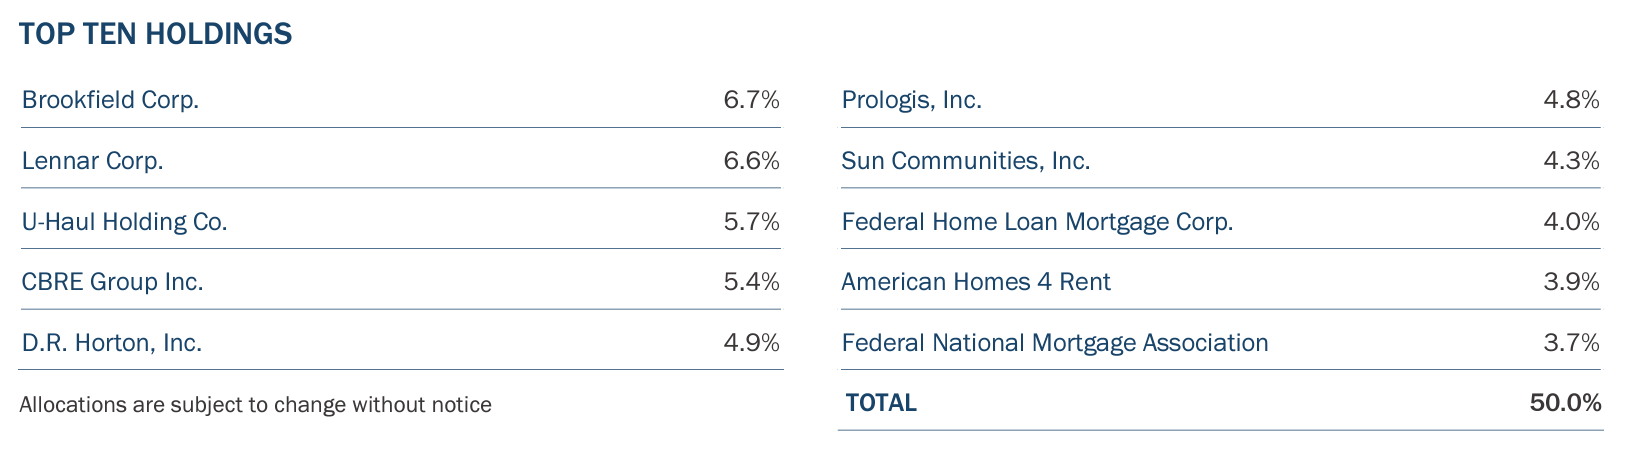 Past performance is no guarantee of future results; returns include reinvestment of all distributions. The above represents past performance and current performance may be lower or higher than performance quoted above. Investment return and principal value fluctuate so that an investor's shares, when redeemed, may be worth more or less than the original cost. For the most recent month-end performance, please visit the Fund's website at www.thirdave.com. The gross expense ratio for the Fund's Institutional, Investor and Z share classes is 1.19%, 1.45% and 1.11%, respectively, as of March 1, 2024. Distributions and yields are subject to change and are not guaranteed. Risks that could negatively impact returns include: overbuilding and increased competition, increases in property taxes and operating expenses, lack of financing, vacancies, environmental contamination and its related clean-up, changes in interest rates, casualty or condemnation losses, and variations in rental income. The fund's investment objectives, risks, charges, and expenses must be considered carefully before investing. The prospectus contains this and other important information about the investment company, and it may be obtained by calling 800-443-1021 or visiting www.thirdave.com. Read it carefully before investing. Distributor of Third Avenue Funds: Foreside Fund Services, LLC. Current performance results may be lower or higher than performance numbers quoted in certain letters to shareholders. Third Avenue offers multiple investment solutions with unique exposures and return profiles. Our core strategies are currently available through '40Act mutual funds and customized accounts. |
Editor's Note: The summary bullets for this article were chosen by Seeking Alpha editors.