Sean Anthony Eddy
About SPLG
This article series includes every month a dashboard with sector metrics in the S&P 500 index. It may help investors spot the sectors with the most (and least) attractive fundamentals. It may also serve as a top-down analysis of all funds tracking the S&P 500. Among them, SPDR Portfolio S&P 500 ETF (NYSEARCA:SPLG), launched in 2005, is less popular than SPDR S&P 500 ETF Trust (SPY). Nonetheless, it has a cheaper expense ratio (0.02% vs. 0.09%) and a lower share price. It has over $44B of assets and an average daily volume of $369M, which is enough to satisfy long-term investors and traders. SPLG pays quarterly dividends.
Shortcut
The next two paragraphs in italic describe the dashboard methodology. They are necessary for new readers to understand the metrics. If you are used to this series or if you are short of time, you can skip them and go to the charts.
Base Metrics
I calculate the median value of five fundamental ratios in every sector: Earnings Yield ("EY"), Sales Yield ("SY"), Free Cash Flow Yield ("FY"), Return on Equity ("ROE"), Gross Margin ("GM"). All are calculated on trailing 12 months. For all these ratios, higher is better and negative is bad. EY, SY and FY are medians of the inverse of Price/Earnings, Price/Sales and Price/Free Cash Flow. They are better for statistical studies than price-to-something ratios, which are unusable when the "something" is close to zero or negative (for example, companies with negative earnings). I also calculate two momentum metrics for each group: the median monthly return (RetM) and the median annual return (RetY).
I prefer medians rather than averages because a median splits a set in a good half and a bad half. Capital-weighted averages are skewed by extreme values and the largest companies. As a consequence, these metrics are designed for stock-picking rather than index investing.
Value and Quality Scores
Historical baselines are calculated as the averages on a look-back period of 11 years for all metrics. They are noted respectively EYh, SYh, FYh, ROEh, GMh. For example, the value of EYh for technology in the table below is the 11-year average of the median Earnings Yield of S&P 500 tech companies.
The Value Score "VS" is the average difference in % between the three valuation ratios (EY, SY, FY) and their baselines (EYh, SYh, FYh). The same way, the Quality Score "QS" is the average difference between the two quality ratios (ROE, GM) and their baselines (ROEh, GMh).
VS may be interpreted as the percentage of undervaluation or overvaluation relative to the baseline (positive is good, negative is bad). This interpretation must be taken with caution: the baseline is an arbitrary reference, not a supposed fair value. The formula assumes that the three valuation metrics are of equal importance, except in energy and utilities where the Free Cash Flow Yield is ignored to avoid some inconsistencies. VS and QS are capped between -100 and +100 when the calculation goes beyond these values.
Current data
The next table shows the metrics and scores as of writing. Columns stand for the data defined above.
VS | QS | EY | SY | FY | ROE | GM | EYh | SYh | FYh | ROEh | GMh | RetM | RetY | |
All | -16.01 | 7.22 | 0.0371 | 0.3367 | 0.0223 | 16.67 | 48.81 | 0.0425 | 0.4072 | 0.0272 | 15.23 | 46.50 | 3.70% | 19.02% |
Cs. Discretionary | -3.37 | 25.53 | 0.0451 | 0.4922 | 0.0334 | 31.54 | 38.85 | 0.0447 | 0.6338 | 0.0300 | 21.85 | 36.39 | 3.57% | 9.15% |
Cs. Staples | -3.28 | -8.14 | 0.0430 | 0.4856 | 0.0173 | 19.25 | 41.12 | 0.0416 | 0.4686 | 0.0208 | 23.39 | 40.54 | 3.10% | 4.40% |
Energy | 100* | 94.19 | 0.0712 | 0.5039 | 0.0331 | 21.65 | 45.49 | 0.0248 | 0.5465 | -0.0024 | 7.64 | 43.32 | -0.05% | 2.54% |
Financials | 1.64 | 12.22 | 0.0630 | 0.4577 | 0.0707 | 13.15 | 80.84 | 0.0685 | 0.4305 | 0.0663 | 11.24 | 75.22 | 4.85% | 39.09% |
Healthcare | -19.33 | -8.65 | 0.0262 | 0.2590 | 0.0217 | 13.00 | 63.59 | 0.0335 | 0.2698 | 0.0320 | 15.71 | 63.61 | 2.38% | 11.04% |
Industrials | -31.55 | 7.05 | 0.0328 | 0.2744 | 0.0196 | 22.91 | 40.07 | 0.0428 | 0.4986 | 0.0266 | 21.44 | 37.37 | 4.10% | 22.08% |
Technology | -32.64 | 6.16 | 0.0257 | 0.1570 | 0.0222 | 25.49 | 62.69 | 0.0363 | 0.2469 | 0.0328 | 22.54 | 63.18 | 4.56% | 22.66% |
Communication | 14.58 | -4.92 | 0.0414 | 0.7403 | 0.0401 | 14.73 | 55.24 | 0.0456 | 0.5312 | 0.0353 | 16.53 | 54.66 | 2.05% | 11.05% |
Materials | -22.87 | -0.83 | 0.0302 | 0.5045 | 0.0181 | 16.73 | 37.43 | 0.0432 | 0.5906 | 0.0238 | 17.55 | 36.35 | 3.65% | 18.86% |
Utilities | -11.37 | 10.08 | 0.0493 | 0.3718 | -0.0779 | 10.49 | 44.67 | 0.0491 | 0.4838 | -0.0572 | 9.65 | 40.08 | 2.14% | 20.68% |
Real Estate | 2.59 | 8.35 | 0.0235 | 0.1112 | 0.0082 | 8.11 | 64.85 | 0.0235 | 0.1147 | 0.0074 | 6.88 | 65.65 | 5.68% | 19.27% |
*capped for convenience
Score charts
The next chart plots the Value and Quality Scores by sector (higher is better).
Value and quality in the S&P 500 (Chart: author; data: Portfolio123)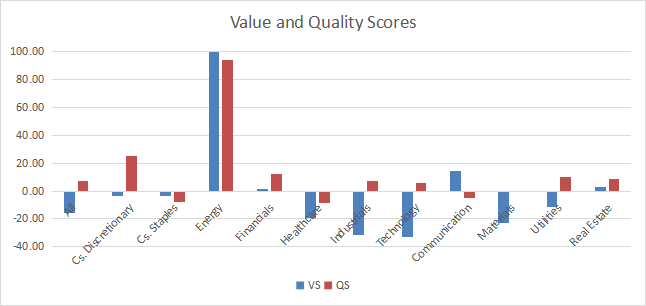
Score variations since last month:
Variations in value and quality ( Chart: author; data: Portfolio123)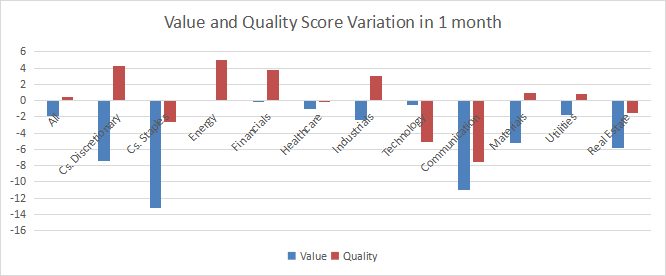
The next chart plots momentum scores based on median returns by sector.
Momentum in the S&P 500 (Chart: author; data: Portfolio123)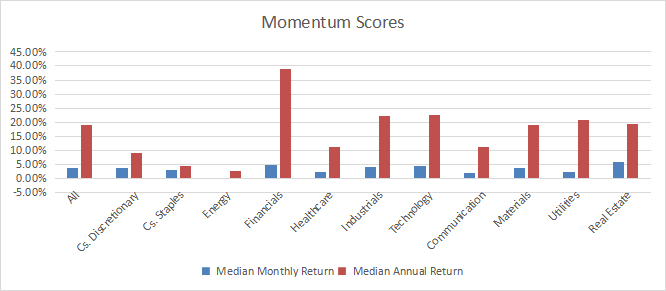
Interpretation
A theoretical S&P 500 median company is overvalued by 16% relative to historical averages since 2013. Its quality score is a bit above the historical baseline. We can translate median yields into their inverse ratios:
Price/Earnings: 26.95 - Price/Sales: 2.97 - Price/Free Cash Flow: 44.84
Since February 2022, energy has shown the highest scores in both value and quality. The communication services sector is undervalued by almost 15% relative to 11-year averages. Consumer discretionary, consumer staples, financials and real estate are close to their historical baselines in valuation. Nonetheless, consumer discretionary has a better quality score than any other sector except energy. Utilities are moderately overvalued (by 11%), while healthcare and materials are overvalued by about 20%. Technology and industrials are overvalued by more than 30% relative to the baseline. Their quality scores are good, but not high enough to justify such overvaluation.
SPLG has returned 27% in 12 months, while the median return of the S&P 500 is 19% (see the table above) and the equal-weight average is at 19.3% (measured on RSP). These are clues that the recent performance of the S&P 500 was significantly skewed by mega-cap companies.
The table above is not only useful to calculate value and quality scores. It may also help spot companies looking cheap relative to their peers. For example, the EY column tells that a large consumer staples company with an Earnings Yield above 0.0430 (or price/earnings below 23.26) is in the better half of the sector regarding this metric. A Dashboard List is sent every month to Quantitative Risk & Value members, with companies standing in the better half among their peers regarding the three valuation metrics. The table below is a part of the list of 72 stocks sent to QRV members for this month.
Ticker | Name | Sector |
MGM Resorts International | DISCRETIONARY | |
Devon Energy Corp. | ENERGY | |
Synchrony Financial | FINANCIAL | |
Tenet Healthcare Corp. | HEALTHCARE | |
Caterpillar, Inc. | INDUSTRIAL | |
Builders FirstSource, Inc. | MATERIALS | |
Molson Coors Beverage Co. | STAPLES | |
InterDigital, Inc. | TECH | |
CenterPoint Energy, Inc. | UTIL |
It is part of a larger rotational model with a statistical bias, not the result of individual stock analysis.
Quantitative Risk & Value (QRV) provides you with risk indicators and data-driven, time-tested strategies. Get started with a two-week free trial now.
