Hispanolistic
Investment Approach
- Fidelity® Magellan® Fund is a diversified domestic equity strategy with a large-cap growth orientation and that seeks capital appreciation.
- The fund's mandate is highly flexible, giving us the ability to invest in domestic and foreign issuers across all market capitalizations and styles.
- Our investment approach seeks to identify high-quality growth stocks benefiting from long-term "mega trends," as well as the three "B's" - brands, barriers to entry and "best in class" management teams - using a proprietary quantitative screen and bottom-up fundamental analysis.
- The fund employs a unique risk-managed portfolio construction process that attempts to optimize alpha (risk-adjusted excess return). Rather than adjusting security weights according to conviction, we use an equal-active-weight approach, which helps to limit the impact of dramatic fluctuations in any single position, while still allowing for high active share (benchmark differentiation).
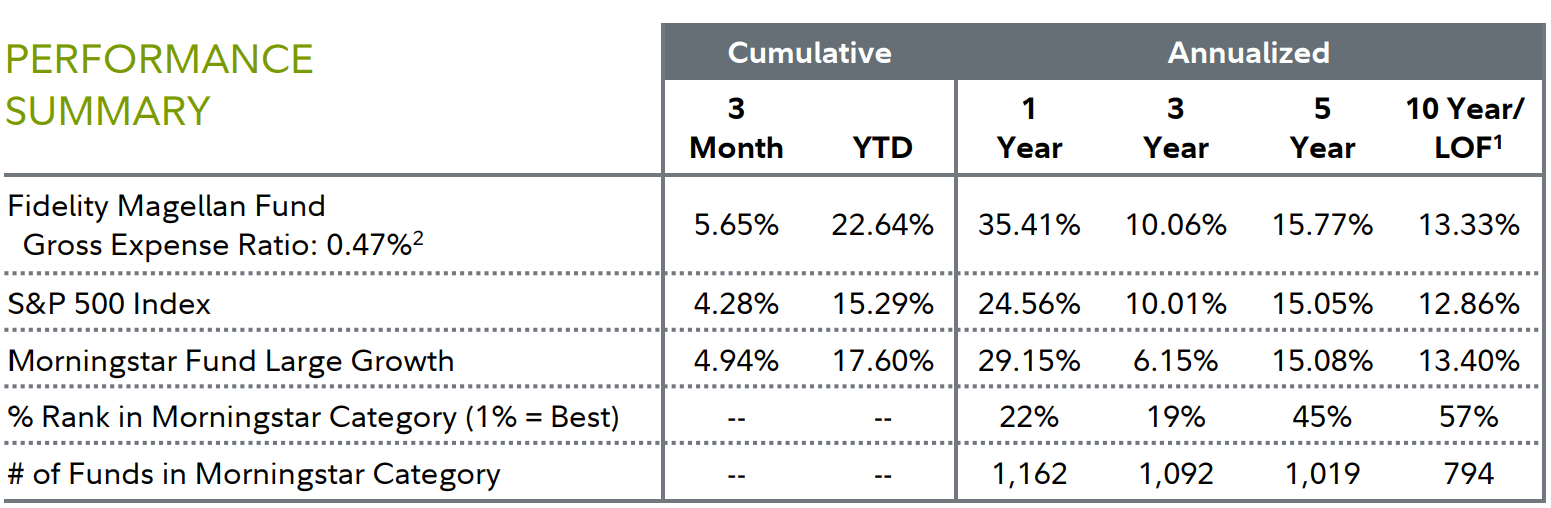
| 1 Life of Fund (LOF) if performance is less than 10 years. Fund inception date: 05/02/1963. 2 This expense ratio is from the most recent prospectus and generally is based on amounts incurred during the most recent fiscal year, or estimated amounts for the current fiscal year in the case of a newly launched fund. It does not include any fee waivers or reimbursements, which would be reflected in the fund's net expense ratio. Past performance is no guarantee of future results. Investment return and principal value of an investment will fluctuate; therefore, you may have a gain or loss when you sell your shares. Current performance may be higher or lower than the performance stated. Performance shown is that of the fund's Retail Class shares (if multiclass). You may own another share class of the fund with a different expense structure and, thus, have different returns. To learn more or to obtain the most recent month-end or other share-class performance, visit Fidelity Funds | Mutual Funds from Fidelity Investments, Financial Professionals | Fidelity Institutional, or Fidelity NetBenefits | Employee Benefits. Total returns are historical and include change in share value and reinvestment of dividends and capital gains, if any. Cumulative total returns are reported as of the period indicated. For definitions and other important information, please see the Definitions and Important Information section of this Fund Review. |
Performance Review
For the three months ending June 30, 2024, the fund's Retail Class shares gained 5.65%, topping the 4.28% advance of the benchmark S&P 500 index.
U.S. stocks gained 4.28% in the second quarter, according to the S&P 500 index, after shaking off a rough April and rising steadily due to resilient corporate profits, a frenzy over generative artificial intelligence and the Federal Reserve's likely pivot to cutting interest rates later this year. Amid this favorable backdrop for higher-risk assets, the index continued its late-2023 momentum and reached midyear just shy of its all-time closing high. Growth stocks led the narrow rally, with only three of 11 sectors topping the broader market. The backdrop for the global economy and earnings growth remained largely constructive, underpinning fairly low market volatility. The move toward global monetary easing inched forward, although persistent core inflation in the U.S. continued to keep the Fed on hold.
In Q2, U.S. large-cap growth stocks once again topped the performance leaderboard, adding to a strong year-to-date gain in what was a relatively quiet three months for asset markets. For the quarter, growth (+10%) shares within the index topped value (-2%) by a considerable margin, while large-caps handily bested small-caps. By sector within the S&P 500®, excitement about high-growth megatrends, fanned by AI fervor, was reflected in the roughly 14% gain for information technology, with semiconductors & semiconductor equipment (+23%) firms leading the way. The next-best sector performance came from communication services, with a 9% rise, while utilities managed a 5% uptick. The quarter truly was a mixed bag, as six of the benchmark's 11 sectors finished with negative returns.
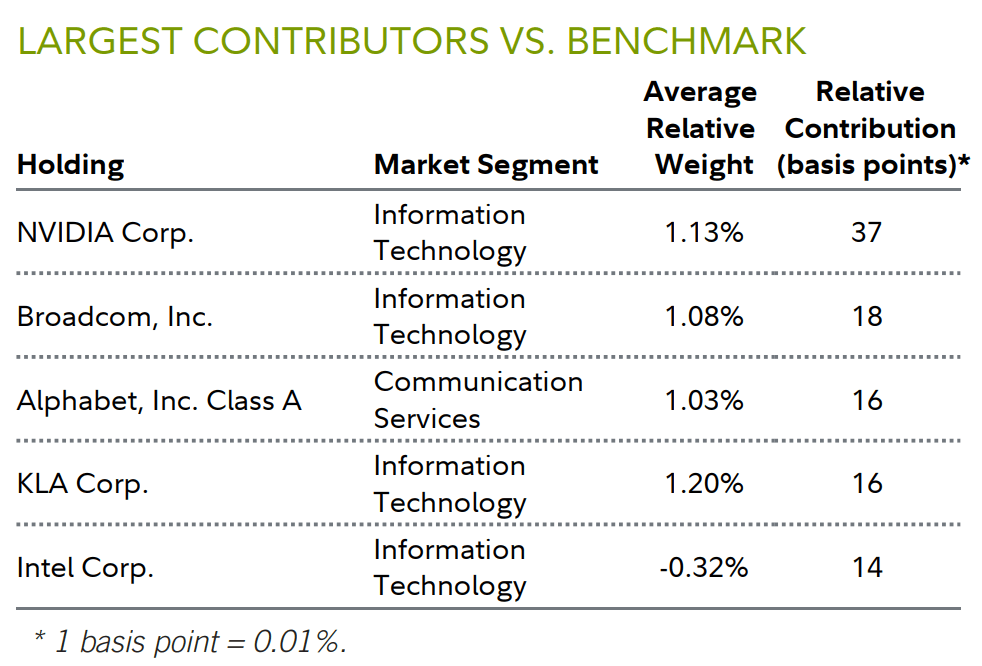
Versus the benchmark, stock selection was the primary factor driving the fund's outperformance, especially in the industrials and health care sectors. Picks among communication services, financials and consumer staples stocks helped to a lesser extent. Turning to individual holdings, an overweight stake in Nvidia (NVDA) contributed most to portfolio's relative result. The stock gained about 37% in the second quarter, rising steadily as the chips it makes continued to power demand for generative artificial intelligence. The company dominates the market for advanced graphics chips that are the lifeblood of new generative AI systems. In mid-May, the firm reported financial results for the three months ending April 28 that far exceeded analysts' expectations - sales roughly tripled, and earnings surged about sevenfold, each setting a quarterly record.
In addition, management raised its financial forecast for the firm's next fiscal quarter. The stock was the fund's second-largest position as the midpoint of 2024.
Outsized exposure to Broadcom also paid off this quarter. Shares of the U.S. semiconductor maker advanced about 22% in the second quarter, as its high-capacity chips used in artificial intelligence applications benefited from the AI boom. In June, the company reported better-than-expected financial results for the three months ending May 5, driven by its AI-related business and VMware, a cloud-computing business Broadcom acquired in 2022. The shares were further aided by the simultaneous announcement of a 10-for-1 stock split, to be implemented in July. Broadcom was a top-10 holding on June 30.
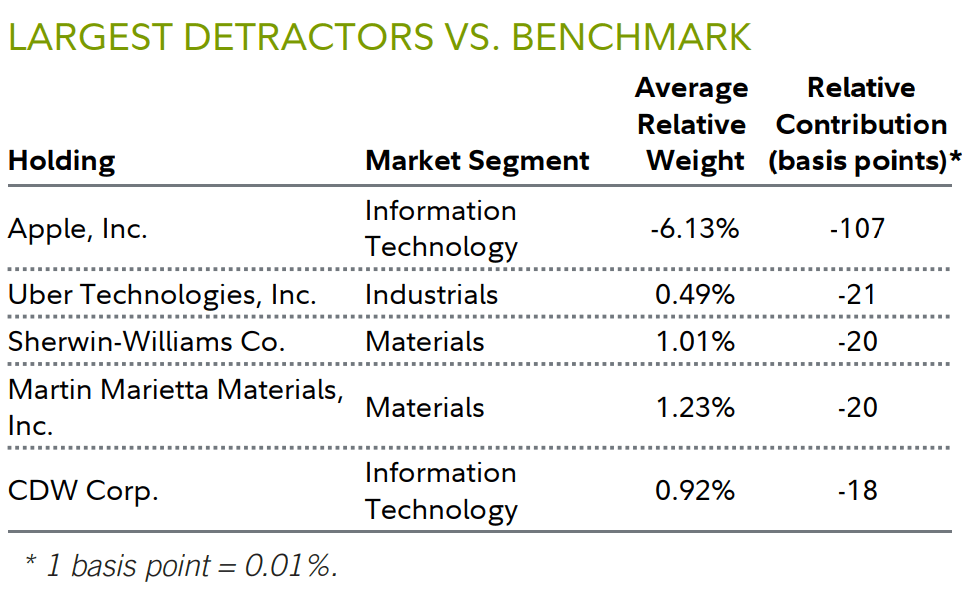
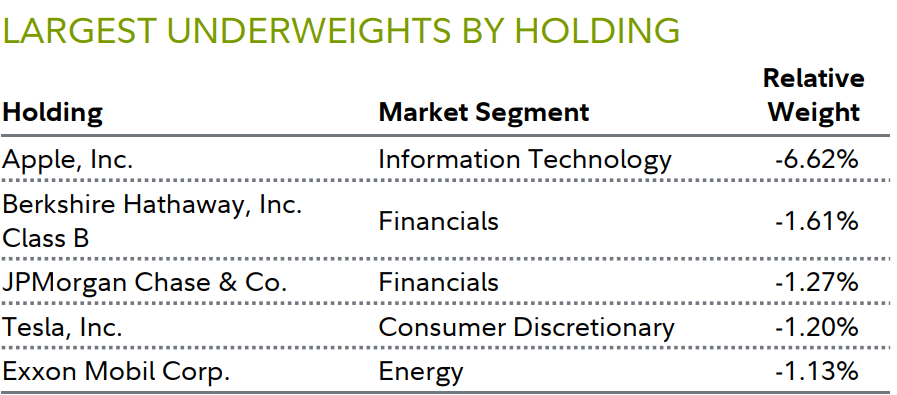
Conversely, subpar investment choices and an overweight among materials stocks worked against the portfolio's relative return this period. Larger-than-benchmark exposure to industrials also hurt, as did positioning in the technology hardware & equipment industry within the tech sector. Largely explaining that last fact was our decision to not own shares of benchmark heavyweight and personal electronics giant Apple (AAPL) (+23%) in Q2. The stock increased in early May after the company authorized up to $110 billion to buy its own shares, in addition to increasing its dividend by 4%. Financial results for the first quarter, also released in May, were not as bad as some had anticipated. Revenue fell 4% but slightly exceeded the consensus figure, as did earnings. The stock rose again in June, when the company unveiled a new offering, marking its closely watched entry into the race to enhance its devices by capitalizing on generative artificial intelligence. In our view, Apple is quite expensive, even on relatively generous assumptions about earnings for the next several quarters, so we continued to avoid it.
Untimely positioning in shares of Uber Technologies (UBER) (-18%) was another challenge. In early May, the provider of ride-hailing, courier, food-delivery and freight-transport services reported a surprising loss for Q1, as legal settlements and equity investments in other companies hampered its results, despite demand for rides and deliveries increasing for the period. Looking ahead, regulatory challenges loom for the firm's rideshare business, mostly related to minimum-wage rules for drivers and ongoing disputes about whether they should be classified as independent contractors or employees. All told, we exited this position, missing the stock's partial recovery in June.
Outlook and Positioning
Despite considerable investor uncertainty as of midyear, I believe either a soft landing or mild recession is the most likely scenario for the U.S. economy. In particular, the significant increase in spending on domestic infrastructure, reshoring, new semiconductor capacity and combatting climate change should help cushion any further slowing in the economy, while also having potentially favorable spillover benefits for other nations around the world.
Another positive for the global outlook is the low level of unemployment in most key markets. As long as people have jobs, they'll probably spend freely, which I believe bodes well for future economic growth, at least in the foreseeable future. Moreover, with interest rates as high as they are, the Fed and other central banks around the world have plenty of room to reduce rates if economic growth weakens further.
We continue to focus a significant percentage of the fund's assets on steady growers with strong balance sheets. The portfolio's overall positioning remains consistent with the four key factors we look for: quality, growth, momentum and free cash flow - a strategy that has served us well over multiple market and economic cycles.
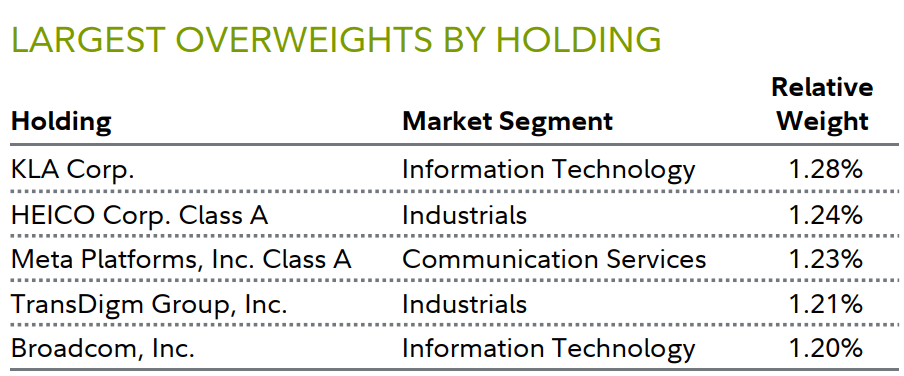
Given our expectation for infrastructure spending to be a focal point for economic growth in the foreseeable future, the fund's largest sector exposure as of quarter end was industrials, although we trimmed this overweight a bit in Q2. Several noteworthy individuals either outsized or non-benchmark positions in this sector as of June 30 were HEICO (HEI), TransDigm Group (TDG), Watsco (WSO) and Quanta Services (PWR).
The portfolio's second-largest sector overweight as of midyear was information technology, which we added to this past quarter. Notable individual stakes here were mainly divided between the semiconductors & semiconductor equipment industry (KLA (KLAC), Lam Research (LRCX) and Broadcom (AVGO)) and software & services stocks (Intuit (INTU), Oracle (ORCL) and Synopsys (SNPS)). Additionally, Motorola Solutions (MSI), in the technology hardware & equipment category, was another key overweight as of June 30.
On the other hand, consumer staples and energy represented the biggest underweights from a sector standpoint. The portfolio had some holdings within the former, but we avoided energy entirely, as it is mainly driven by commodity prices, which can change significantly in a relatively short period of time. Furthermore, it is a highly capital-intensive sector in which we believe it is difficult to identify durable competitive advantages. We also did not own any real estate stocks within the portfolio at the end of June.
We continued to avoid some sizable benchmark components that did not meet our investment criteria, including Apple, Berkshire Hathaway (BRK.A)(BRK.B) and JPMorgan Chase & Co. (JPM). Thank you for your confidence in Fidelity's investment-management capabilities.
Market-Segment Diversification
Market Segment | Portfolio Weight | Index Weight | Relative Weight | Relative Change From Prior Quarter |
Information Technology | 37.10% | 32.45% | 4.65% | 2.87% |
Industrials | 15.48% | 8.13% | 7.35% | -1.91% |
Financials | 9.94% | 12.42% | -2.48% | 0.17% |
Consumer Discretionary | 9.74% | 9.95% | -0.21% | -2.06% |
Health Care | 9.70% | 11.72% | -2.02% | -0.70% |
Communication Services | 8.90% | 9.34% | -0.44% | 0.00% |
Materials | 4.83% | 2.15% | 2.68% | -0.54% |
Consumer Staples | 1.89% | 5.77% | -3.88% | 0.30% |
Utilities | 1.11% | 2.26% | -1.15% | 1.05% |
Energy | 0.00% | 3.65% | -3.65% | 0.30% |
Real Estate | 0.00% | 2.15% | -2.15% | 0.13% |
Other | 0.00% | 0.00% | 0.00% | 0.00% |
Characteristics
Portfolio | Index | |
Valuation | ||
Price/Earnings Trailing | 37.4x | 25.6x |
Price/Earnings (IBES 1-Year Forecast) | 29.2x | 21.3x |
Price/Book | 11.5x | 5.0x |
Price/Cash Flow | 29.6x | 19.3x |
Return on Equity (5-Year Trailing) | 25.9% | 18.4% |
Growth | ||
Sales/Share Growth 1-Year (Trailing) | 16.5% | 13.1% |
Earnings/Share Growth 1-Year (Trailing) | 28.4% | 10.7% |
Earnings/Share Growth 1-Year (IBES Forecast) | 22.5% | 16.8% |
Earnings/Share Growth 5-Year (Trailing) | 20.1% | 18.1% |
Size | ||
Weighted Average Market Cap ($ Billions) | 928.7 | 1004.0 |
Weighted Median Market Cap ($ Billions) | 210.9 | 274.2 |
Median Market Cap ($ Billions) | 83.7 | 35.1 |
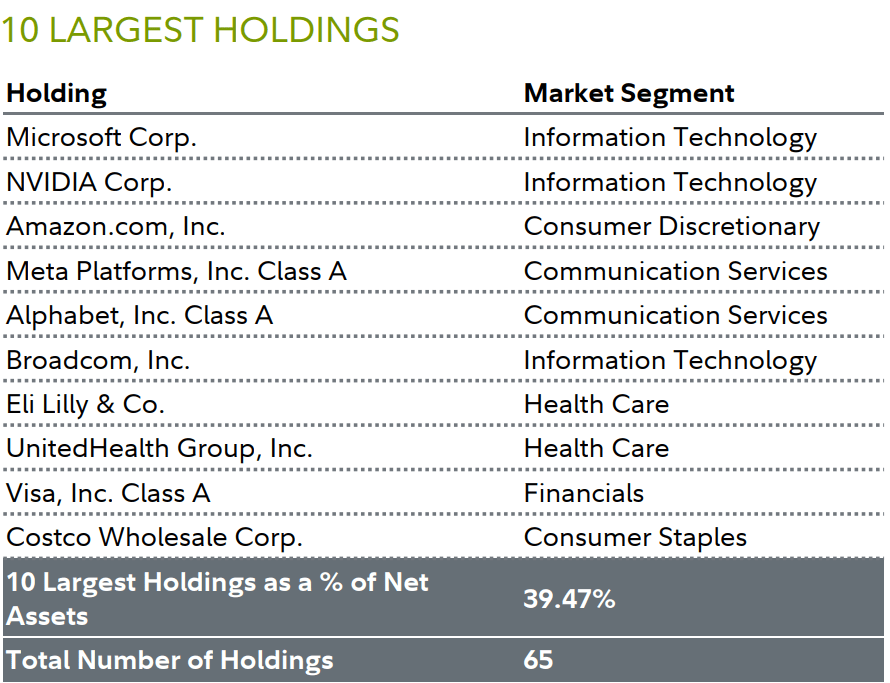
The 10 largest holdings are as of the end of the reporting period, and may not be representative of the fund's current or future investments. Holdings do not include money market investments. |
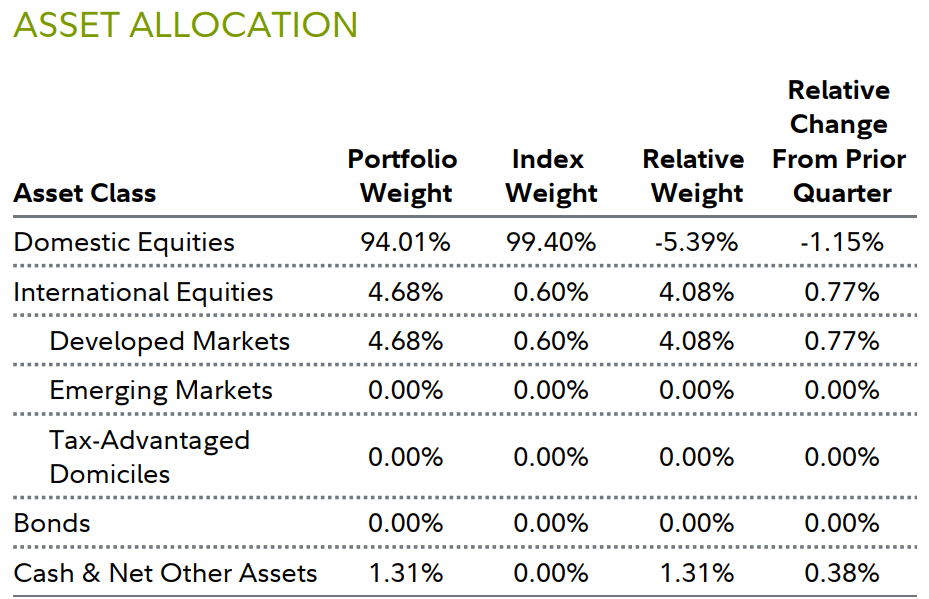
| Net Other Assets can include fund receivables, fund payables, and offsets to other derivative positions, as well as certain assets that do not fall into any of the portfolio composition categories. Depending on the extent to which the fund invests in derivatives and the number of positions that are held for future settlement, Net Other Assets can be a negative number. "Tax-Advantaged Domiciles" represent countries whose tax policies may be favorable for company incorporation. |
| Fund Information Manager(s): Sammy Simnegar Trading Symbol: FMAGX Start Date: May 02, 1963 Size (in millions): $35,196.02 Morningstar Category: Fund Large Growth Stock markets, especially foreign markets, are volatile and can decline significantly in response to adverse issuer, political, regulatory, market, or economic developments. Foreign securities are subject to interest rate, currency exchange rate, economic, and political risks. Definitions and Important Information Information provided in, and presentation of, this document are for informational and educational purposes only and are not a recommendation to take any particular action, or any action at all, nor an offer or solicitation to buy or sell any securities or services presented. It is not investment advice. Fidelity does not provide legal or tax advice. Before making any investment decisions, you should consult with your own professional advisers and take into account all of the particular facts and circumstances of your individual situation. Fidelity and its representatives may have a conflict of interest in the products or services mentioned in these materials because they have a financial interest in them, and receive compensation, directly or indirectly, in connection with the management, distribution, and/or servicing of these products or services, including Fidelity funds, certain third-party funds and products, and certain investment services. Characteristics Earnings-Per-Share Growth Trailing measures the growth in reported earnings per share over trailing one- and five-year periods. Earnings-Per-Share Growth (IBES 1-Year Forecast) measures the growth in reported earnings per share as estimated by Wall Street analysts. Median Market Cap identifies the median market capitalization of the portfolio or benchmark as determined by the underlying security market caps. Price-to-Book (P/B) Ratio is the ratio of a company's current share price to reported accumulated profits and capital. Price/Cash Flow is the ratio of a company's current share price to its trailing 12-months cash flow per share. Price-to-Earnings (P/E) Ratio (IBES 1-Year Forecast) is the ratio of a company's current share price to Wall Street analysts' estimates of earnings. Price-to-Earnings (P/E) Ratio Trailing is the ratio of a company's current share price to its trailing 12-months earnings per share. Return on Equity (ROE) 5-Year Trailing is the ratio of a company's last five years historical profitability to its shareholders' equity. Preferred stock is included as part of each company's net worth. Sales-Per-Share Growth measures the growth in reported sales over the specified past time period. Weighted Average Market Cap identifies the market capitalization of the average equity holding as determined by the dollars invested in the portfolio or benchmark. Weighted Median Market Cap identifies the market capitalization of the median equity holding as determined by the dollars invested in the portfolio or benchmark. Important Fund Information Relative positioning data presented in this commentary is based on the fund's primary benchmark (index) unless a secondary benchmark is provided to assess performance. Indices It is not possible to invest directly in an index. All indices represented are unmanaged. All indices include reinvestment of dividends and interest income unless otherwise noted. S&P 500 Index is a market capitalization-weighted index of 500 common stocks chosen for market size, liquidity, and industry group representation to represent U.S. equity performance. Market-segment Weights Market-segment weights illustrate examples of sectors or industries in which the fund may invest, and may not be representative of the fund's current or future investments. They should not be construed or used as a recommendation for any sector or industry. Ranking Information © 2024 Morningstar, Inc. All rights reserved. The Morningstar information contained herein: (1) is proprietary to Morningstar and/or its content providers; (2) may not be copied or redistributed; and (3) is not warranted to be accurate, complete or timely. Neither Morningstar nor its content providers are responsible for any damages or losses arising from any use of this information. Fidelity does not review the Morningstar data and, for mutual fund performance, you should check the fund's current prospectus for the most up-to-date information concerning applicable loads, fees and expenses. % Rank in Morningstar Category is the fund's total-return percentile rank relative to all funds that have the same Morningstar Category. The highest (or most favorable) percentile rank is 1 and the lowest (or least favorable) percentile rank is 100. The top-performing fund in a category will always receive a rank of 1%. % Rank in Morningstar Category is based on total returns which include reinvested dividends and capital gains, if any, and exclude sales charges. Multiple share classes of a fund have a common portfolio but impose different expense structures. Relative Weights Relative weights represents the % of fund assets in a particular market segment, asset class or credit quality relative to the benchmark. A positive number represents an overweight, and a negative number is an underweight. The fund's benchmark is listed immediately under the fund name in the Performance Summary. 3-Year Risk/return Statistics Beta is a measure of the volatility of a fund relative to its benchmark index. A beta greater (less) than 1 is more (less) volatile than the index. Information Ratio measures a fund's active return (fund's average monthly return minus the benchmark's average monthly return) in relation to the volatility of its active returns. R-Squared measures how a fund's performance correlates with a benchmark index's performance and shows what portion of it can be explained by the performance of the overall market/index. R-Squared ranges from 0, meaning no correlation, to 1, meaning perfect correlation. An R-Squared value of less than 0.5 indicates that annualized alpha and beta are not reliable performance statistics. Sharpe Ratio is a measure of historical risk-adjusted performance. It is calculated by dividing the fund's excess returns (the fund's average annual return for the period minus the 3-month "risk free" return rate) and dividing it by the standard deviation of the fund's returns. The higher the ratio, the better the fund's return per unit of risk. The three month "risk free" rate used is the 90-day Treasury Bill rate. Standard Deviation is a statistical measurement of the dispersion of a fund's return over a specified time period. Fidelity calculates standard deviations by comparing a fund's monthly returns to its average monthly return over a 36-month period, and then annualizes the number. Investors may examine historical standard deviation in conjunction with historical returns to decide whether a fund's volatility would have been acceptable given the returns it would have produced. A higher standard deviation indicates a wider dispersion of past returns and thus greater historical volatility. Standard deviation does not indicate how the fund actually performed, but merely indicates the volatility of its returns over time. Tracking Error is the divergence between the price behavior of a position or a portfolio and the price behavior of a benchmark, creating an unexpected profit or loss. Before investing in any mutual fund, please carefully consider the investment objectives, risks, charges, and expenses. For this and other information, call or write Fidelity for a free prospectus or, if available, a summary prospectus. Read it carefully before you invest. Past performance is no guarantee of future results. Views expressed are through the end of the period stated and do not necessarily represent the views of Fidelity. Views are subject to change at any time based upon market or other conditions and Fidelity disclaims any responsibility to update such views. These views may not be relied on as investment advice and, because investment decisions for a Fidelity fund are based on numerous factors, may not be relied on as an indication of trading intent on behalf of any Fidelity fund. The securities mentioned are not necessarily holdings invested in by the portfolio manager(s) or FMR LLC. References to specific company securities should not be construed as recommendations or investment advice. Diversification does not ensure a profit or guarantee against a loss. S&P 500 is a registered service mark of Standard & Poor's Financial Services LLC. Other third-party marks appearing herein are the property of their respective owners. All other marks appearing herein are registered or unregistered trademarks or service marks of FMR LLC or an affiliated company. Fidelity Brokerage Services LLC, Member NYSE, SIPC, 900 Salem Street, Smithfield, RI 02917. Fidelity Distributors Company LLC, 500 Salem Street, Smithfield, RI 02917. © 2024 FMR LLC. All rights reserved. Not NCUA or NCUSIF insured. May lose value. No credit union guarantee. 656712.46.0 |
Editor's Note: The summary bullets for this article were chosen by Seeking Alpha editors.