Urupong
Investment Approach
- Fidelity® Growth Strategies Fund is a diversified domestic equity strategy with a mid-cap growth orientation.
- Our guiding philosophy is that stocks of high-quality companies that exhibit persistent growth and generate positive free cash flow, when purchased at reasonable prices, can outperform the market over time.
- We believe differences often exist between a stock's price and its true value because the market incorrectly forecasts the sustainability and/or magnitude of future growth.
- We look to uncover these opportunities through in-depth bottom-up, fundamental analysis, working in concert with Fidelity's global research team.
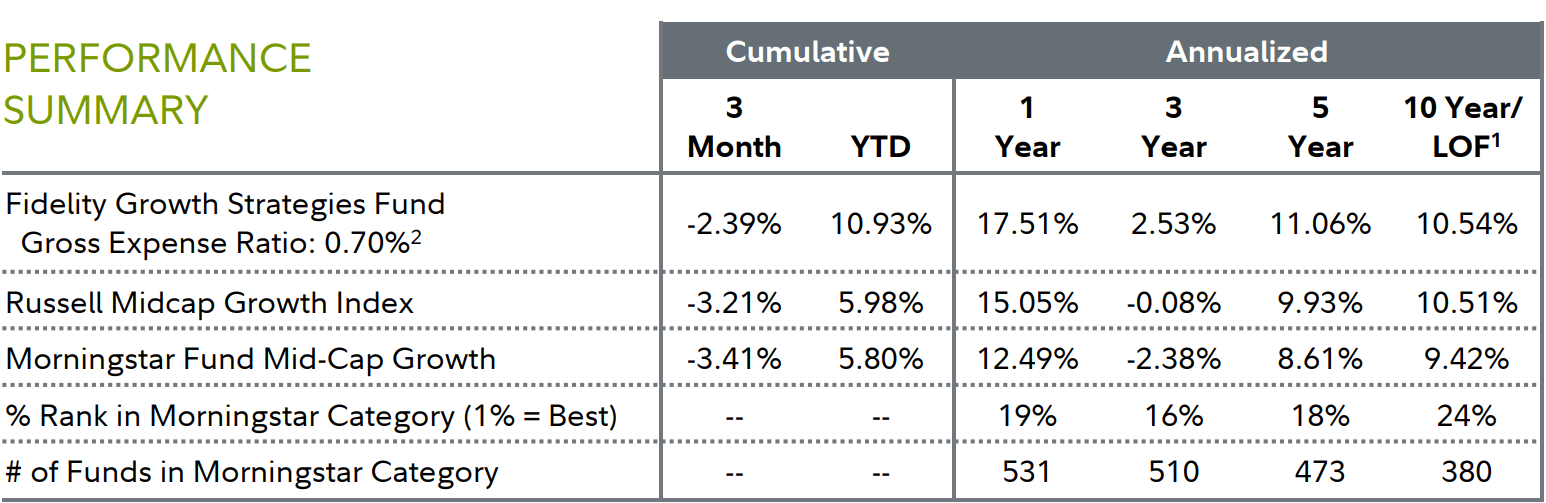
| 1 Life of Fund (LOF) if performance is less than 10 years. Fund inception date: 12/28/1990. 2 This expense ratio is from the most recent prospectus and generally is based on amounts incurred during the most recent fiscal year, or estimated amounts for the current fiscal year in the case of a newly launched fund. It does not include any fee waivers or reimbursements, which would be reflected in the fund's net expense ratio. Past performance is no guarantee of future results. Investment return and principal value of an investment will fluctuate; therefore, you may have a gain or loss when you sell your shares. Current performance may be higher or lower than the performance stated. Performance shown is that of the fund's Retail Class shares (if multiclass). You may own another share class of the fund with a different expense structure and, thus, have different returns. To learn more or to obtain the most recent month-end or other share-class performance, visit Fidelity Funds | Mutual Funds from Fidelity Investments, Financial Professionals | Fidelity Institutional, or Fidelity NetBenefits | Employee Benefits. Total returns are historical and include change in share value and reinvestment of dividends and capital gains, if any. Cumulative total returns are reported as of the period indicated. For definitions and other important information, please see the Definitions and Important Information section of this Fund Review. |
Performance Review
For the quarter, the fund's Retail Class shares returned -2.39%, modestly outpacing the -3.21% return of the benchmark Russell Midcap® Growth Index.
U.S. mid-cap stocks in the Russell index underperformed the large-cap-focused S&P 500® index during the second quarter, posting a decline versus the S&P 500's 4.28% gain. The latter index's advance, however, was largely concentrated in a small number of mega-cap, tech-oriented stocks, thanks to ongoing and massive investment in companies viewed as well-positioned to benefit from the boom in generative artificial intelligence. In other words, the market breadth that had returned briefly in Q1 gave way to a narrow, large-cap-focused rally in Q2.
For the quarter, mid-cap growth and value shares posted broadly similar results. Within the Russell Midcap® Growth Index, the utilities and communication services sectors (+11% each) led the way by a wide margin, with energy (+5%) and information technology (+1%) being the only other sectors to advance. In contrast, consumer staples (-11%), materials (-10%), health care (-9%), industrials and real estate (-5% each), and consumer discretionary (-4%) all trailed the index's return, while financials (-3%) middled.
Against this backdrop, security selection helped the fund outperform its Russell benchmark. Picks among consumer discretionary, information technology and health care stocks, and overall positioning in consumer staples and utilities, helped most.
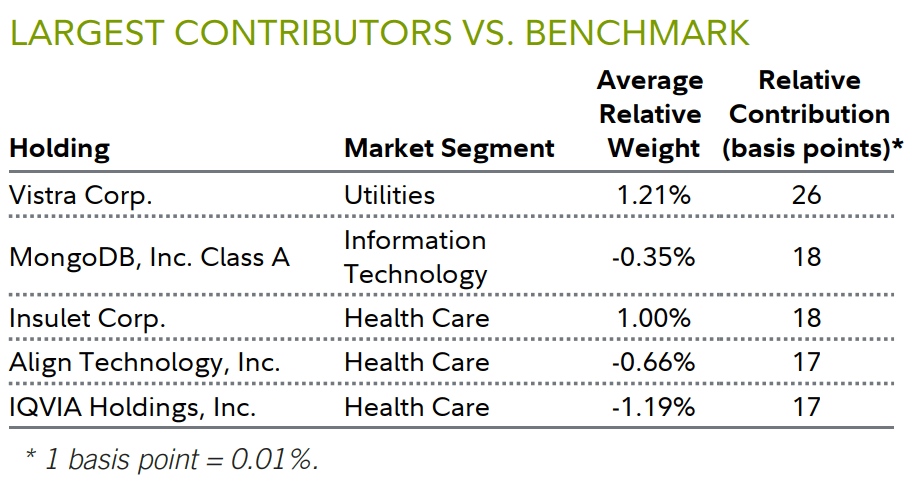
An overweight stake in utility company Vistra (VST) (+24%) was the top individual relative contributor. In Q1, the Texas-based independent power producer completed its acquisition of Ohio-based nuclear fleet operator Energy Harbor. The new Vistra, with its expanded geographic footprint, is in strong position to gain from the buildout of AI-capable data centers, which require enormous amounts of power to run. It is expected that local grids in the U.S. will need to invest heavily over the coming years to improve their power infrastructure and meet growing demand. In the nearer term, firms may choose to contract with independent power producers, like Vistra, rather than rely on the local provider.
An underweight in software & services firm MongoDB (MDB)(-30%) was the next-largest contributor to the fund's result versus the benchmark. The company's shares fell sharply in May, after it reported disappointing Q1 results and reduced full-year guidance for its cloud storage platform, MongoDB Atlas.
Within the health care equipment & services segment, overweighting medical device company Insulet (PODD) (+17%) and avoiding Align Technology (ALGN) (-26%), makers of Invisalign orthodontic aligners, each also helped.
In April, Insulet reported year-over-year revenue growth of roughly 23%, and gross profit that was up about 28%, for the year's first quarter. The gains were driven by strong demand for the company's wearable insulin pump, Omnipod. We reduced our position in Insulet during the quarter to manage the position size. Meanwhile, Align Technology's stock fell following a mixed Q1 earnings report, which included better-than-expected quarterly revenue but net income and earnings per share that fell well short of expectation.
Conversely, stock choices and an underweight in the outperforming energy sector, a significant overweight in industrials, and an underweight in communication services all worked against the relative result.
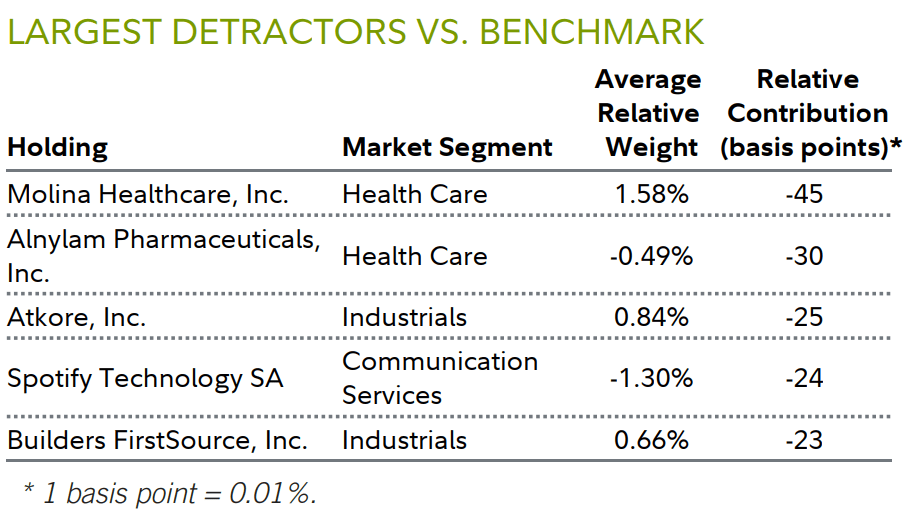
On a stock-specific basis, a larger-than-benchmark stake in Molina Healthcare (MOH) (-28%), a California-headquartered managed care firm, was the biggest relative detractor. The past year has been a difficult one for the managed care industry, due to rising medical costs and government reimbursements that have not kept pace. The past three months, Molina's stock was dragged down by negative sentiment for the segment, even though its latest earnings report, in April, was better than expected.
Lastly, not holding biopharmaceutical firm Alnylam Pharmaceuticals (+63%) also hurt. The stock was range-bound until June 24, when it surged on news that the maker of RNA interference therapeutics achieved favorable top-line results in a late-stage clinical trial for its cardiovascular treatment, vutrisiran. Management noted the drug's potential to address the needs of patients with a steadily progressive, debilitating and ultimately fatal disease.
Outlook and Positioning
Our focus remains on owning high-quality stocks with below-average valuations within the portfolio, emphasizing those companies with higher relative free-cash-flow yield. Historically, the fund's holdings have exhibited above-benchmark long-term earnings-per-share growth at relatively low price-to-earnings and price-to-cash-flow multiples. We aim to optimize potential for upside return while focusing on downside-risk protection, and we believe we can accomplish this through individual security selection.
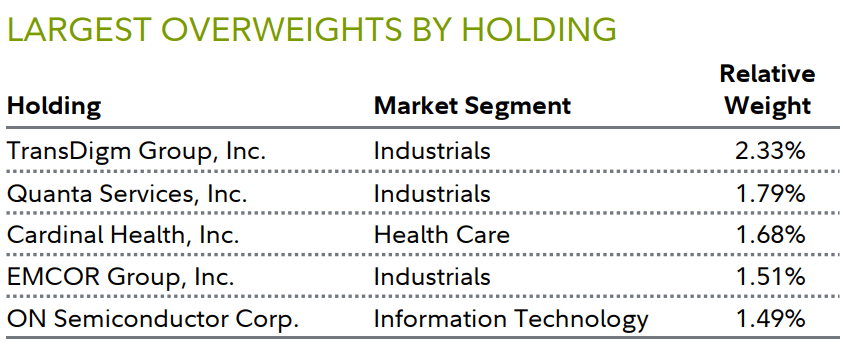
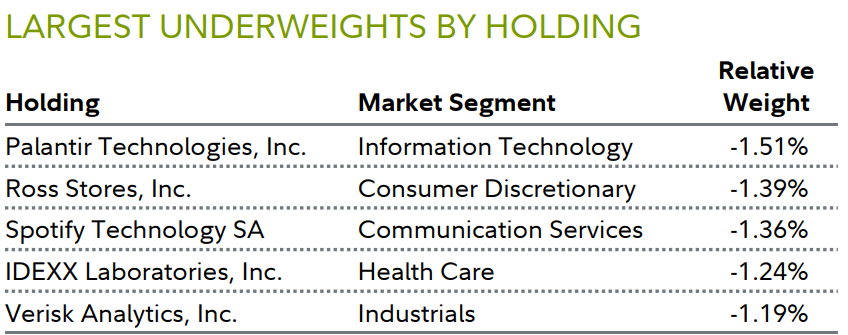
As of June 30, the fund's most noteworthy overweight was in the industrials sector. The fund also maintained more modest outsized exposure to utilities and materials stocks. In contrast, the portfolio's largest underweights at quarter end were among information technology, health care, consumer staples and real estate firms.
In Q2, we added to the fund's relative positioning in consumer discretionary, turning a small underweight in this sector into an overweight at quarter end. Some of this shift came from opportunistically adding new positions in companies whose valuations had declined to more attractive levels. For example, this quarter, we added a stake in cosmetics chain store Ulta Beauty.
We maintained confidence in the fund's holdings in the industrials sector, which continues to be an area we are closely watching, as we believe there could be many beneficiaries as firms build new, AI-capable data centers. Generally speaking, these companies generate positive free cash flow and have stock-specific catalysts driving earnings growth. Many also have a conservative or net-cash balance sheet, an important ballast in a volatile market, in our view.
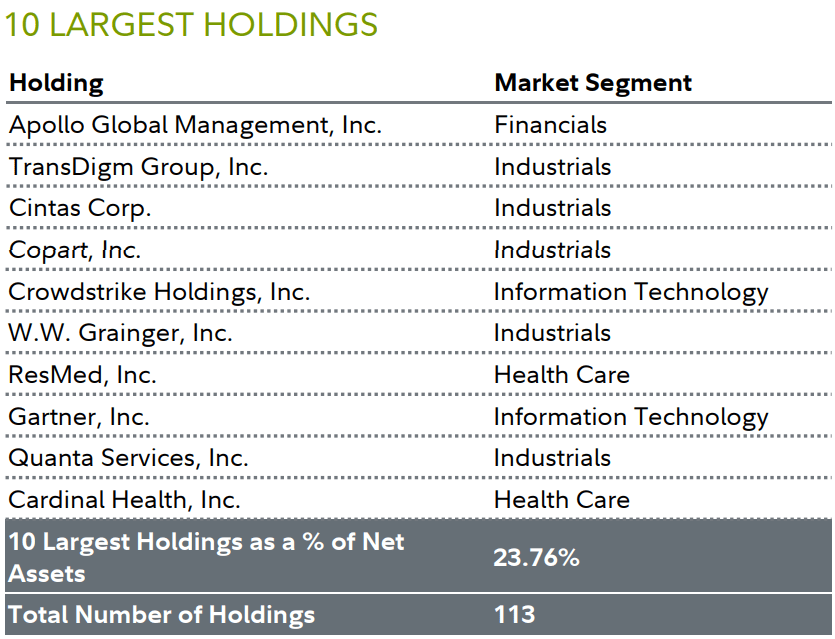
Within health care, we maintained overweight positions in several individual stocks, including health services provider Cardinal Health, medical device makers Insulet and ResMed (RMD), and DexCom (DXCM), a maker of continuous glucose monitoring systems. However, we reduced over overall holdings in the sector as of June 30.
In contrast, the portfolio did not own some sizable benchmark components at year-end. These included Idexx Labs (IDXX), Palantir Technologies (PLTR), IQVIA (IQV) and Spotify (SPOT). We would like to underscore that all our investment choices are made individually and in light of company-specific opportunities, as well as what we deem to be a low valuation relative to what we calculate as the growth potential for that specific company.
As 2024 progresses, we're watching to see how and when the recent strength and investor enthusiasm for a narrow group of mega-cap AI-exposed stocks could expand across the mid-cap universe. To date, most of the positive, AI-related movement among mid-caps has been in the industrials and utilities sectors.
Anticipating more market volatility, we will stick with our investment process, which focuses on companies that are generating free cash flow, trading at reasonable valuations and where business conditions are improving. We're being highly selective in terms of where to invest, while trying to find good entry points among stocks we believe could eventually move higher.
We also remain focused on owning companies that have net cash on their balance sheets, which we believe can provide more stability during periods of uncertainty.
As always, thank you for your confidence in Fidelity's investment-management capabilities.
Market-Segment Diversification
Market Segment | Portfolio Weight | Index Weight | Relative Weight | Relative Change From Prior Quarter |
Industrials | 26.41% | 19.69% | 6.72% | 0.54% |
Information Technology | 20.61% | 23.46% | -2.85% | -0.55% |
Health Care | 15.61% | 16.97% | -1.36% | -1.16% |
Consumer Discretionary | 14.51% | 13.78% | 0.73% | 2.38% |
Financials | 10.20% | 11.16% | -0.96% | -0.39% |
Communication Services | 3.91% | 4.86% | -0.95% | -0.00% |
Energy | 3.36% | 4.08% | -0.72% | 0.32% |
Materials | 1.76% | 1.24% | 0.52% | -0.03% |
Utilities | 1.58% | 0.49% | 1.09% | 0.36% |
Consumer Staples | 1.40% | 2.58% | -1.18% | 0.32% |
Real Estate | 0.62% | 1.68% | -1.06% | 0.12% |
Other | 0.00% | 0.00% | 0.00% | 0.00% |
Characteristics
Portfolio | Index | |
Valuation | ||
Price/Earnings Trailing | 26.2x | 34.6x |
Price/Earnings (IBES 1-Year Forecast) | 21.4x | 25.7x |
Price/Book | 8.7x | 9.3x |
Price/Cash Flow | 18.3x | 21.6x |
Return on Equity (5-Year Trailing) | 28.0% | 21.3% |
Growth | ||
Sales/Share Growth 1-Year (Trailing) | 13.3% | 13.4% |
Earnings/Share Growth 1-Year (Trailing) | 21.6% | 54.9% |
Earnings/Share Growth 1-Year (IBES Forecast) | 13.3% | 17.5% |
Earnings/Share Growth 5-Year (Trailing) | 23.7% | 18.2% |
Size | ||
Weighted Average Market Cap ($ Billions) | 40.4 | 32.4 |
Weighted Median Market Cap ($ Billions) | 35.1 | 29.6 |
Median Market Cap ($ Billions) | 28.1 | 12.1 |
| Net Other Assets can include fund receivables, fund payables, and offsets to other derivative positions, as well as certain assets that do not fall into any of the portfolio composition categories. Depending on the extent to which the fund invests in derivatives and the number of positions that are held for future settlement, Net Other Assets can be a negative number. "Tax-Advantaged Domiciles" represent countries whose tax policies may be favorable for company incorporation. |
| Fund Information Manager(s): Shilpa Mehra Trading Symbol: FDEGX Start Date: December 28, 1990 Size (in millions): $3,166.26 Morningstar Category: Fund Mid-Cap Growth The value of the fund's domestic and foreign investments will vary from day to day in response to many factors. Stock values fluctuate in response to the activities of individual companies, general market, and economic conditions. You may have a gain or loss when you sell your shares. The securities of smaller, less well-known companies may be more volatile than those of larger companies. Foreign investments involve greater risks than those of U.S. investments. "Growth" stocks can perform differently from the market as a whole and other types of stocks and can be more volatile than other types of stocks. Definitions and Important Information Information provided in, and presentation of, this document are for informational and educational purposes only and are not a recommendation to take any particular action, or any action at all, nor an offer or solicitation to buy or sell any securities or services presented. It is not investment advice. Fidelity does not provide legal or tax advice. Before making any investment decisions, you should consult with your own professional advisers and take into account all of the particular facts and circumstances of your individual situation. Fidelity and its representatives may have a conflict of interest in the products or services mentioned in these materials because they have a financial interest in them, and receive compensation, directly or indirectly, in connection with the management, distribution, and/or servicing of these products or services, including Fidelity funds, certain third-party funds and products, and certain investment services. Characteristics Earnings-Per-Share Growth Trailing measures the growth in reported earnings per share over trailing one- and five-year periods. Earnings-Per-Share Growth (IBES 1-Year Forecast) measures the growth in reported earnings per share as estimated by Wall Street analysts. Median Market Cap identifies the median market capitalization of the portfolio or benchmark as determined by the underlying security market caps. Price-to-Book (P/B) Ratio is the ratio of a company's current share price to reported accumulated profits and capital. Price/Cash Flow is the ratio of a company's current share price to its trailing 12-months cash flow per share. Price-to-Earnings (P/E) Ratio (IBES 1-Year Forecast) is the ratio of a company's current share price to Wall Street analysts' estimates of earnings. Price-to-Earnings (P/E) Ratio Trailing is the ratio of a company's current share price to its trailing 12-months earnings per share. Return on Equity (ROE) 5-Year Trailing is the ratio of a company's last five years historical profitability to its shareholders' equity. Preferred stock is included as part of each company's net worth. Sales-Per-Share Growth measures the growth in reported sales over the specified past time period. Weighted Average Market Cap identifies the market capitalization of the average equity holding as determined by the dollars invested in the portfolio or benchmark. Weighted Median Market Cap identifies the market capitalization of the median equity holding as determined by the dollars invested in the portfolio or benchmark. Important Fund Information Relative positioning data presented in this commentary is based on the fund's primary benchmark (index) unless a secondary benchmark is provided to assess performance. On May 21, 2024, Shilpa Mehra assumed portfolio management responsibilities for the fund, succeeding Jean Park. Indices It is not possible to invest directly in an index. All indices represented are unmanaged. All indices include reinvestment of dividends and interest income unless otherwise noted. Russell Midcap Growth Index is a market-capitalization-weighted index designed to measure the performance of the mid-cap growth segment of the U.S. equity market. It includes those Russell Midcap Index companies with higher price-to-book ratios and higher forecasted growth values. S&P 500 is a market-capitalization-weighted index of 500 common stocks chosen for market size, liquidity, and industry group representation to represent U.S. equity performance. Market-segment Weights Market-segment weights illustrate examples of sectors or industries in which the fund may invest, and may not be representative of the fund's current or future investments. They should not be construed or used as a recommendation for any sector or industry. Ranking Information © 2024 Morningstar, Inc. All rights reserved. The Morningstar information contained herein: (1) is proprietary to Morningstar and/or its content providers; (2) may not be copied or redistributed; and (3) is not warranted to be accurate, complete or timely. Neither Morningstar nor its content providers are responsible for any damages or losses arising from any use of this information. Fidelity does not review the Morningstar data and, for mutual fund performance, you should check the fund's current prospectus for the most up-to-date information concerning applicable loads, fees and expenses. % Rank in Morningstar Category is the fund's total-return percentile rank relative to all funds that have the same Morningstar Category. The highest (or most favorable) percentile rank is 1 and the lowest (or least favorable) percentile rank is 100. The top-performing fund in a category will always receive a rank of 1%. % Rank in Morningstar Category is based on total returns which include reinvested dividends and capital gains, if any, and exclude sales charges. Multiple share classes of a fund have a common portfolio but impose different expense structures. Relative Weights Relative weights represents the % of fund assets in a particular market segment, asset class or credit quality relative to the benchmark. A positive number represents an overweight, and a negative number is an underweight. The fund's benchmark is listed immediately under the fund name in the Performance Summary. 3-Year Risk/return Statistics Beta is a measure of the volatility of a fund relative to its benchmark index. A beta greater (less) than 1 is more (less) volatile than the index. Information Ratio measures a fund's active return (fund's average monthly return minus the benchmark's average monthly return) in relation to the volatility of its active returns. R-Squared measures how a fund's performance correlates with a benchmark index's performance and shows what portion of it can be explained by the performance of the overall market/index. R-Squared ranges from 0, meaning no correlation, to 1, meaning perfect correlation. An R-Squared value of less than 0.5 indicates that annualized alpha and beta are not reliable performance statistics. Sharpe Ratio is a measure of historical risk-adjusted performance. It is calculated by dividing the fund's excess returns (the fund's average annual return for the period minus the 3-month "risk free" return rate) and dividing it by the standard deviation of the fund's returns. The higher the ratio, the better the fund's return per unit of risk. The three month "risk free" rate used is the 90-day Treasury Bill rate. Standard Deviation is a statistical measurement of the dispersion of a fund's return over a specified time period. Fidelity calculates standard deviations by comparing a fund's monthly returns to its average monthly return over a 36-month period, and then annualizes the number. Investors may examine historical standard deviation in conjunction with historical returns to decide whether a fund's volatility would have been acceptable given the returns it would have produced. A higher standard deviation indicates a wider dispersion of past returns and thus greater historical volatility. Standard deviation does not indicate how the fund actually performed, but merely indicates the volatility of its returns over time. Tracking Error is the divergence between the price behavior of a position or a portfolio and the price behavior of a benchmark, creating an unexpected profit or loss. Before investing in any mutual fund, please carefully consider the investment objectives, risks, charges, and expenses. For this and other information, call or write Fidelity for a free prospectus or, if available, a summary prospectus. Read it carefully before you invest. Past performance is no guarantee of future results. Views expressed are through the end of the period stated and do not necessarily represent the views of Fidelity. Views are subject to change at any time based upon market or other conditions and Fidelity disclaims any responsibility to update such views. These views may not be relied on as investment advice and, because investment decisions for a Fidelity fund are based on numerous factors, may not be relied on as an indication of trading intent on behalf of any Fidelity fund. The securities mentioned are not necessarily holdings invested in by the portfolio manager(s) or FMR LLC. References to specific company securities should not be construed as recommendations or investment advice. Diversification does not ensure a profit or guarantee against a loss. S&P 500 is a registered service mark of Standard & Poor's Financial Services LLC. Other third-party marks appearing herein are the property of their respective owners. All other marks appearing herein are registered or unregistered trademarks or service marks of FMR LLC or an affiliated company. Fidelity Brokerage Services LLC, Member NYSE, SIPC, 900 Salem Street, Smithfield, RI 02917. Fidelity Distributors Company LLC, 500 Salem Street, Smithfield, RI 02917. © 2024 FMR LLC. All rights reserved. Not NCUA or NCUSIF insured. May lose value. No credit union guarantee. 656944.39.0 |