Matteo Colombo
Stocks have come down in a bout of the September scares. It’s normal price action if you’ve been monitoring seasonal tendencies over the past handful of years. It has actually been quite remarkable how well historical seasonal trends have played out lately.
VTI: Worst Week Since March 2023
StockCharts.com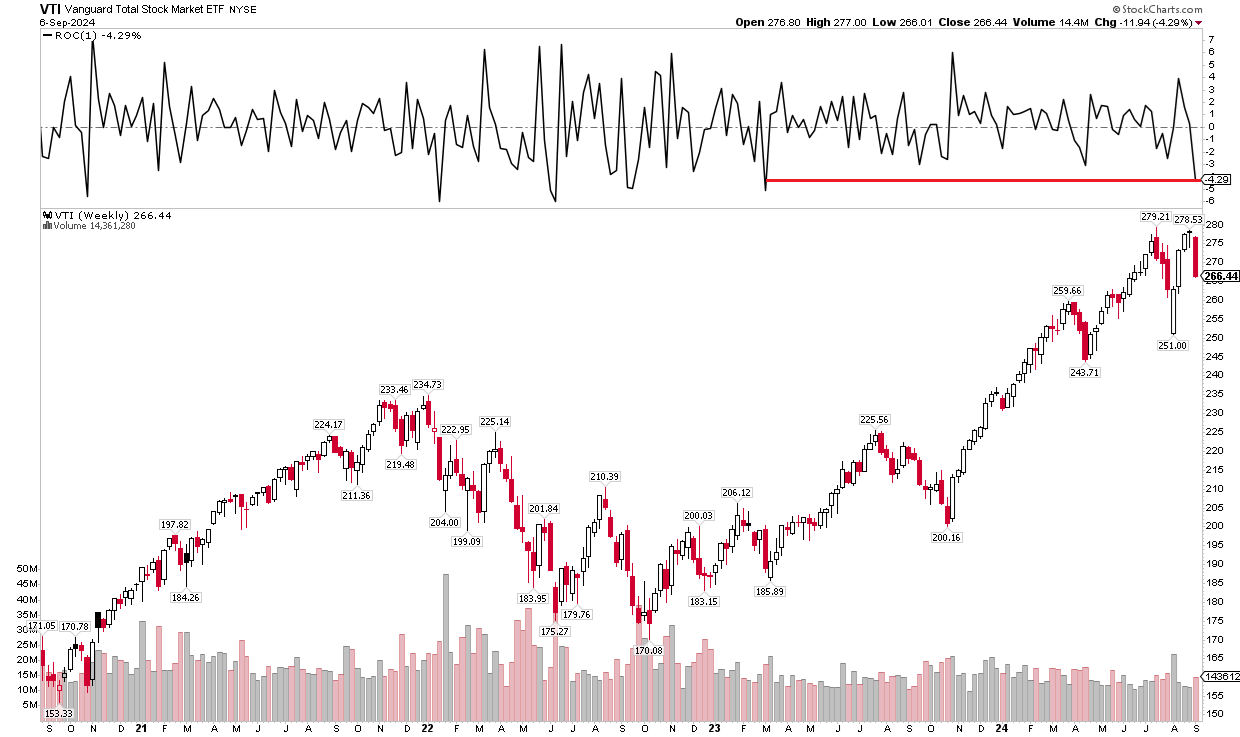
The Vanguard Total Stock Market Index Fund ETF Shares (NYSEARCA:VTI) has been down in each of the past four Septembers. No matter the reason, bears often assert themselves as the third quarter comes to a close.
This go-around, negative price action has come about just as the Fed embarks on what’s likely to be a protracted rate-cutting cycle and as the US general election is just eight weeks away.
Four to Five Quarter-Point Cuts Priced In By Year-End
Author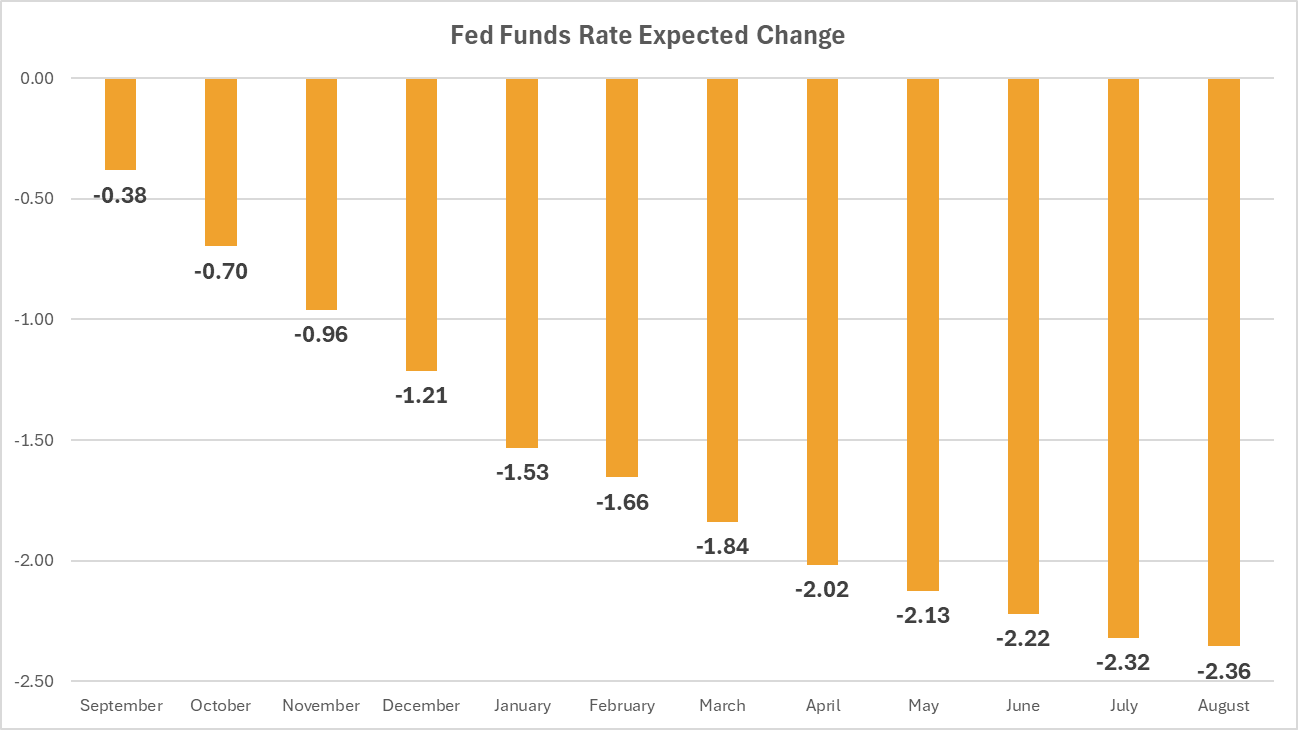
Volatility Often Jumps Before Voters Head to the Polls
MarketDesk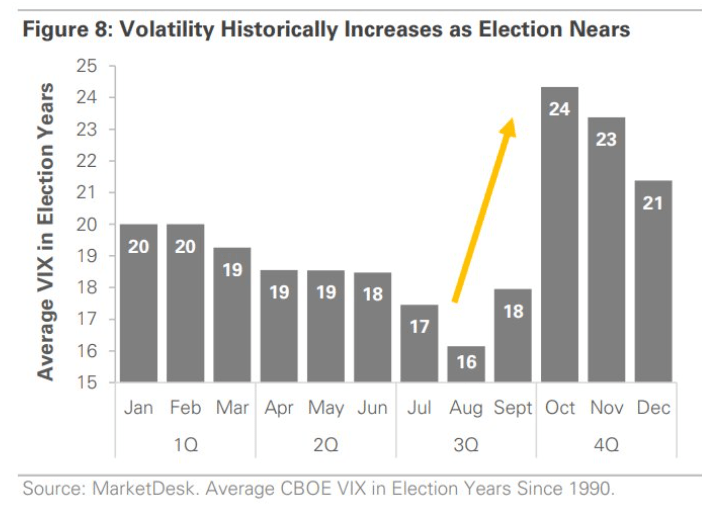
I reiterate a hold rating on VTI. I turned cautious on the broad domestic stock market fund in mid-July, and stocks happened to peak shortly after on July 16. For almost two months now, it has been a sideways to downward trend, hallmarked by a potentially bearish double-top pattern on the chart.
Equities initially dipped following a top in the Magnificent Seven tech stocks and the subsequent Tokyo crash back on August 5. Healthy macro data and a dovish Fed helped VTI rebound big through the end of last month, before bearish sentiment resurfaced last week.
Mag 7 Stocks In Correction Mode: GOOGL, NVDA Hit Bear-Market Territory
Koyfin Charts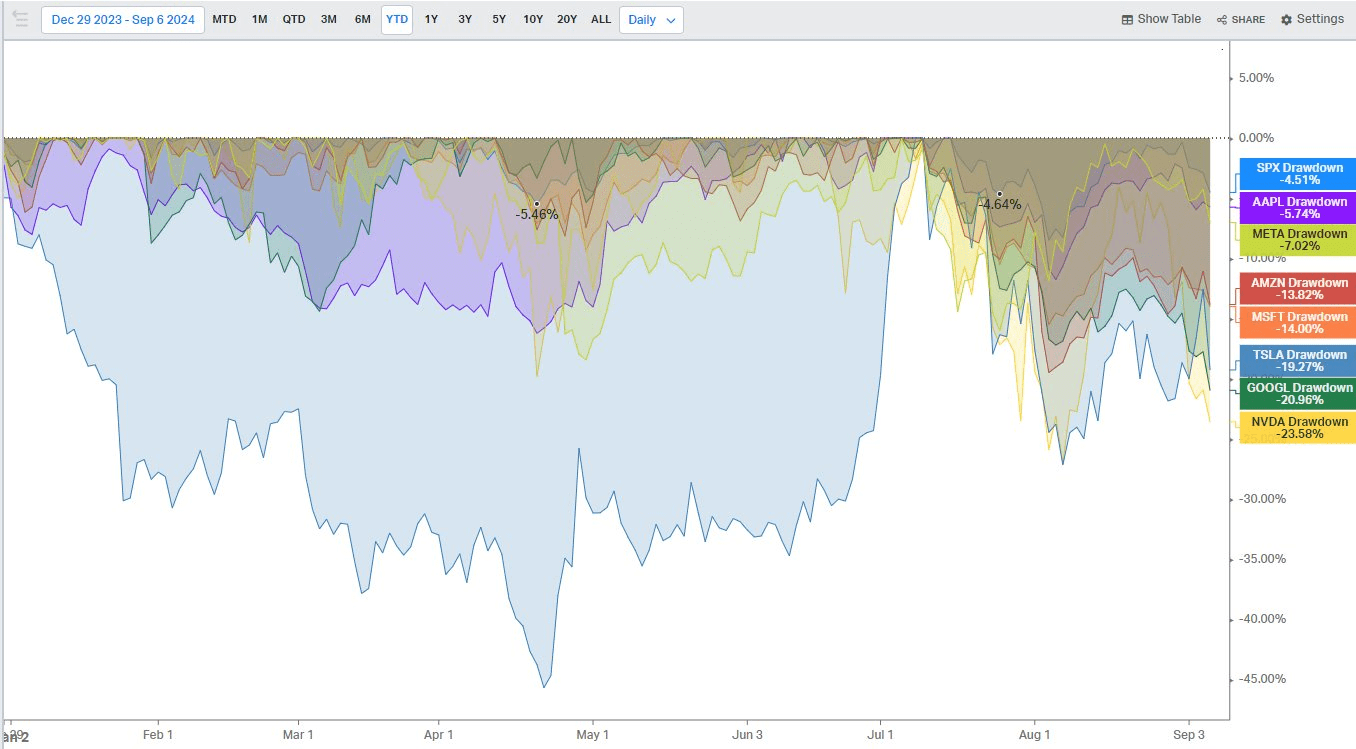
Soft labor market data, including a generally light August payrolls report, was the latest culprit for some Wall Street selling. It wasn’t so much the headline print that worried investors, but negative revisions to the previous two months and a cycle-high in the "underemployment" rate cast doubts on the health of the labor market. Moreover, data before the Friday NFP report suggested a deterioration in the jobs situation.
Goldman: US Economy Needs 150k/mo of Job Growth
Goldman Sachs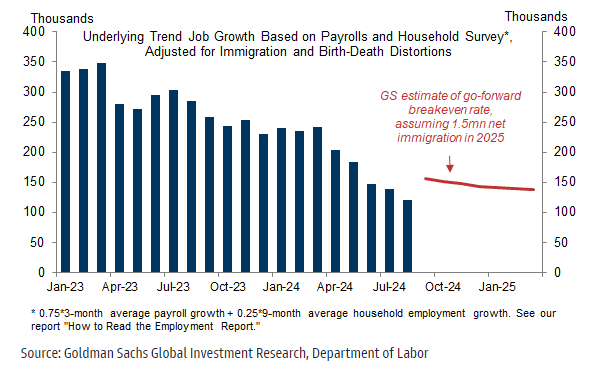
The Sahm Rule Indicator Jumps Further After the August NFP Report
FRED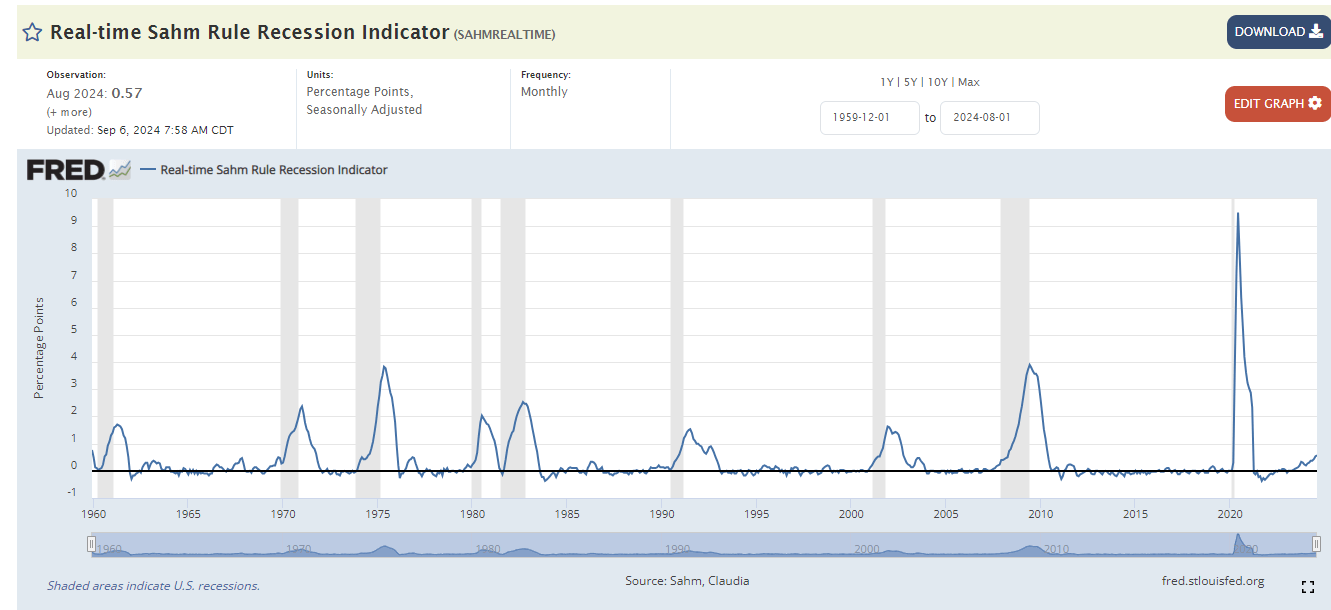
The July JOLTS figure was much lower than expected, while the ADP Private Payrolls number was below estimates. On top of that, the ISM’s Manufacturing and Services Employment subindexes were not all that robust. On the plus side, weekly Initial Jobless Claims do not scream recession, and even Continuing Claims are merely flat since June.
Jobless Claims' Uptrend Stalls Near 230k/Wk
Goldman Sachs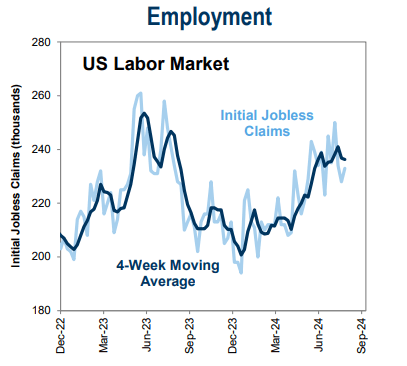
All the while, consumers keep spending, evidenced by an outright strong July Retail Sales report and card-spending data that points to solid consumption, at least by the upper half of the income cohort. Earnings reports from the likes of Five Below (FIVE), Dollar General (DG), and Dollar Tree (DLTR) underscore struggles among lower-income households, however.
Looking ahead, it’s all about inflation this week with NY Fed Inflation Expectations on Monday morning, CPI on Wednesday, PPI on Thursday, and the University of Michigan Surveys of Consumers on Friday. If we indeed see a further cooling of US inflation, then it will give Chair Powell and the rest of the Federal Open Market Committee (FOMC) at the Fed ammo to begin its rate-cutting campaign with a large 50-basis-point ease.
Also, keep in mind that we’ll get August Retail Sales before the FOMC’s decision next Wednesday, September 18.
Data on Tap: Inflation in Focus This Week
BofA Global Research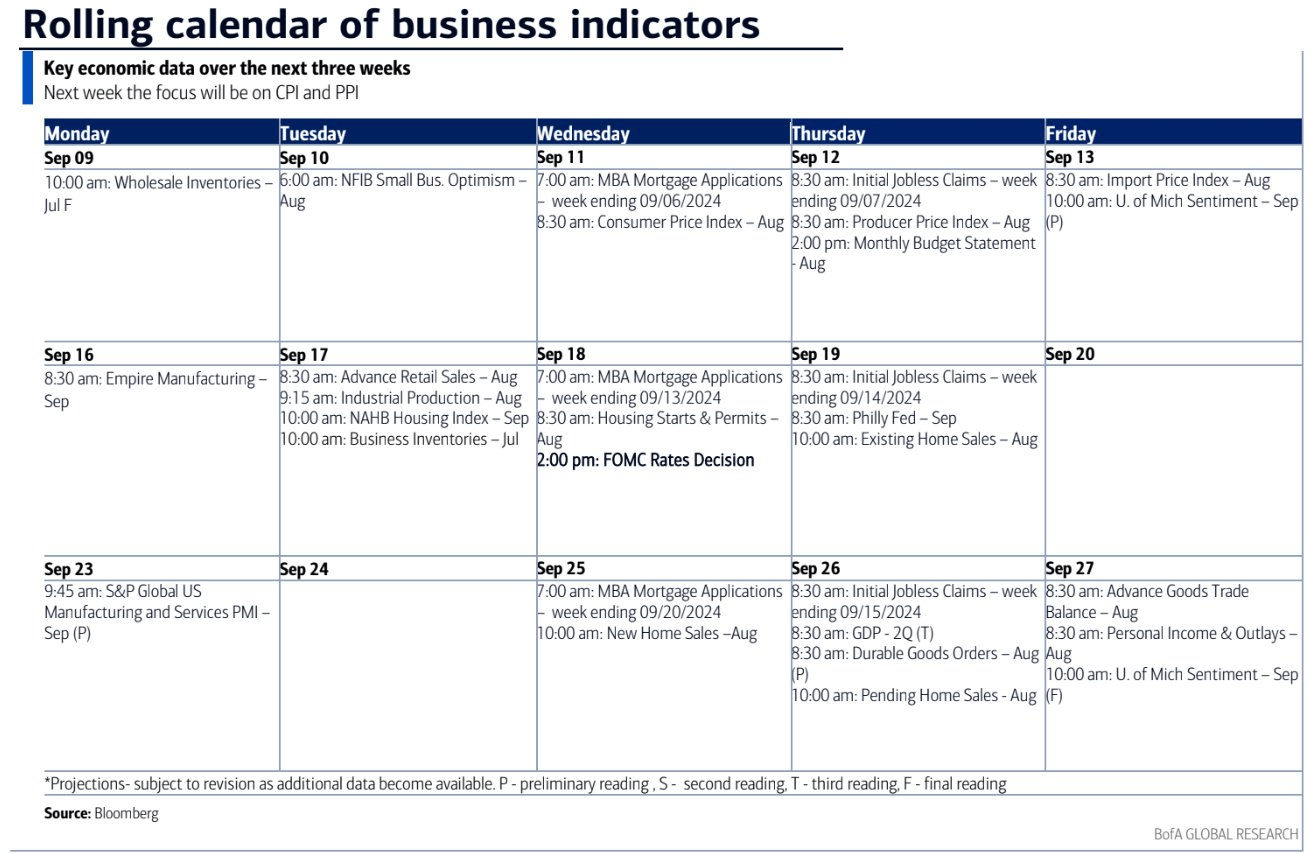
Following a 5% pullback off the early Q3 all-time high, the S&P 500’s forward price-to-earnings ratio has dipped to just 20.2. I estimate that 20 times earnings are a fair level for domestic large caps, given high forecast EPS growth in the out year and generally healthy balance sheets among the world’s largest firms today.
S&P 500 Earnings Snapshot: $268 NTM, $280 Expected in 2025
Yardeni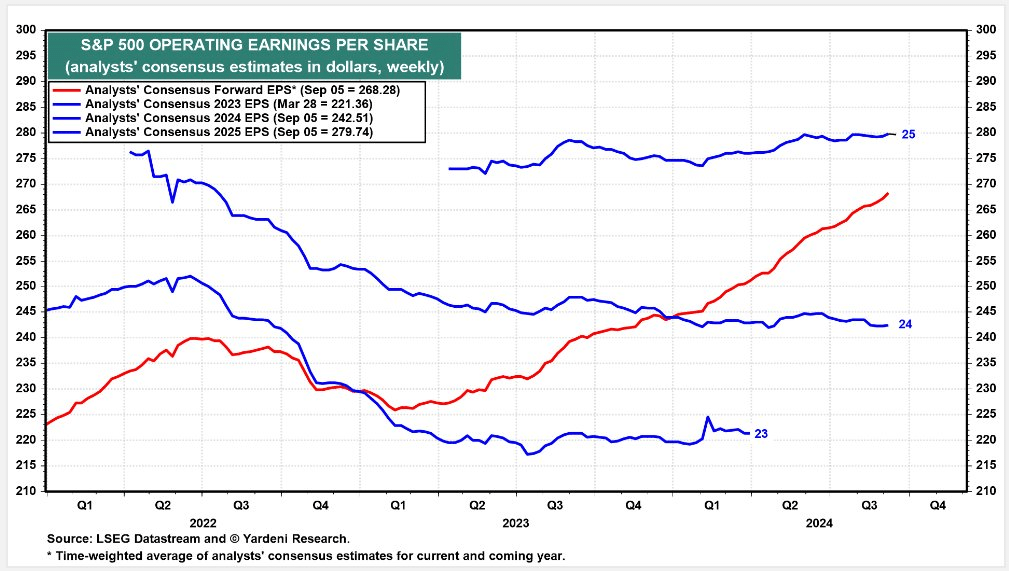
It's also important to recognize that interest rates are materially lower today versus a year ago. Recall that the yield on the benchmark 10-year Treasury note touched 5% in October 2023.
Today, the rate is 3.71% in advance of key inflation data and the Fed’s two-day policy meeting. That means the equity risk premium is a bit better compared with just a few months ago, when the market’s P/E was higher and the real 10-year TIPS yield was closer to 2%.
Interest Rates Fall Back, 10yr To May 2023 Levels
TradingView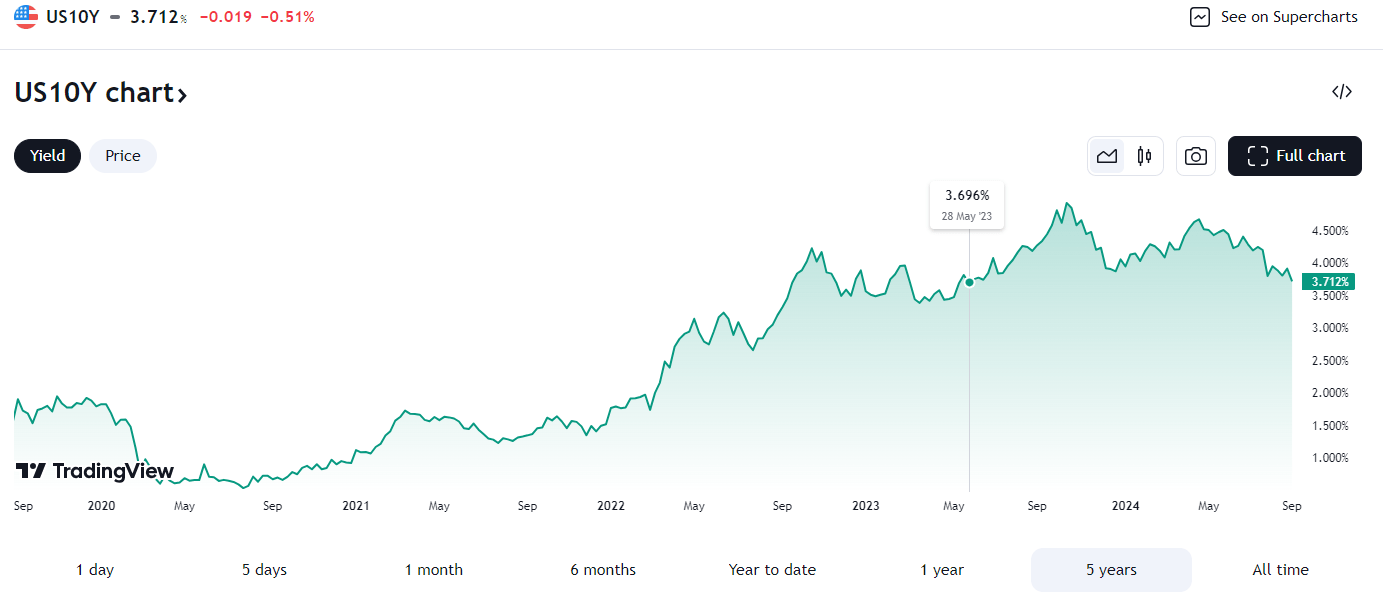
The Technical Take
So, while I see valuations as reasonable, seasonality and technicals remain worrisome, in my view. VTI, like the S&P 500, features a double-top pattern on its chart. The good news is that its long-term 200-day moving average remains positively sloped, suggesting that the bulls control the primary trend.
What I don’t like about the graph right now is that the RSI momentum oscillator printed a much lower high during the August snap back. It’s key that the higher low in price at $251 holds. Falling below that would also mean a drop under the 200dma. $244 is the next layer of support for VTI – the highs from late 2021 and early 2022 as well as where the fund dropped to back in April.
VTI: Bearish Double Top In Play, $251 and $244 Support
StockCharts.com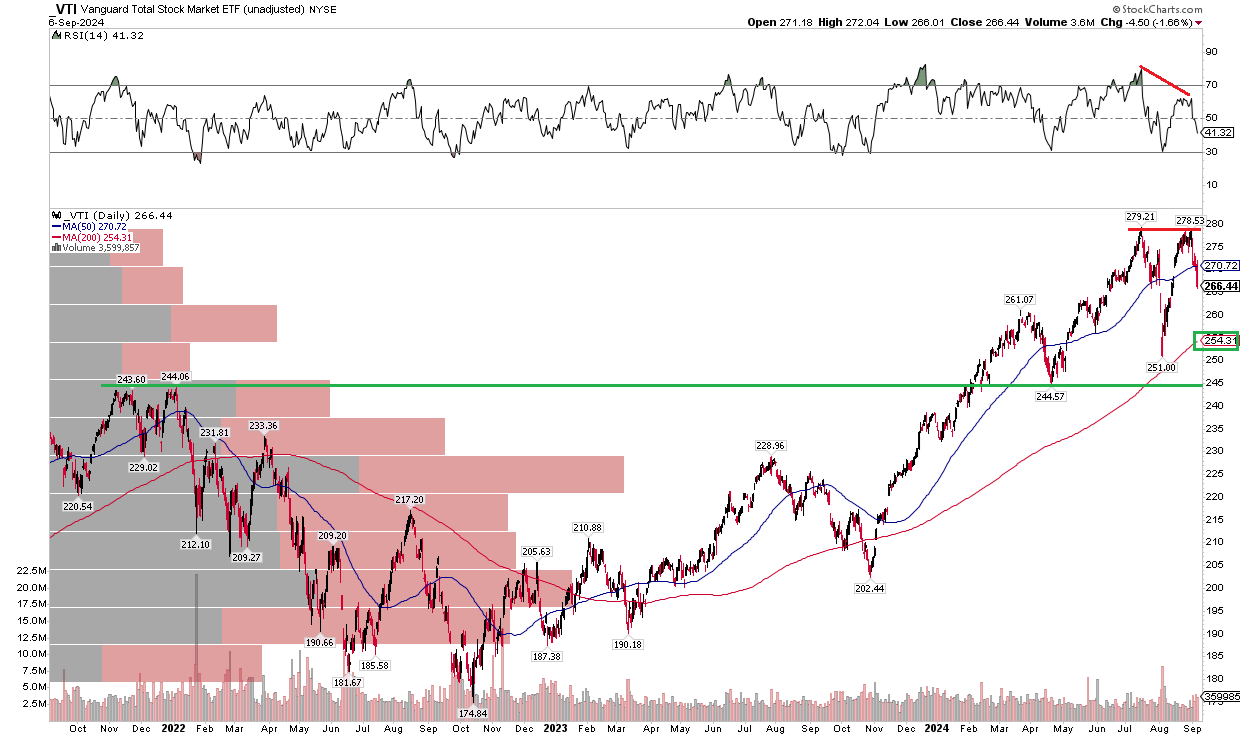
The Bottom Line
I have a hold rating on VTI. Volatility often increases in election years into late October, so further sideways to slightly lower price action would absolutely make sense in the short run. Longer-term, VTI’s valuation is reasonable given EPS growth estimates looking ahead several quarters and considering that real interest rates are about 70 basis points off cycle highs.
Inflation data this week will be key, as well as the mid-month Retail Sales report, ahead of the Fed’s September 18 interest rate decision.