PK-Photos
We’ve got a bunch of shares to cover today. I’ll touch on each briefly. Welcome to shallow dives!
ARMOUR Residential REIT Preferred Share
We’re going to start with ARR-C (ARR.PR.C).
ARR-C is a fixed-rate share with a stripped yield at 7.84% based on a recent price of $22.38 and $.05 in dividend accrual. Assuming no change to the share price, the stripped price would go down slightly as the dividend accrues. The dividend is paid out monthly, which is very rare among preferred shares. This is a reasonable choice for investors who are expecting interest rates to continue falling. The technical factors still point to lower rates as Treasury rates for most durations are still running below their 25-day, 50-day, and 100-day moving averages.
The shares come from ARMOUR Residential REIT (ARR). I wouldn’t suggest buying ARR common shares. I would hardly ever suggest that. I’ve invested in the common shares occasionally for a few quick trades when the discount to book value was large enough. However, anyone looking at the common shares should only view it as a short-term investment. At today’s prices, I wouldn’t make that trade. At $20.44, shares trade at a slight discount to our estimate for current (as of 9/20/2024) book value.
However, we only get interested in ARR common shares when they have a fairly substantial discount. We need a large discount because ARR is spectacular at losing book value. You might think of them as a serial dividend cutter, but it is the book value loss that tends to precede the dividend cutting. As book value per share declines, there is less equity available for management to invest (poorly) to generate “earnings” for the common share dividend.
While the common shares have been a weapon of wealth destruction for many years, the preferred shares have not. The preferred shares rank senior to the common shares. That’s a big deal in these situations because the losses and dilution incurred by common shareholders doesn’t reach the preferred shareholder. So long as ARR issues new equity to cover the losses in book value, the coverage for the preferred shares remains satisfactory. They’ve done that well enough, so the preferred shares still have good coverage.
The fixed-rate dividend for the preferred shares leads to a lower yield than if the shares were floating, but the discount to call value also leaves shares with some upside if interest rates fall. A recession could increase credit spreads, which would be bad for valuation. Other than that, lower rates would be really nice for this fixed-rate preferred share.
Next!
Cherry Hill Mortgage Preferred Share
CHMI-A (CHMI.PR.A) is another fixed-rate share. It’s kind of like ARR-C. However, CHMI-A trades at $24.17. Shares have a higher dividend rate, so they ended up with a higher stripped yield at 8.66% despite the higher price. They also have nearly $.50 of dividend accrual already. I’m expecting shares to be ex-dividend on 9/30/2024. Just a quick note here. I love how MS Word can flag “dividend” in the prior sentence and suggest that the term should be “ex-divided”. Great program.
Consequently, the stripped price is closer to $23.77 presently. In theory. these shares have some upside if rates continue to fall.
However, if an investor wants to speculate on shares falling, I would pick ARR-C instead. CHMI-A leaves so much to be desired. They don’t have much more common equity than preferred equity. That means coverage is pretty bad. We’re looking for a much better coverage ratio. We could use payout ratios to calculate coverage. I do include that in my analysis, but it gets a much lower weight because “Core Earnings” for mortgage REITs have some severe shortfalls. Using book value coverage is usually more reliable since it is harder to “enhance” book value. Don’t you love the word “enhance”? It doesn’t mean the same thing as “manipulate”, but you still understand that the earnings are not a reliable indicator of the health of the “company”. Saying something was "enhanced" doesn't suggest anything illegal or unethical. This is simply an issue with the way earnings metrics are reported for mortgage REITs.
Why would I put company in quotes? Because mortgage REITs are officially companies but functionally, they are leveraged bond funds. That’s part of why we can predict their results so well in advance. We’re simply modeling all the underlying assets and hedges.
Comparing CHMI-A to ARR-C, we can see that ARR-C has quite a bit more upside if rates really fall. I also view ARR-C as a lower-risk alternative. The downside is simply that ARR-C doesn’t offer as much yield as CHMI-A. Regardless, I don’t find the combination of price upside and yield for CHMI-A to be high enough to like the shares given the risk created by their combination of weak coverage and clear history of losing book value per share.
PennyMac Preferred Share
PMT-A (PMT.PR.A) is a preferred share from PennyMac Mortgage Trust (PMT). It’s one of the few shares that is neither a fixed-to-floating share or a fixed-rate share. It occupies a special category we called “fixed-to-lawsuit”. That lawsuit is already in place. PMT had a brilliant idea to determine that the LIBOR Act gave them immunity to turn their fixed-to-floating shares into fixed-rate shares. There are many reasons that their logic fails.
It’s a bit harder to prove PMT wrong because they didn’t have the courage to explain why they thought the LIBOR Act would turn their fixed-to-floating shares into fixed-rate shares. By not giving a reason, they put a bigger burden on everyone who said they were wrong to disprove every potential argument PMT might try. It’s like a high schooler refusing to provide any evidence for their conclusion so they can pick their argument retroactively.
I wrote about this when it happened and followed up on it subsequently. I explained in great detail why I believed PMT was wrong. The lawyers came months later and filed suit against PMT. Just in case they managed to miss my articles (which would be pretty hard since some of them rank on Google), I sent complimentary copies to the lawyers suing PMT. Why not? I’m not a lawyer. I’m not a judge. I’m an investor who made quite a bit of coin by investing in the preferred shares when the market went into a panic over management’s statements.
If PMT-A floats (in accordance with the law), the dividend should be much higher. That would probably push the shares over $25.00. Oh look, they trade around $24.95 today. The market went from believing management to pricing shares on the assumption that management will most likely lose. That seems pretty reasonable. As it stands, it would appear management is just wasting the common shareholders’ money. The management company was named in the lawsuit, but don’t worry, PMT will pay the costs of defending the external manager from the repercussions of their decisions.
I should point out that some people still disagree with me. However, the market has come around to my thinking twice. Some investors ask me why I would bother investing in a company with management that would try to change fixed-to-floating shares into fixed-rate shares. I’ve got quite a few reasons. $19,653.70 of them. That’s my total realized return across my investments in PMT-A and PMT-B. I don’t currently have an open position because the remaining upside from floating is much smaller.
I was big on buying shares when they were priced as if the shares were probably not floating. When the market prices them based on a very high probability of floating, then my upside scenario is already in place.
If shares remain fixed-rate (seems unlikely to me long-term) then the stripped yield is about 8.19%. However, if they were floating as indicated in the prospectus, then the yield would be about 10.83%. For PMT’s preferred shares, that 10.83% yield would be really attractive.
Invesco Mortgage Preferred Share
This is a share no one cares about. I checked how many times the ticker was searched. No one cares about this share. Regardless, there hasn’t been any coverage about it in months so I’m going to say something.
IVR-C (IVR.PR.C) is a fixed-to-floating preferred share. That sounds nice while short-term rates are elevated. On the other hand, it doesn’t begin floating until 9/27/2027. That’s about 3 years away. As we’ve found for preferred shares that are waiting to float, even one year can seem like quite a long time. In other words, in two years, it may still feel like a long-time before shares float.
I’m not a big fan of IVR-C. Let’s look at the reasons.
- The stripped yield based on $24.24 today with about $.10 of dividend accrual is only 7.77%. That’s pretty low. You can beat that in this sector by buying bonds.
- The price only has modest upside. At $24.24, there’s no remotely reasonable argument to suggest that the price would rally much. If investors are lucky, maybe it breaks $25.00? It shouldn’t, but it could.
- The annualized yield to call is about 8.9%. That might sound good, but again, that’s only moderately better than bond yields. So even if the investor gets the call scenario, the realized return wouldn’t be huge. It wouldn’t be bad, but who is getting pumped up about an 8.9% best-case scenario? That would be great for a worst-case scenario, but not a best-case scenario.
- The floating spread is 5.289%. That’s not really low, but it isn’t great. Some of the AGNC preferred shares have a floating spread around 5%. The gap in risk levels looks like the Grand Canyon.
- IVR did a poor job of protecting common shareholders during the pandemic. We’re not in the pandemic today, but great managers had an opportunity to demonstrate their ability to hedge risk.
This is what I call a poor job for the common shareholders:
Seeking Alpha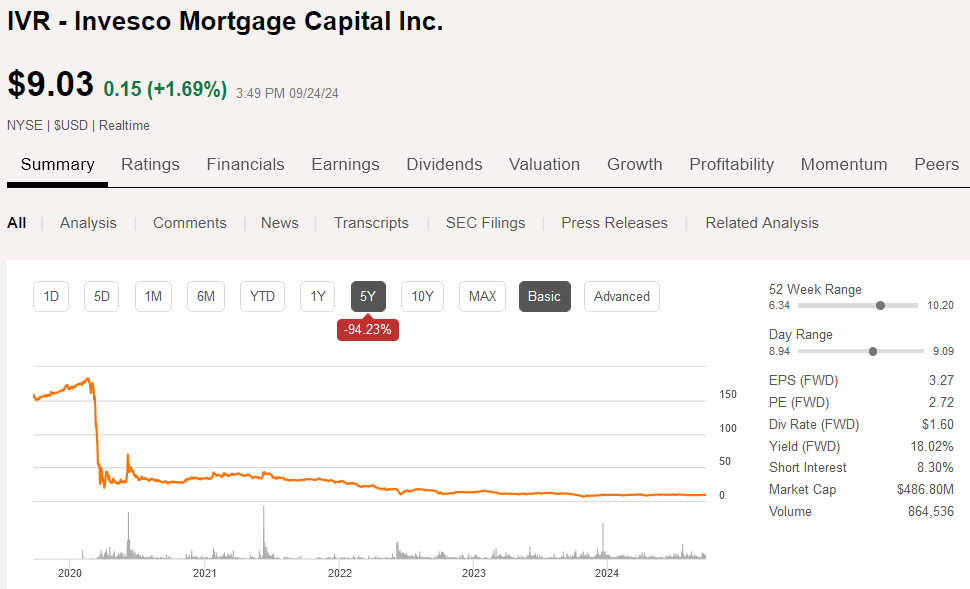
Awesome.
Next share!
Dynex Capital Preferred Share
Dynex Capital (DX) has one preferred share: DX-C (DX.PR.C). I like these shares much better than the ones we covered so far.
To be clear, DX-C has less upside. Shares trade at $25.41, but they have about $.41 of dividend accrual (expected ex-div on 10/01/2024). That puts the stripped price around $25.00. The shares become callable and begin floating on 4/15/2025. The call risk is material here. The 5.461% spread is higher than we see for any other share with a comparable risk rating. The closest comparable is AGNCN (AGNCN) with a 5.1111% spread.
Therefore, we need to be aware of the call risk. The yield to call is only 6.5%. Clearly, that’s not enough for me to get excited. However, DX-C is one of the lowest-risk preferred shares we cover.
- DX runs a portfolio of agency MBS.
- They hedge intelligently against movements in interest rates.
- They manage their book value exposure better than most peers.
- They demonstrated it during the pandemic.
Consequently, unless we hit a recession (widening credit spreads), I think investors will probably earn at least 6.5%. If the shares are not called, then I think they have a pretty good shot to trade above $25.00 plus dividend accrual. That’s pretty nice. It creates a catalyst in about 7 months that gives shares a strong chance to trade at a premium.
I should also point out that sometimes the price bounces around a bit. When shares are callable in about 7 months, the price moving $.15 in either direction can create a material change in the yield to call.
Because of the call risk, I get quite a bit more excited at DX-C at moderately lower prices. Even taking $.08 off the share price can create a modest bump to the yield to call.
I have a pretty significant position in DX-C at 5.81% of my portfolio (given recent values across all investments).
Shares of DX-C only have a stripped yield of 6.9% today, but if they were floating today it wouldn’t bump the yield much over 10.3%. However, we should also recognize that there may be a few more reductions to short-term rates before the shares begin floating. That’s still fine. My concern is primarily the call risk anyway because I think the 5.461% spread is reasonable compensation for the risk.
Ready Capital
I’m switching from the preferred shares to touch on a common share.
Ready Capital (RC) is one of my common share positions. It had a bit of a rally lately, but it hasn’t lived up to my expectations so far. Management had a strong record, aside from their acquisition of Broadmark. They did a pretty good job of protecting book value per share while paying out a respectable stream of dividends. They’ve had a much harder time over the last few years with the weakness in real estate values. I’m still invested in RC and still looking for them to recover. However, it’s worth mentioning that this call still hasn’t played out for me. Most of the time our calls play out faster, rather than trending down for a prolonged period.
If you don’t want to count ARR-C as yielding at least 8% (requires rounding up), you can count the mention of Ready Capital with its 12.6% yield (after the cut).
Recap
- ARR-C is okay. Not bad, but not really exciting.
- CHMI-A is a higher risk version of ARR-C with less upside but a bit more yield. It’s not as good.
- PMT-A should be floating, but management is still planning to fight in court. Will they have a shocking defense no one has considered? I doubt it.
- IVR-C floats in 3 years. Yield to call isn’t high enough to excite me for the risk rating. If it was lower risk, I could be pretty interested.
- DX-C floats in April 2025. The yield to call is lower than IVR-C, but the risk rating is much lower. If shares are not called, I think they would trade above $25.00 plus dividend accrual. Several other floating-rate shares are already doing that. Even NLY-G (NLY.PR.G) trades a tiny bit over $25.00 + dividend accrual and NLY-G only has a 4.172% spread.
- RC has struggled much longer than I initially expected. I still expect things to turn around.
Preferred Share Guide
I regularly encourage investors to focus on preferred shares for this sector rather than common shares. The preferred shares typically offer a much better total shareholder return over long periods and they do it with far less volatile. Consequently, it’s a much better choice for long-term investors. The preferred share guides also provide some opportunities to swap between similar shares, which can enhance returns.
If you’re interested in preferred shares, make sure to check out our huge free guide to preferred shares.
You know it’s great, because I wrote it. You know it’s long, because it’s over 67 pages. Examples take space.
We could’ve had less examples, but then it wouldn’t be as good.
Many readers have told me it’s their primary resource for learning how preferred shares work.
It took a few years to bring it all together, so I hope readers enjoy it.
Stock Table
We will close out the rest of the article with the tables and charts we provide for readers to help them track the sector for both common shares and preferred shares.
We’re including a quick table for the common shares that will be shown in our tables:
Type of REIT or BDC | ||||
Residential Agency | Residential Hybrid | Residential Originator and Servicer | Commercial | BDC |
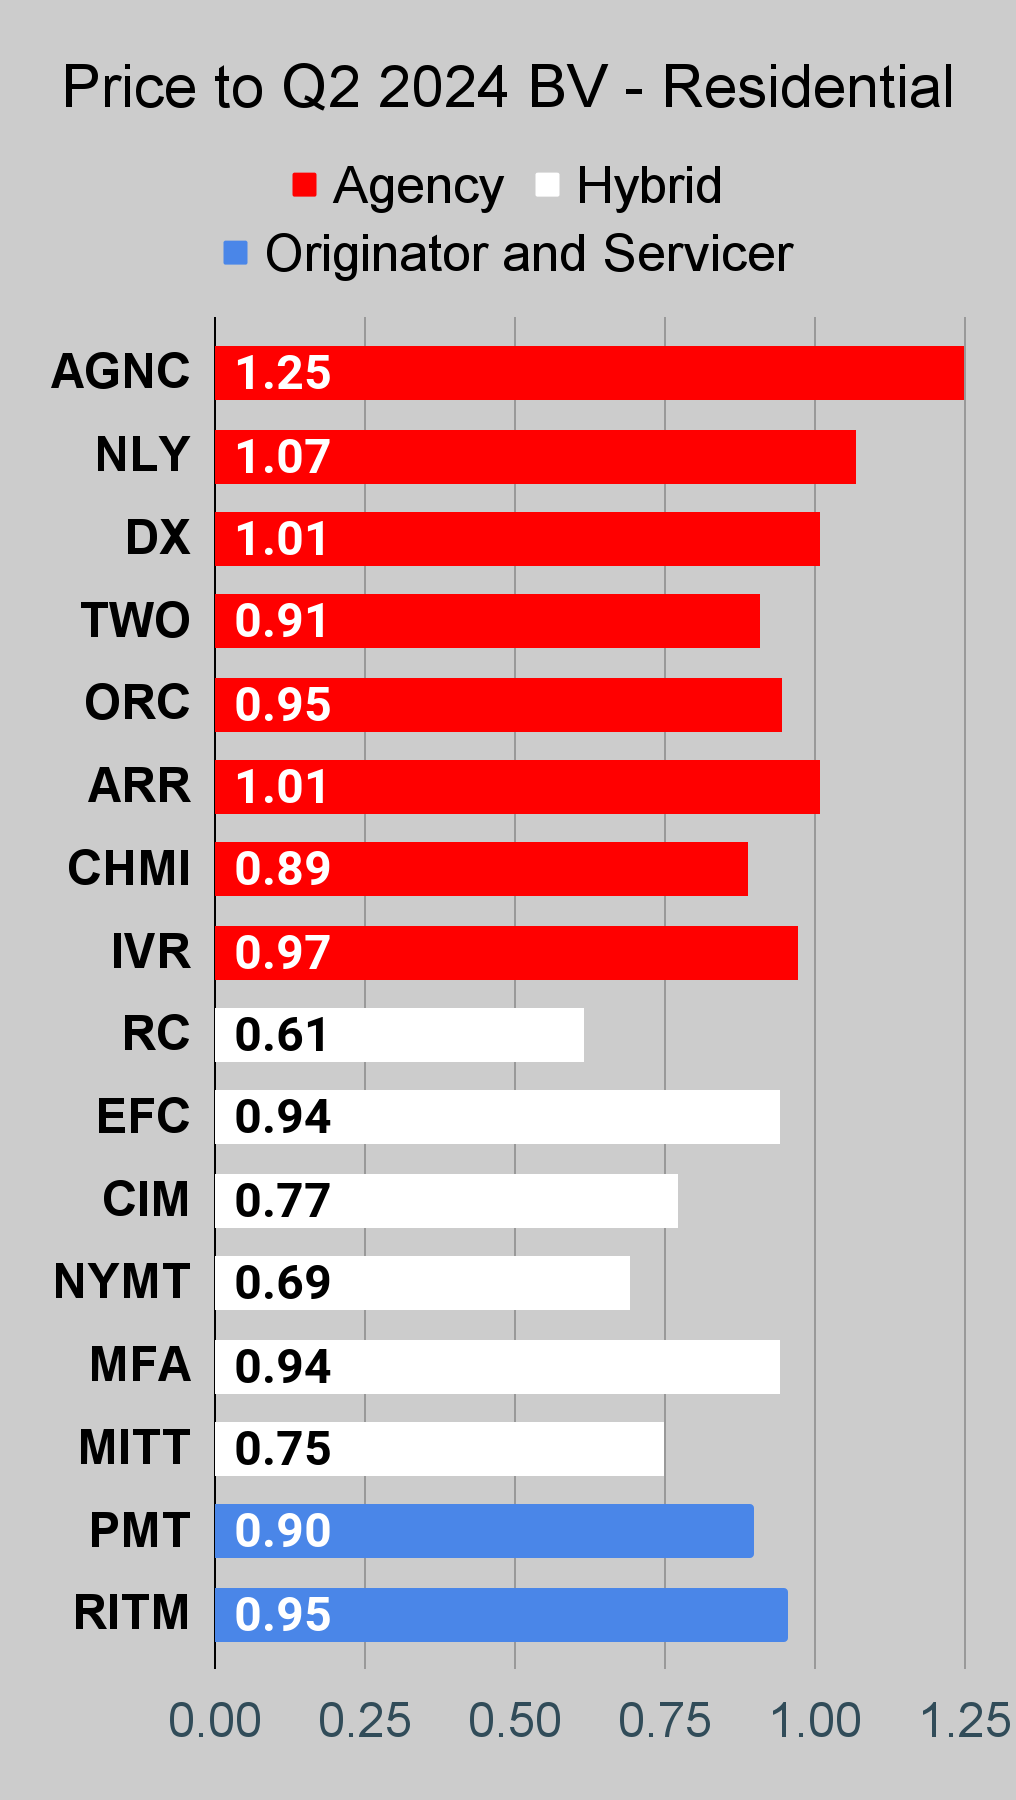
If you’re looking for a stock that I haven’t mentioned yet, you’ll still find it in the charts below. The charts contain comparisons based on price-to-book value, dividend yields, and earnings yield. You won’t find these tables anywhere else.
For mortgage REITs, please look at the charts for AGNC, NLY, DX, ORC, ARR, CHMI, TWO, IVR, CIM, EFC, NYMT, MFA, MITT, AAIC, PMT, RITM, BXMT, GPMT, WMC, and RC.
For BDCs, please look at the charts for MAIN, CSWC, ARCC, TSLX, TPVG, OCSL, GAIN, GBDC, SLRC, OBDC, PFLT, TCPC, FSK, PSEC, and MFIC.
This series is the easiest place to find charts providing up-to-date comparisons across the sector.
Notes on Chart Sorting
Within each type of security, the sorting is usually based on risk ratings. However, it is quite common to have a few shares that are tied. When the shares are tied for risk rating, the sorting becomes arbitrary. There may occasionally be errors where a share’s position is not updated quickly following a change in the risk rating. That can happen because the charts come from a separate system. When I update the system we use for members, it doesn’t change the order in the charts.
When I say “within each type of security”, I’m referencing categories such as “agency mortgage REITs”. The “hybrid mortgage REITs” are all listed after the “agency mortgage REITs”. However, that does not mean RC (lowest hybrid) has a higher risk rating than the highest agency mortgage REIT. Each batch is presented by themselves.
PMT and RITM are tied for risk rating.
This could probably be written better. If someone feels inclined to take it upon themselves to write a section that is objectively better at communicating these points, I would be interested in using it. I’m grateful to have the best readers on SA. I attribute this to self-selection bias. I include enough things to offend the dumb people that I’m left with the best readers.
Note: The chart for our public articles uses the book value per share from the quarter indicated in the chart. We use the current estimated (proprietary estimates) book value per share to determine our targets and trading decisions. It is available in our service, but those estimates are not included in the charts below. PMT and NYMT are not showing an earnings yield metric as neither REIT provides a quarterly “Core EPS” metric. Presently, a few other REITs also have no consensus estimate.
Second Note: Due to the way historical amortized cost and hedging is factored into the earnings metrics, it is possible for two mortgage REITs with similar portfolios to post materially different metrics for earnings. I would be very cautious about putting much emphasis on the consensus analyst estimate (which is used to determine the earnings yield). In particular, throughout late 2022 the earnings metric became less comparable for many REITs.
Residential Mortgage REIT Charts
 The REIT Forum | 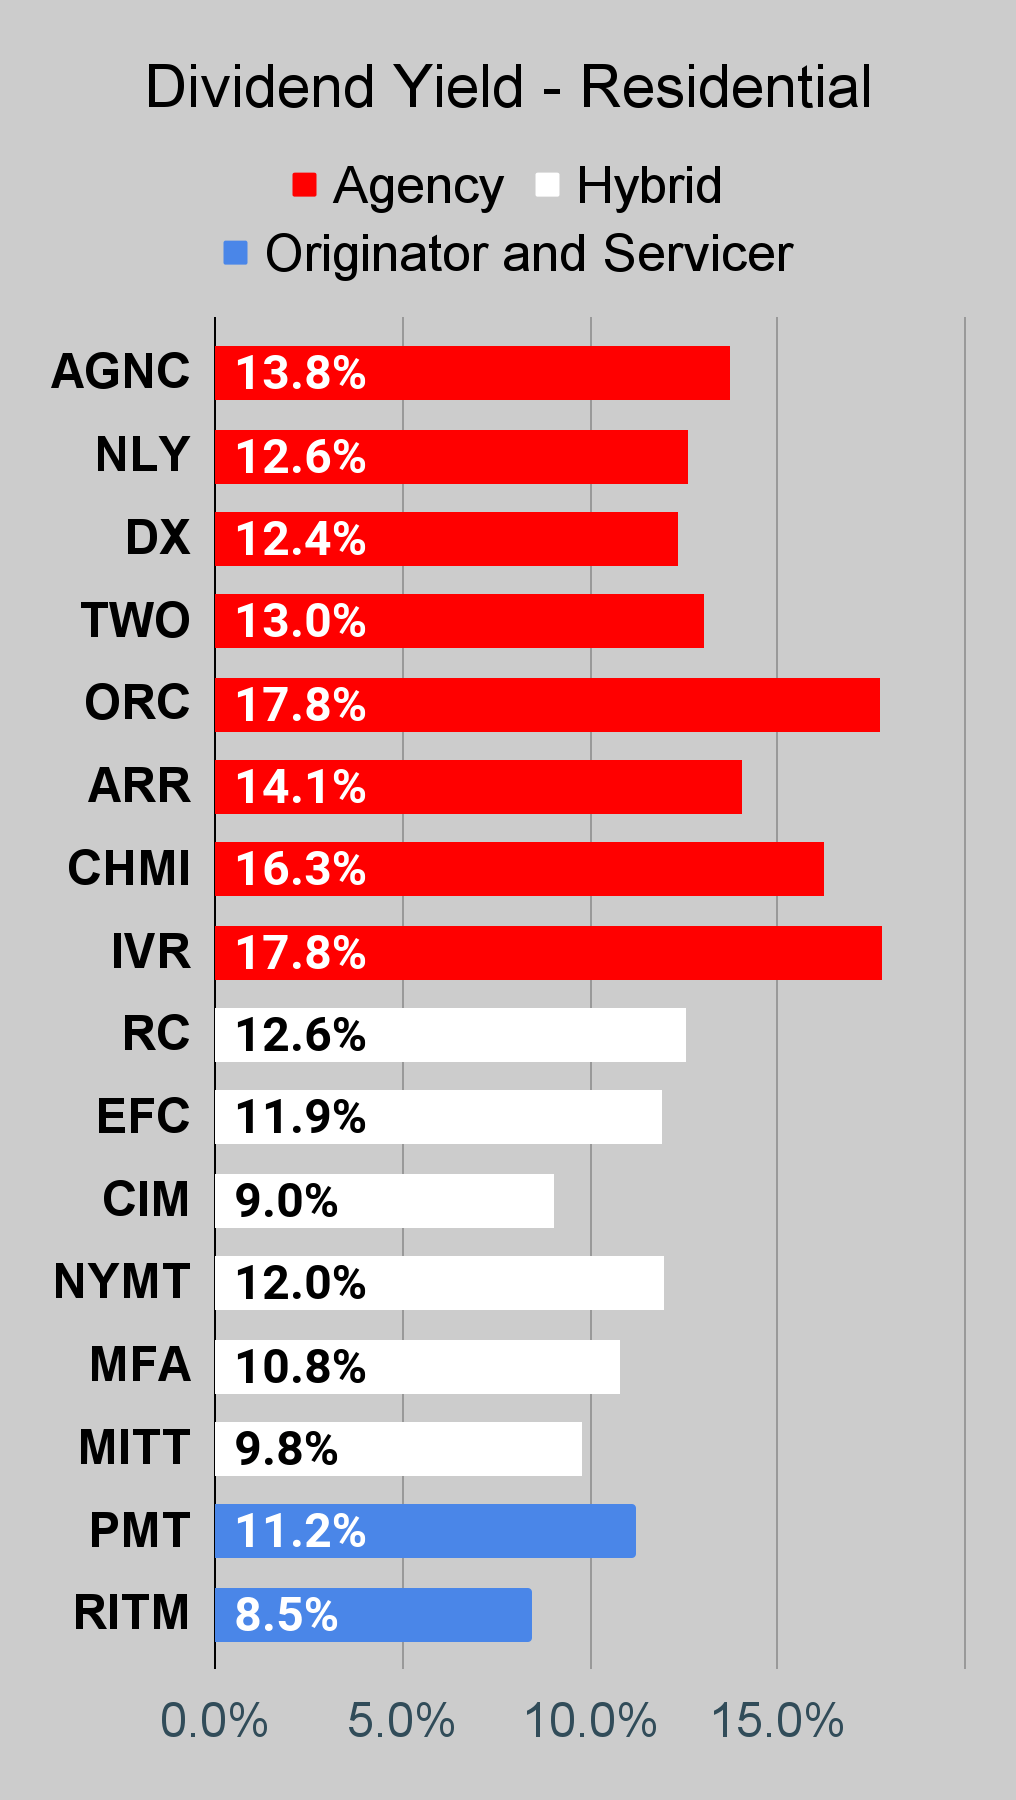 The REIT Forum | 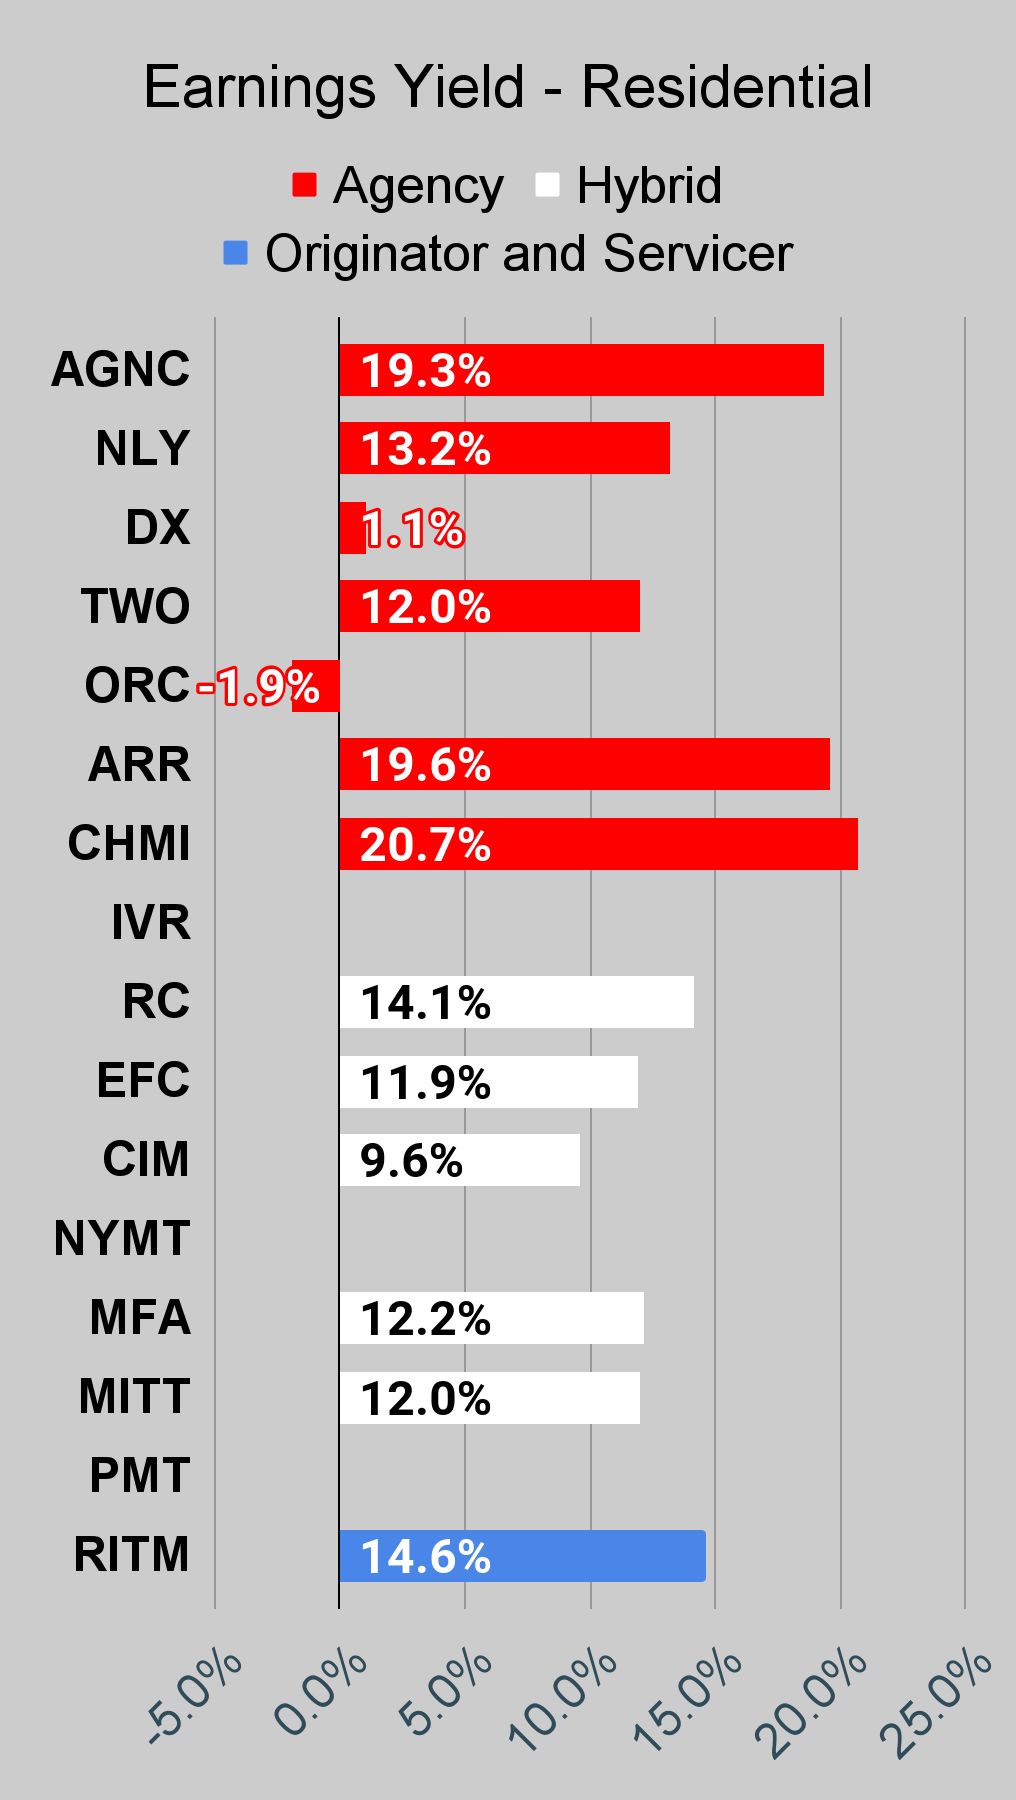 The REIT Forum |
Commercial Mortgage REIT Charts
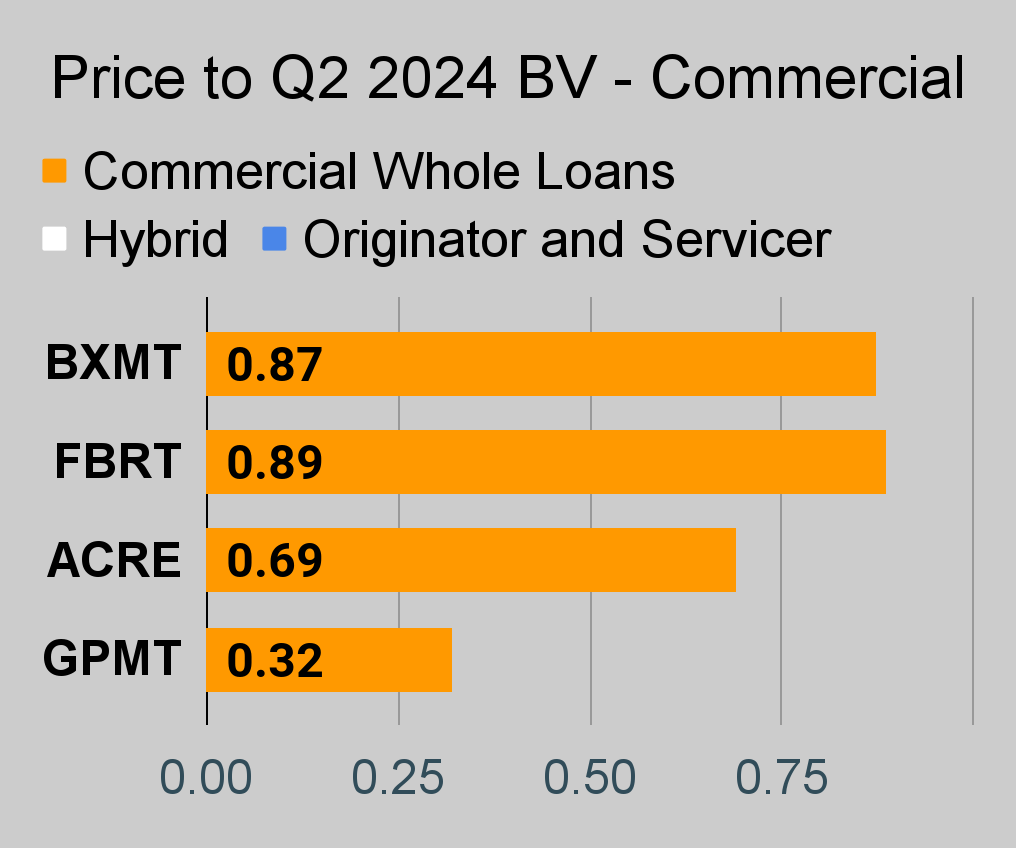 The REIT Forum | 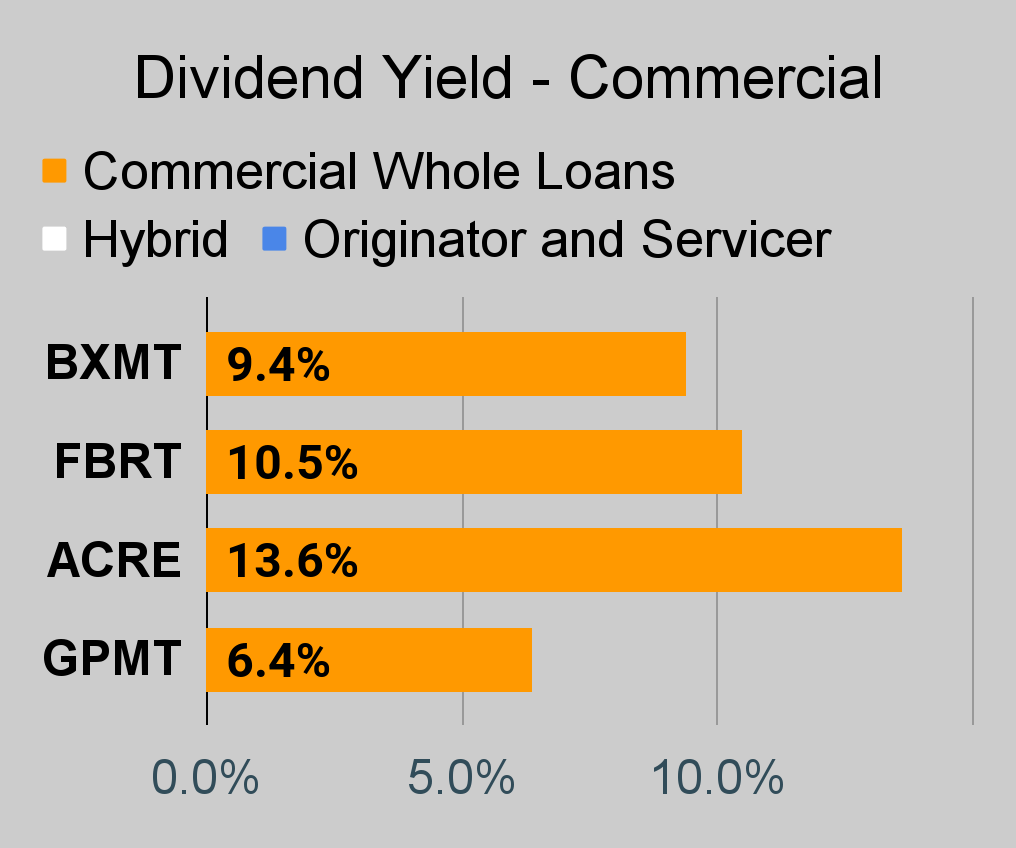 The REIT Forum | 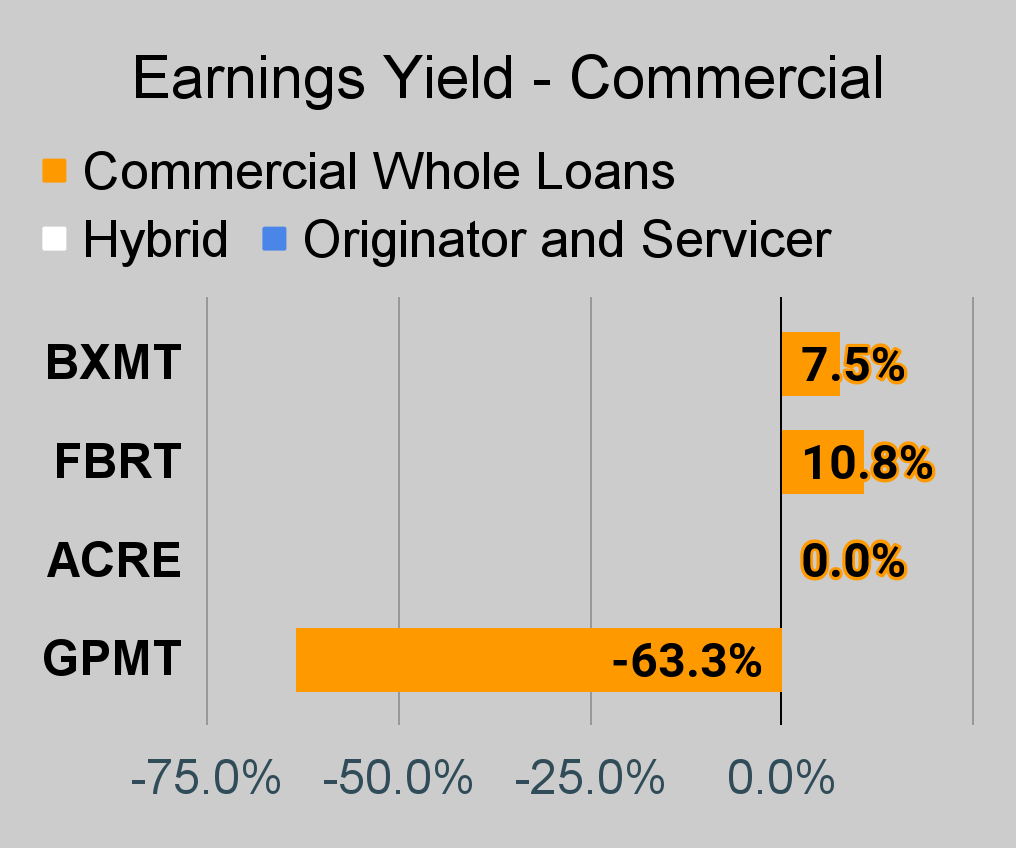 The REIT Forum |
BDC Charts
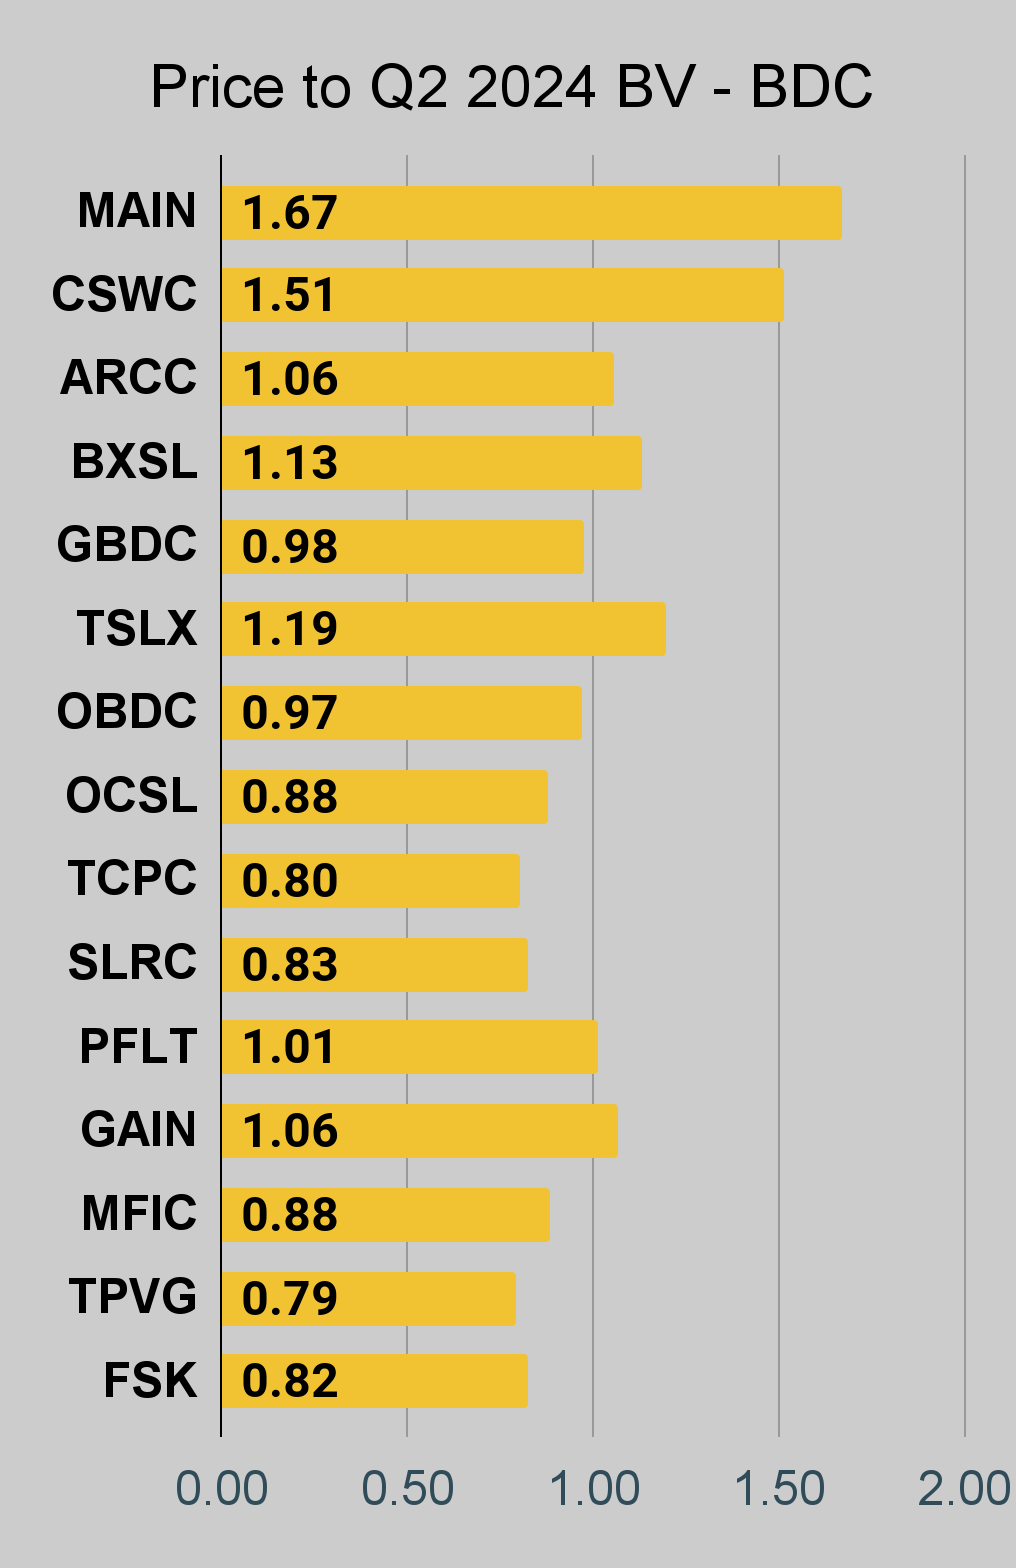 The REIT Forum | 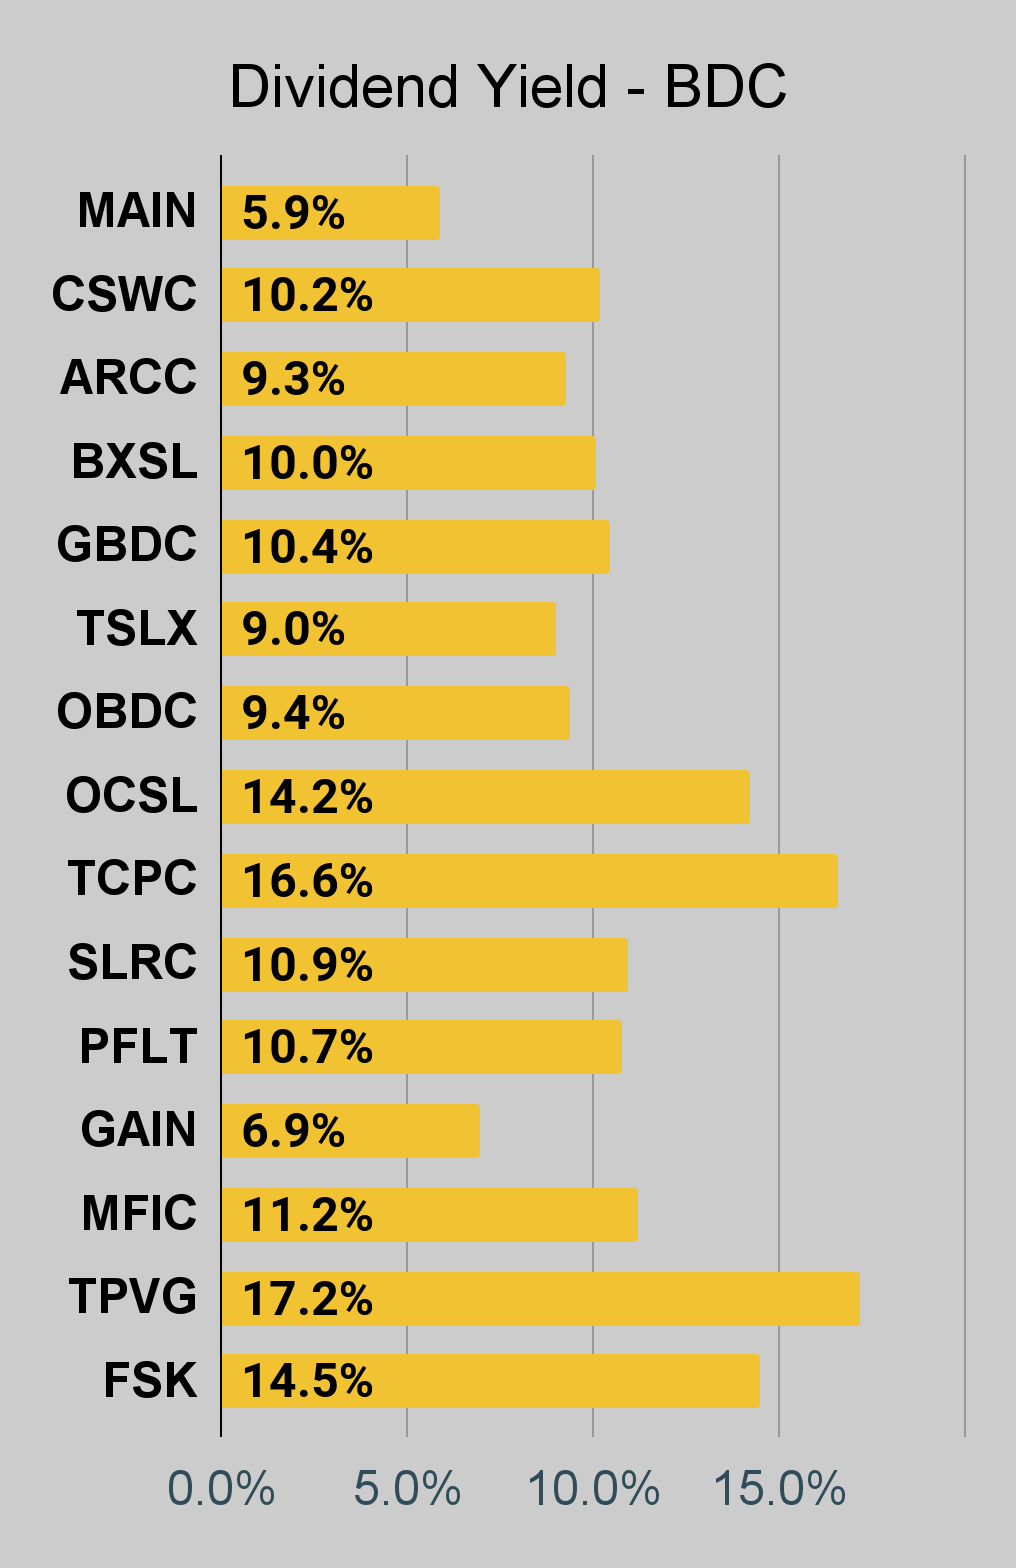 The REIT Forum | 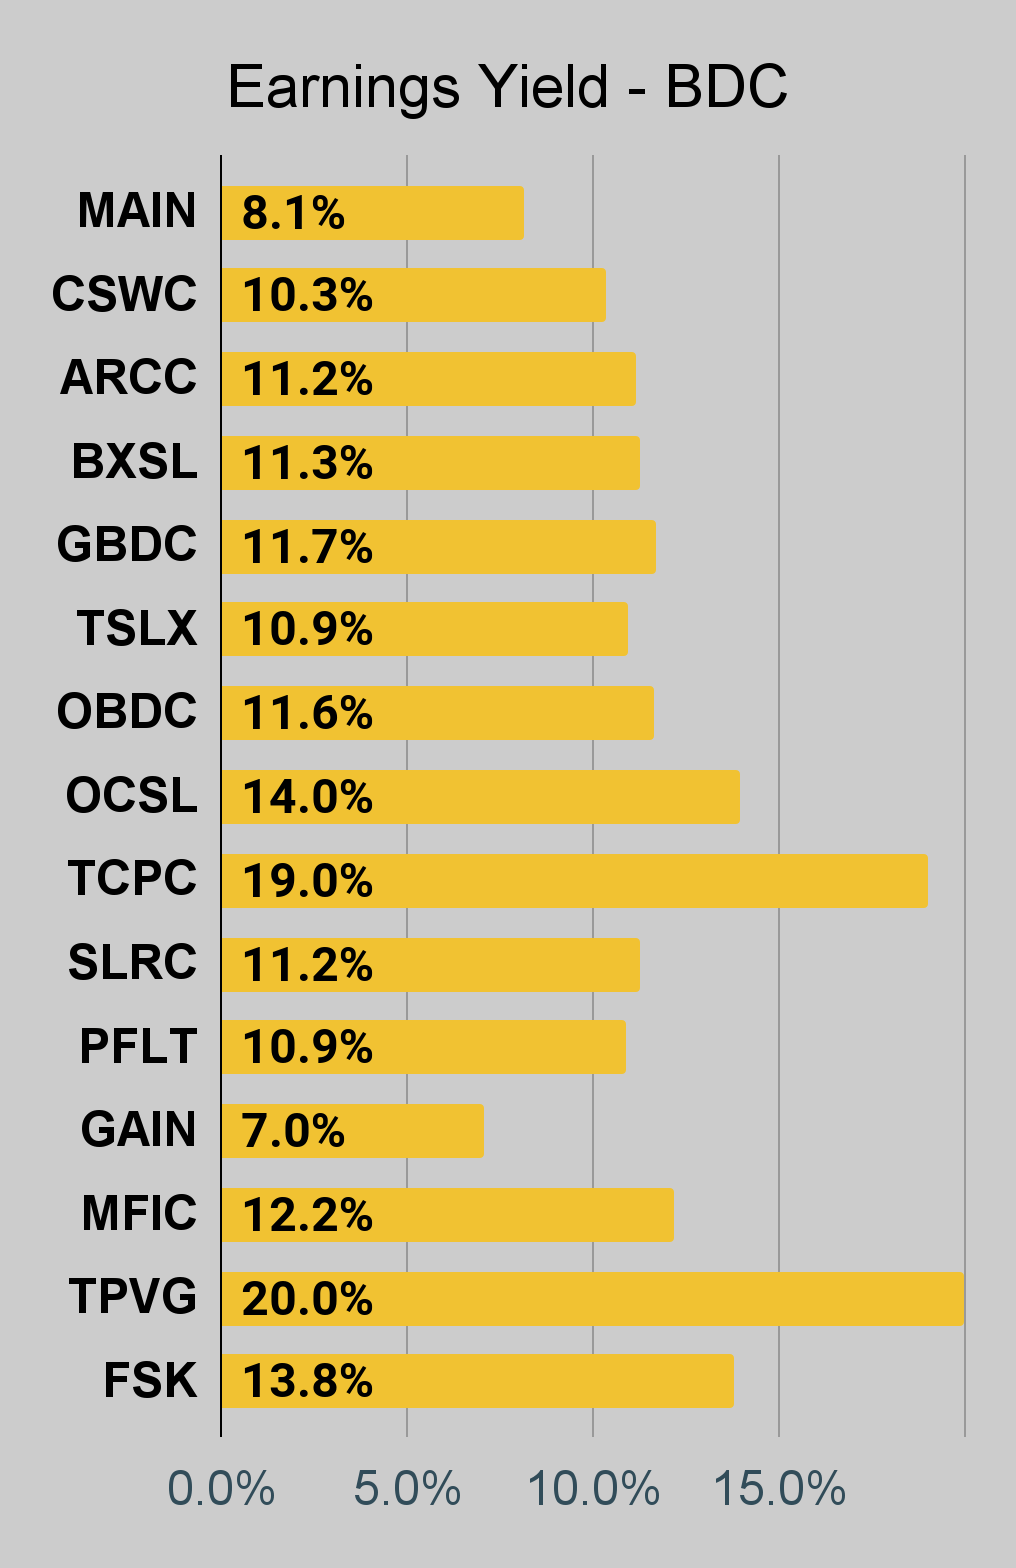 The REIT Forum |
Note: A company may have a price to BV ratio of 0.00 in the chart if they didn’t report the book value yet or if the price failed to import. If it was the price, you’ll see the dividend yield and earnings yield are also blank.
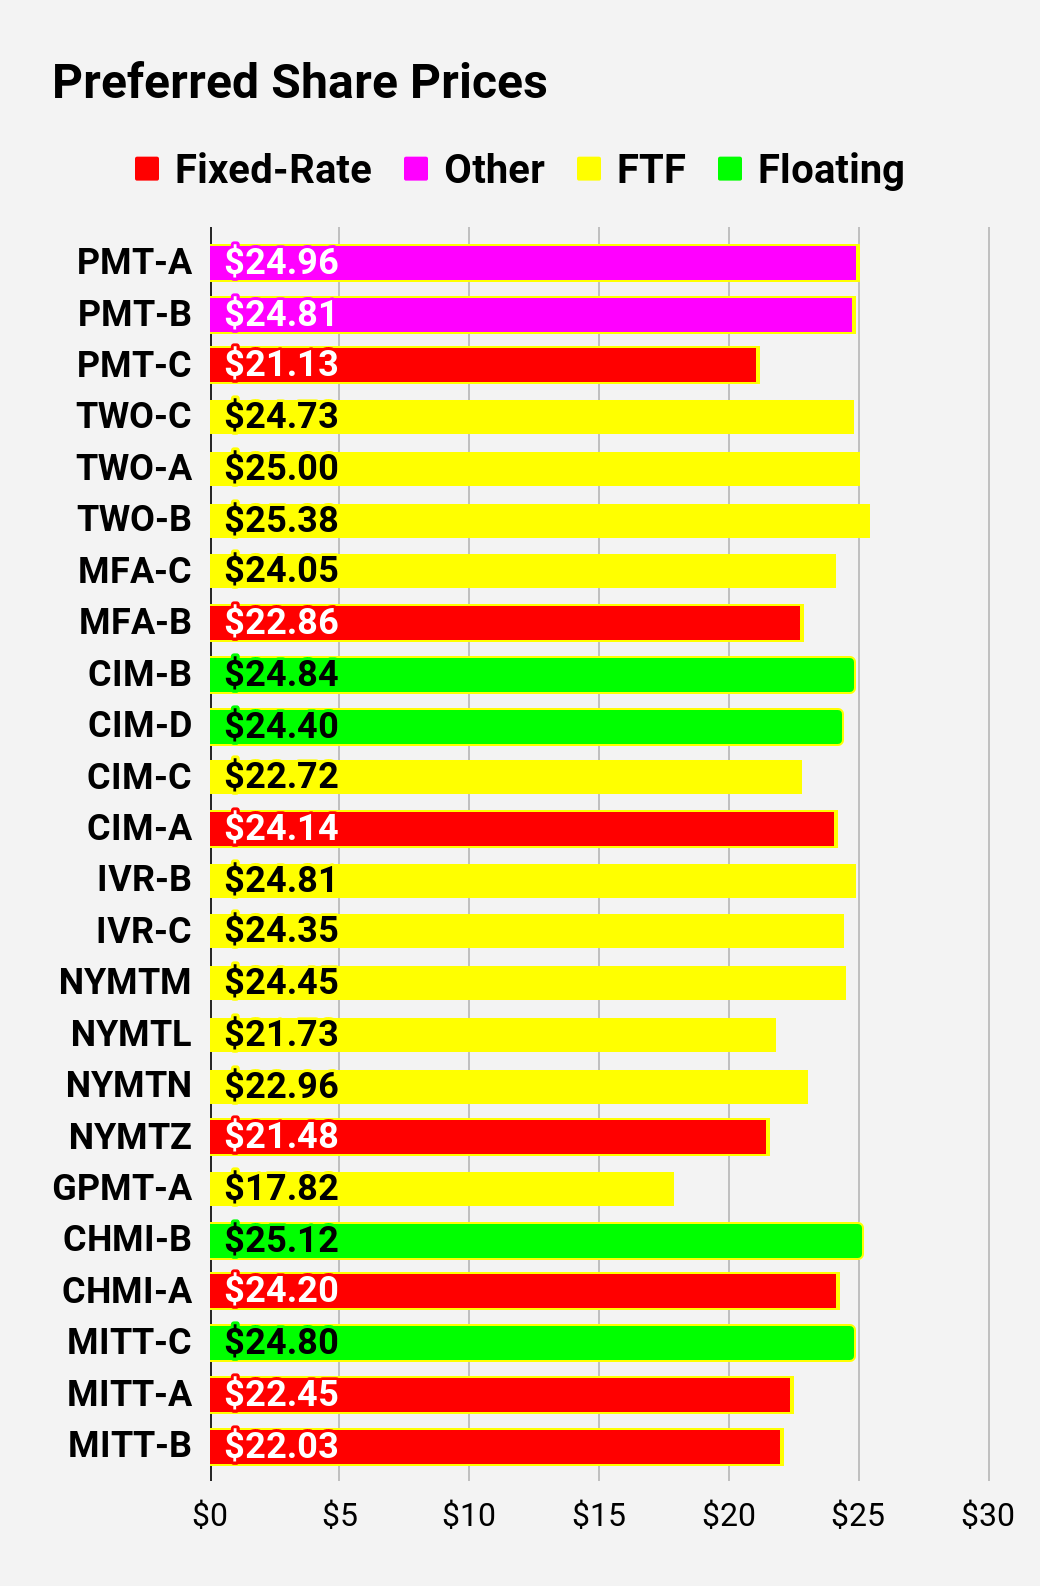
Preferred Share and Baby Bond Charts
I changed the coloring a bit. We needed to adjust to include that the first fixed-to-floating shares have transitioned over to floating rates. When a share is already floating, the stripped yield may be different from the “Floating Yield on Price” due to changes in interest rates. For instance, NLY-F already has a floating rate. However, the rate is only reset once per 3 months. The stripped yield is calculated using the upcoming projected dividend payment and the “Floating Yield on Price” is based on where the dividend would be if the rate reset today. In my opinion, for these shares the “Floating Yield on Price” is clearly the more important metric.
 The REIT Forum | 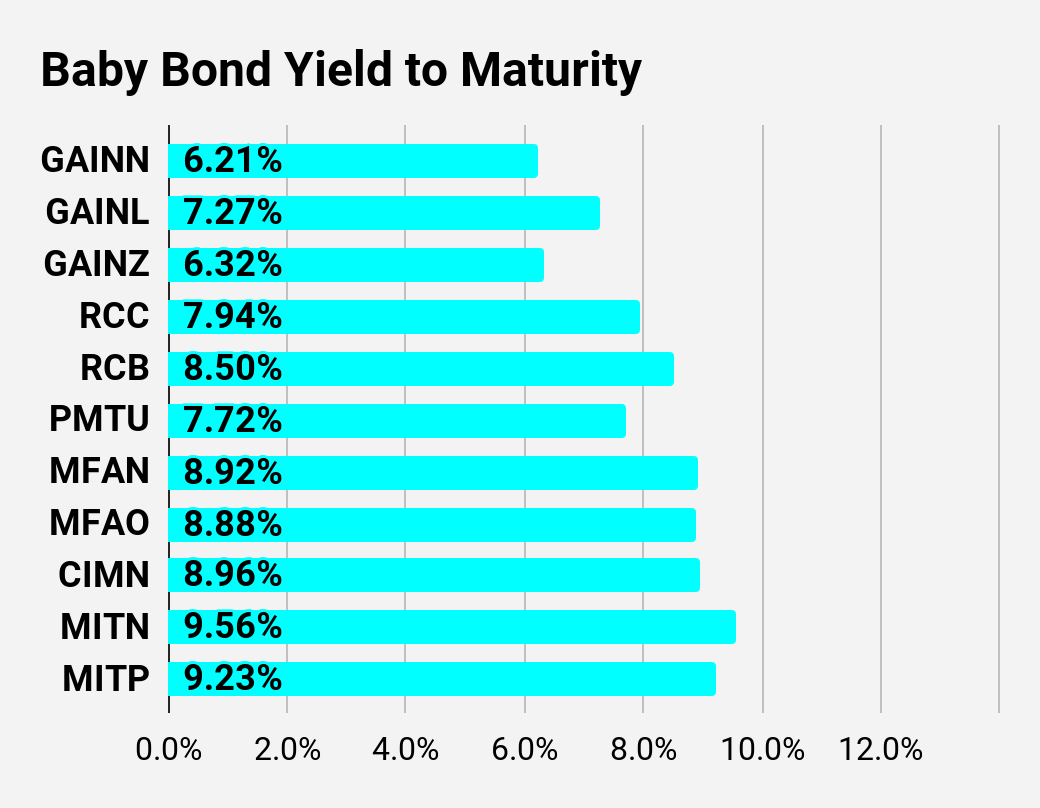 The REIT Forum | 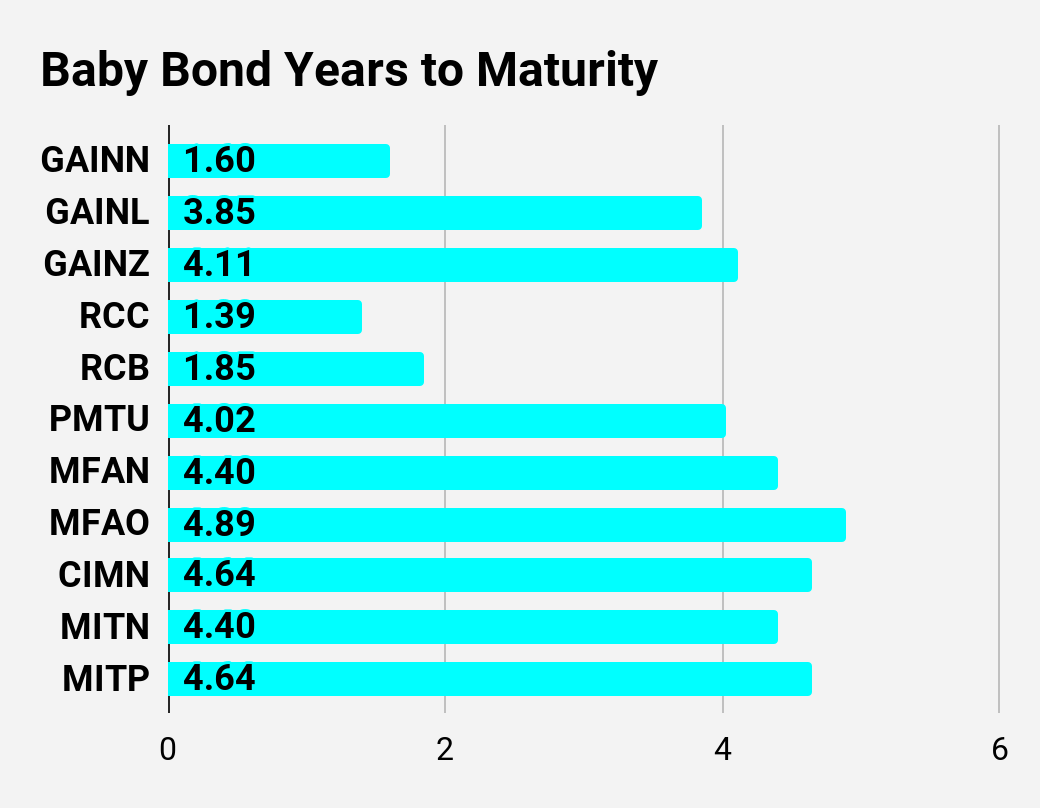 The REIT Forum |
 The REIT Forum | 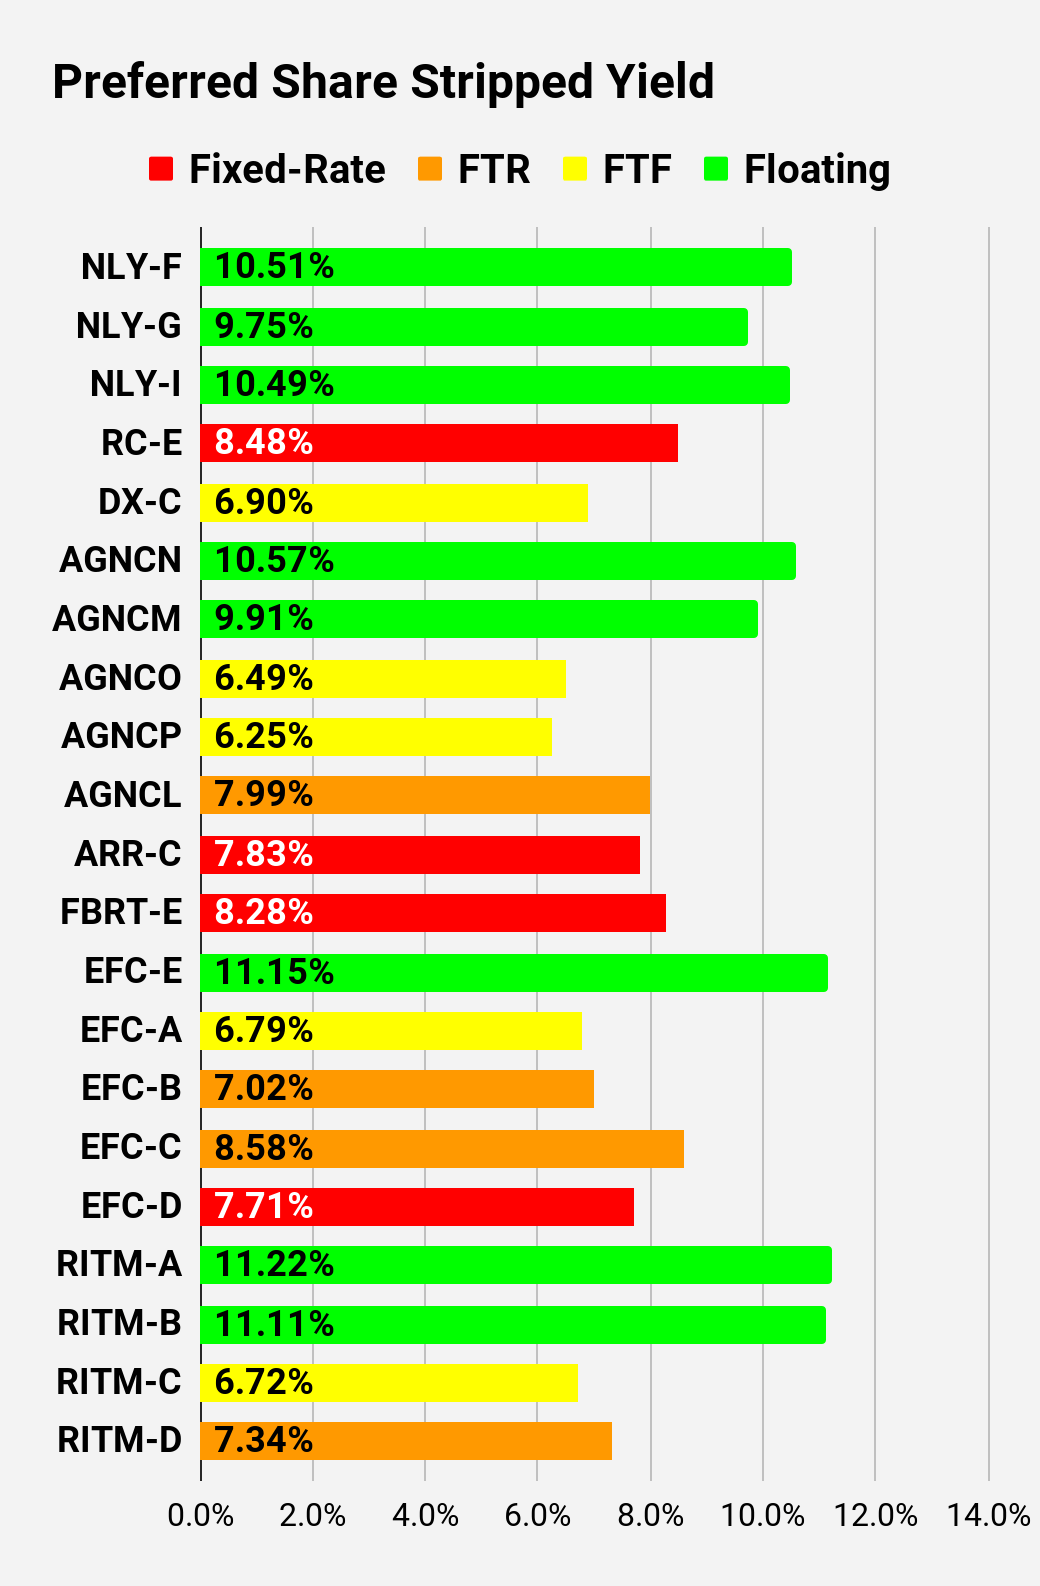 The REIT Forum | 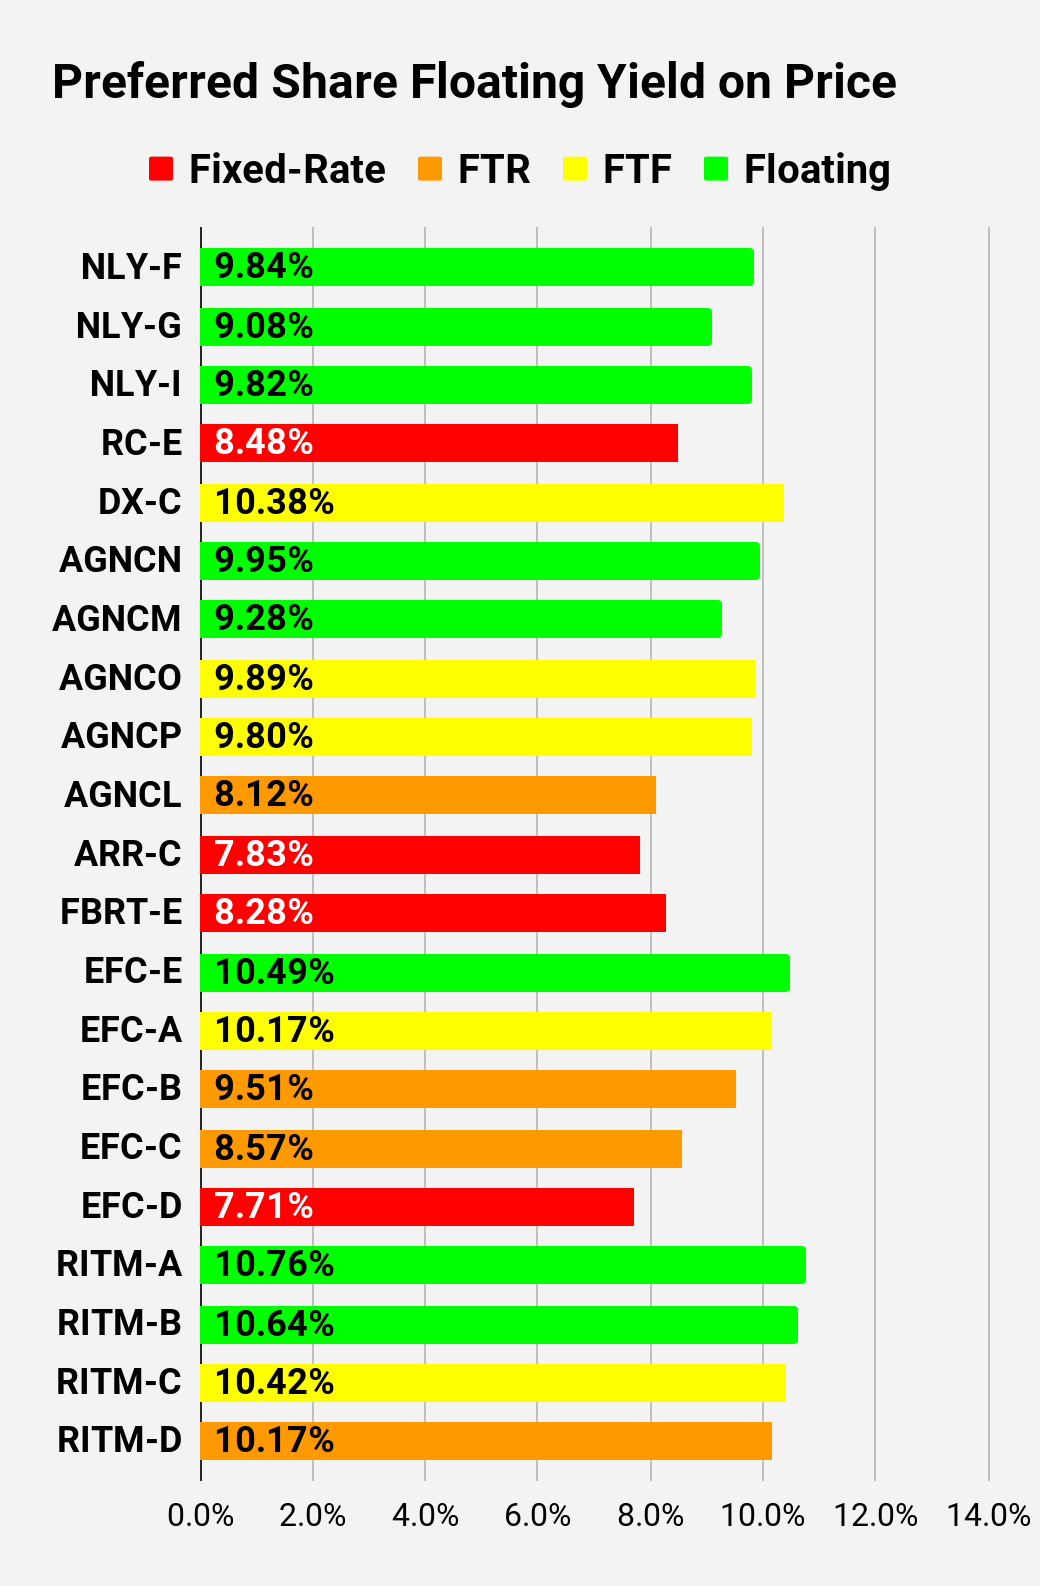 The REIT Forum |
 The REIT Forum | 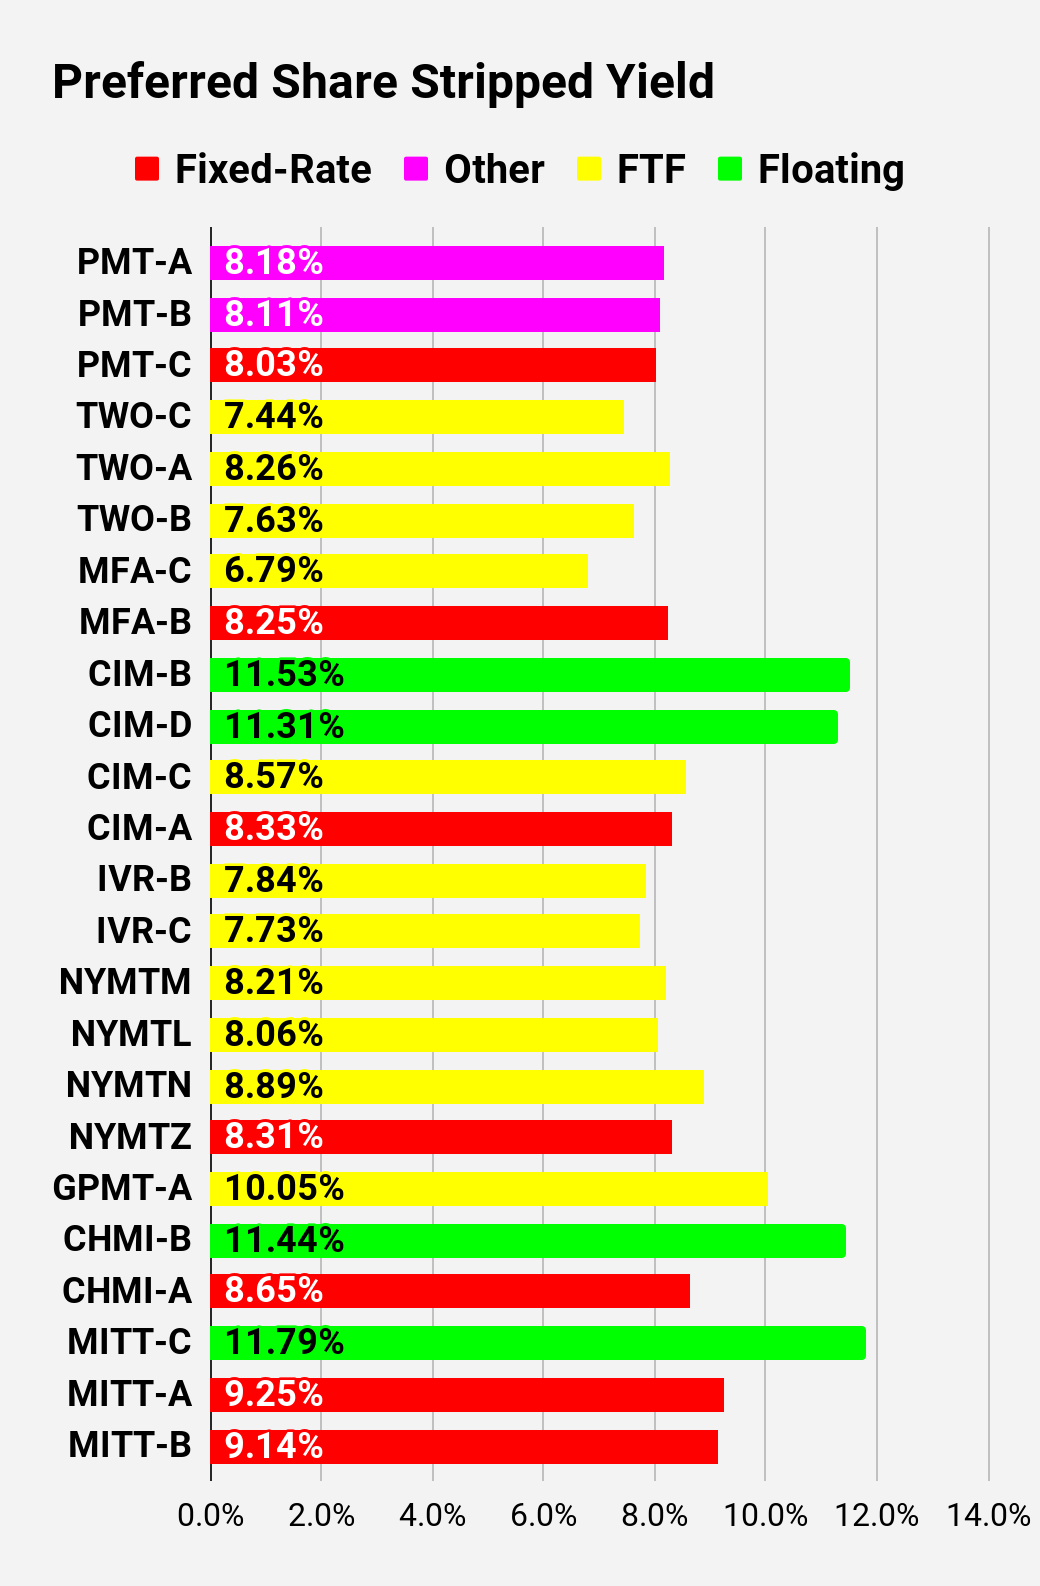 The REIT Forum | 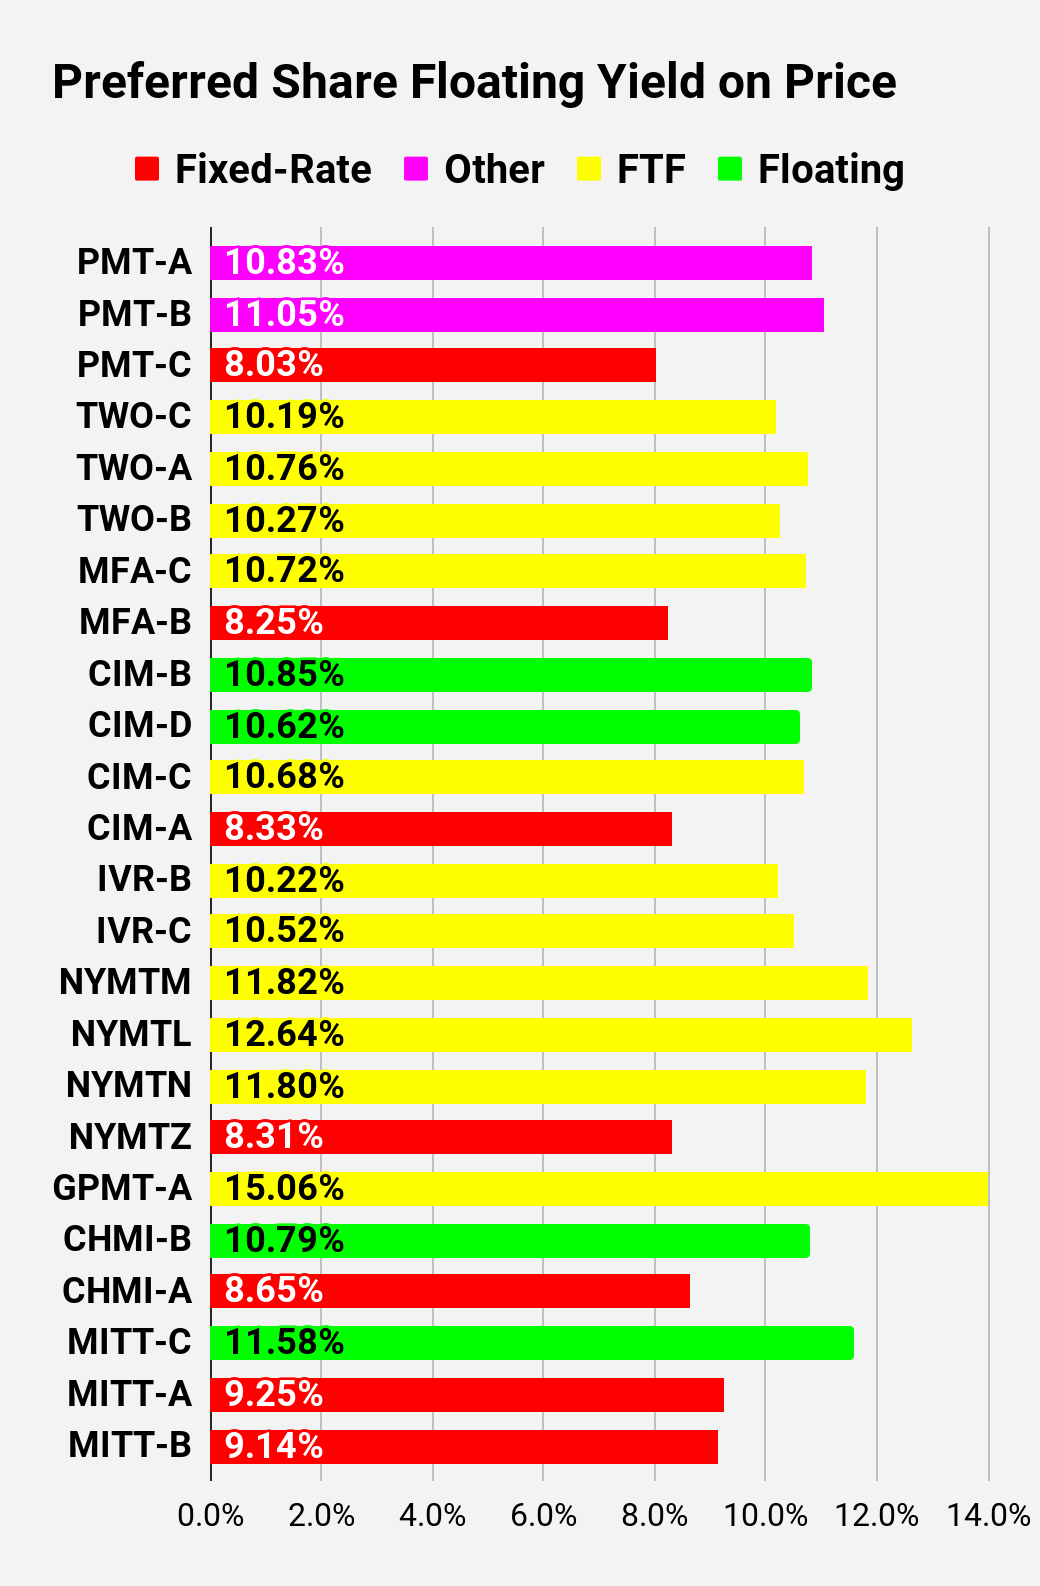 The REIT Forum |
Note: Shares that are classified as “Other” are not necessarily the same. Within The REIT Forum, we provide further distinction. For the purpose of these charts, I lumped all of them together as “Other”. Now there are only two left, PMT-A and PMT-B. Those both have the same issue. Management claims the shares will be fixed-rate, even though the prospectus says they should be fixed-to-floating.
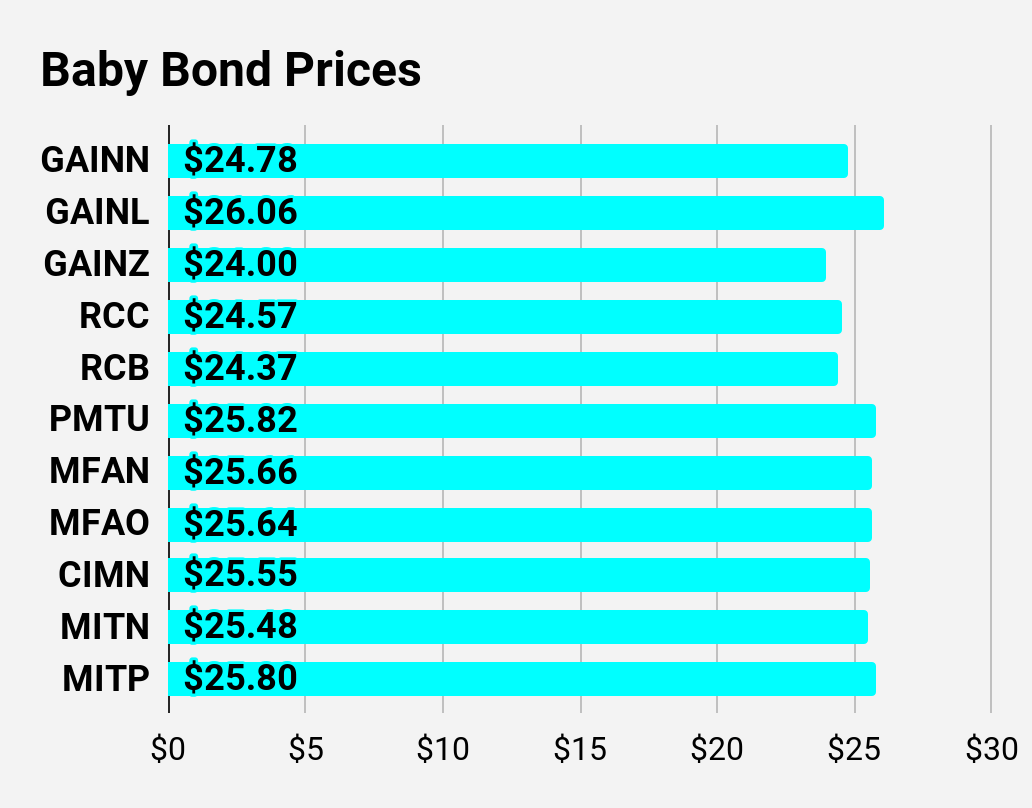
Preferred Share Data
Beyond the charts, we’re also providing our readers with access to several other metrics for the preferred shares.
After testing out a series on preferred shares, we decided to try merging it into the series on common shares. After all, we are still talking about positions in mortgage REITs. We don’t have any desire to cover preferred shares without cumulative dividends, so any preferred shares you see in our column will have cumulative dividends. You can verify that by using Quantum Online. We’ve included the links in the table below.
To better organize the table, we needed to abbreviate column names as follows:
- Price = Recent Share Price - Shown in Charts
- S-Yield = Stripped Yield - Shown in Charts
- Coupon = Initial Fixed-Rate Coupon
- FYoP = Floating Yield on Price - Shown in Charts
- NCD = Next Call Date (the soonest shares could be called)
- Note: For all FTF issues, the floating rate would start on NCD.
- WCC = Worst Cash to Call (lowest net cash return possible from a call)
- QO Link = Link to Quantum Online Page
Ticker | Price | S-Yield | Coupon | FYoP | NCD | WCC | QO Link | P-Link |
$24.78 | 6.21% | 5.00% | 6.21% | 10/24/2024 | $0.51 | |||
$26.06 | 7.27% | 8.00% | 7.27% | 8/1/2025 | $0.94 | |||
$24.00 | 6.32% | 4.88% | 6.32% | 10/24/2024 | $1.28 | |||
$24.57 | 7.94% | 5.75% | 7.94% | 10/24/2024 | $0.76 | |||
$24.37 | 8.50% | 6.20% | 8.50% | 10/24/2024 | $0.99 | |||
$25.82 | 7.72% | 8.50% | 7.72% | 9/30/2025 | $1.30 | |||
$25.66 | 8.92% | 8.88% | 8.92% | 2/15/2026 | $2.67 | |||
$25.64 | 8.88% | 9.00% | 8.88% | 8/15/2026 | $3.85 | |||
$25.55 | 8.96% | 9.00% | 8.96% | 5/15/2026 | $3.38 | |||
$25.48 | 9.56% | 9.50% | 9.56% | 2/15/2026 | $3.09 | |||
$25.80 | 9.23% | 9.50% | 9.23% | 5/15/2026 | $3.35 |
Second batch:
Ticker | Price | S-Yield | Coupon | FYoP | NCD | WCC | QO Link | P-Link |
$25.36 | 10.51% | 10.58% | 9.84% | 10/24/2024 | -$0.18 | |||
$25.19 | 9.75% | 9.76% | 9.08% | 10/24/2024 | -$0.02 | |||
$25.39 | 10.49% | 10.58% | 9.82% | 10/24/2024 | -$0.21 | |||
$19.57 | 8.48% | 6.50% | 8.48% | 6/10/2026 | $8.47 | |||
$25.41 | 6.90% | 6.90% | 10.38% | 4/15/2025 | $0.88 | |||
$25.83 | 10.57% | 10.66% | 9.95% | 10/24/2024 | -$0.12 | |||
$25.50 | 9.91% | 9.88% | 9.28% | 10/24/2024 | $0.16 | |||
$25.43 | 6.49% | 6.50% | 9.89% | 10/24/2024 | $0.01 | |||
$24.88 | 6.25% | 6.13% | 9.80% | 4/15/2025 | $1.26 | |||
$24.70 | 7.99% | 7.75% | 8.12% | 10/15/2027 | $6.58 | |||
$22.39 | 7.83% | 7.00% | 7.83% | 1/28/2025 | $3.19 | |||
$23.10 | 8.28% | 7.50% | 8.28% | 10/24/2024 | $2.42 | |||
$25.25 | 11.15% | 11.25% | 10.49% | 10/24/2024 | -$0.09 | |||
$25.26 | 6.79% | 6.75% | 10.17% | 10/30/2024 | $0.16 | |||
$22.65 | 7.02% | 6.25% | 9.51% | 1/30/2027 | $6.26 | |||
$25.65 | 8.58% | 8.63% | 8.57% | 04/30/2028 | $7.44 | |||
$22.71 | 7.71% | 7.00% | 7.71% | 10/24/2024 | $2.39 | |||
$25.46 | 11.22% | 11.18% | 10.76% | 10/24/2024 | $0.06 | |||
$25.35 | 11.11% | 11.02% | 10.64% | 10/24/2024 | $0.17 | |||
$24.02 | 6.72% | 6.38% | 10.42% | 2/15/2025 | $1.78 | |||
$24.20 | 7.34% | 7.00% | 10.17% | 11/15/2026 | $4.73 |
Third batch:
Ticker | Price | S-Yield | Coupon | FYoP | NCD | WCC | QO Link | P-Link |
$24.96 | 8.18% | 8.13% | 10.83% | 10/24/2024 | $0.26 | |||
$24.81 | 8.11% | 8.00% | 11.05% | 10/24/2024 | $0.41 | |||
$21.13 | 8.03% | 6.75% | 8.03% | 8/24/2026 | $7.15 | |||
$24.73 | 7.44% | 7.25% | 10.19% | 1/27/2025 | $1.18 | |||
$25.00 | 8.26% | 8.13% | 10.76% | 4/27/2027 | $5.58 | |||
$25.38 | 7.63% | 7.63% | 10.27% | 7/27/2027 | $5.33 | |||
$24.05 | 6.79% | 6.50% | 10.72% | 3/31/2025 | $1.79 | |||
$22.86 | 8.25% | 7.50% | 8.25% | 10/24/2024 | $2.30 | |||
$24.84 | 11.53% | 11.38% | 10.85% | 10/24/2024 | $0.32 | |||
$24.40 | 11.31% | 10.97% | 10.62% | 10/24/2024 | $0.76 | |||
$22.72 | 8.57% | 7.75% | 10.68% | 9/30/2025 | $4.20 | |||
$24.14 | 8.33% | 8.00% | 8.33% | 10/24/2024 | $0.97 | |||
$24.81 | 7.84% | 7.75% | 10.22% | 12/27/2024 | $0.67 | |||
$24.35 | 7.73% | 7.50% | 10.52% | 9/27/2027 | $6.27 | |||
$24.45 | 8.21% | 7.88% | 11.82% | 1/15/2025 | $1.53 | |||
$21.73 | 8.06% | 6.88% | 12.64% | 10/15/2026 | $7.13 | |||
$22.96 | 8.89% | 8.00% | 11.80% | 10/15/2027 | $8.53 | |||
$21.48 | 8.31% | 7.00% | 8.31% | 1/15/2027 | $7.89 | |||
$17.82 | 10.05% | 7.00% | 15.06% | 11/30/2026 | $11.32 | |||
$25.12 | 11.44% | 11.18% | 10.79% | 10/24/2024 | $0.65 | |||
$24.20 | 8.65% | 8.20% | 8.65% | 10/24/2024 | $1.37 | |||
$24.80 | 11.79% | 11.60% | 11.58% | 10/24/2024 | $0.49 | |||
$22.45 | 9.25% | 8.25% | 9.25% | 10/24/2024 | $2.75 | |||
$22.03 | 9.14% | 8.00% | 9.14% | 10/24/2024 | $3.17 | |||
$25.12 | 11.70% | 11.44% | 11.09% | 10/24/2024 | $0.55 | |||
$23.46 | 8.56% | 7.88% | 8.56% | 5/21/2026 | $5.10 |
Strategy
Our goal is to maximize total returns. We achieve those most effectively by including “trading” strategies. We regularly trade positions in the mortgage REIT common shares and BDCs because:
- Prices are inefficient.
- Long-term, share prices generally revolve around book value.
- Short-term, price-to-book ratios can deviate materially.
- Book value isn’t the only step in analysis, but it is the cornerstone.
We also allocate to preferred shares and equity REITs. We encourage buy-and-hold investors to consider using more preferred shares and equity REITs.
If you would like notifications as to when my new articles are published, please hit the button at the bottom of the page to "Follow" me.
Want the best research? It’s time to raise your game. Get access to several features you won’t find on the public side.
You can get access to everything we have to offer right now. Try our service and decide for yourself.