mohd izzuan/iStock via Getty Images
Fixed Income Market Review | ||
Yields and Spreads | 03/31/2024 | 06/30/2024 |
2 Year U.S. Treasury Yield | 4.62% | 4.72% |
10 Year U.S. Treasury Yield | 4.20% | 4.37% |
2-10 U.S. Treasury Yield Spread | -42 bps | -35 bps |
Bloomberg U.S. Corporate Investment Grade Bond Index Spread (OAS) | 90 bps | 94 bps |
ICE BofA U.S. High Yield Constrained Index Spread (OAS) | 315 bps | 321 bps |
Returns | Q2 2024 | YTD |
Bloomberg Aggregate Index Return | 0.07% | -0.71% |
Bloomberg U.S. Corporate Investment Grade Bond Index Return | -0.09% | -0.49% |
Bloomberg U.S. CMBS Index Return | 0.86% | 3.10% |
Bloomberg U.S. ABS Index Return | 0.98% | 1.66% |
Bloomberg U.S. MBS Index Return | 0.07% | -0.98% |
ICE BofA U.S. High Yield Constrained Index Return | 1.09% | 2.60% |
Credit Suisse Leveraged Loan Index | 1.87% | 4.51% |
ICE BofA U.S. Convertible Index Return | -0.21% | 2.12% |
| Source: FactSet. Past performance is not a reliable indicator or guarantee of future results. Due to market volatility, the market may not perform in a similar manner in the future. Indexes are unmanaged, do not reflect the deduction of fees or expenses, and are not available for direct investment. The index data provided is not representative of any Lord Abbett product. |
- Fixed income market performance was mixed in the second quarter. Yields rose across the curve as market expectations for the number of interest rate cuts in 2024 were scaled back in the face of somewhat stubborn inflation and still-robust job growth. The hawkish shift was reinforced after the Summary of Economic Projections (SEP) from the June Federal Open Market Committee (FOMC) meeting indicated a median policymaker forecast for one rate cut (down from three in the March SEP). Additionally, the soft-landing narrative gained traction in Q2 as continued disinflation was accompanied by some signs of gradual economic slowdown. May core Consumer Price Index (CPI) came in at 3.4%, which was its lowest year-over-year level since August 2021. However, concerns remain about the health of the consumer, the potential for rising unemployment, worries about bumpy disinflation and a sluggish Fed rate response.[1]
- U.S. High Yield continued to exhibit positive returns, gaining +1.09% over the quarter.[2] Short duration high yield also showed positive gains of +1.34%, outperforming the broader high yield index. The asset class benefitted from resilient economic growth, albeit somewhat softer than the prior quarter, as well as the continued trend in disinflation. Within high yield, higher-quality credit led the way with BBs up +1.15%, outperforming both Bs and CCCs which returned +1.03% and -0.15%, respectively.[3] Entertainment and Film, Healthcare and Publishing/Printing were the top-performing sectors of the high yield market. In contrast, Broadcasting, Cable/Satellite TV and Telecommunications lagged. High yield issuance also continued to be robust, with $78 billion in new supply in the second quarter, following $80 billion in the first quarter.[4] Default volume was also minimal over the quarter, with the par-weighted U.S. high yield bond default rate falling to 1.79% over the last twelve months, down over 100 bps from the start of the year.[4]
Fund Review
- The Fund returned 1.52%, reflecting performance at the net asset value (NAV) of Class I shares with all distributions reinvested for the quarter ended June 30, 2024. The Fund's benchmark, the ICE BofA HY US Corp Cash Pay BB-B 1-5Yrs USD Index*, returned 1.34% during the same period.
- Security selection within sectors such as Energy and Basic Industry also contributed to relative performance. This was reflected in overweight positions to several issuers in E&P and Metals and Mining subsectors that benefited from tailwinds such as strong economic performance and elevated commodity prices. An underweight allocation to the Media sector, specifically to the Cable and Satellite TV subsector, which has continued to underperform the index throughout the year, also contributed. An allocation to CCC credit also contributed to relative performance over the quarter. While CCCs broadly underperformed higher-rated credit tiers in the period, the Fund benefited from strong security selection, reflected in overweight positions to several issuers in Chemicals, Communications Services and Leisure sectors that outperformed. An allocation to bank loans also contributed, as loans outperformed fixed-rate bonds due to their more limited duration profiles.
- The Fund's underweight allocation to and security selection within the Healthcare sector was a detractor from relative performance. Healthcare was one of the stronger performing sectors in the second quarter, led by better financial performance by several larger issuers in the index. The Fund was specifically underweight select issuers in the Pharmaceuticals subsectors that outperformed as they received positive news on trials for several key drug developments. Security selection within the Services sector also detracted from relative performance, as the Fund was overweight companies in the Diversified Consumer Service subsector that underperformed following subpar earnings results.
Fund Positioning
>We continued to be overweight B-rated credits.
The Fund remained overweight allocation to Bs relative to the benchmark, while underweight BBs. We believe that exposure to lower-rated credit currently offers the best relative value, given the overall strength of the economy. While we are still constructive on credit in general given the resilience in the U.S. economy, we increased the Fund's exposure to BBs towards the latter end of the quarter as a reflection of economic data that was softer than expected.
> We favor cyclical sector exposure, specifically overweight allocations to Energy and Basic Industry sectors.
Despite softer economic data, we remained constructive in cyclical sectors such as Energy and Basic Industry as a result of improved credit quality and stickier inflation. Within Energy, we remain focused on E&P and Oil Field Services subsectors, but with a shift in focus towards offshore energy as an attractive opportunity to find relative value. Within Basic Industry, primary overweights continued to be Metals and Mining and Chemicals, which continued to benefit from meaningful destocking of inventories over the last several months. The Fund also continues to be overweight sectors such as Financial Services and Banking. Conversely, the Fund finished the quarter underweight sectors such as Leisure, Capital Goods and Real Estate.
> The Fund maintained modest exposure to off-benchmark sectors.
We generally believe that select exposures to non-high yield sectors can offer attractive risk-reward opportunities, potential portfolio diversification benefits, and avenues for liquidity. While the Fund has the flexibility to toggle allocations to off-benchmark asset classes, such as bank loans and convertible bonds, we continue to view high yield corporate bonds as relatively attractive compared to other sectors.
Outlook
> We view short duration high yield as an opportunity to capture quality carry.
We remain constructive in short-dated high yield credit considering the overall health of the U.S. economy, relatively open capital markets and benign default rate outlook. Additionally, fundamentals for high yield issuers have been robust, with leverage and interest rate coverage remaining at supportive levels. However, we acknowledge that the presence of higher policy rates for longer may lead to headwinds for certain high yield bond issuers, highlighting the importance of sound credit selection within the portfolio. Looking towards the second half of the year, we remain focused on maintaining a cyclical approach in the portfolio with emphasis on commodities, consumer cyclicals, and sectors with supportive underlying asset valuation that could allow for ongoing addressing of near-term maturities. However, we look to be more dynamic with our positioning given the potential for market fluctuations in response to some of the softer than expected macroeconomic data of late, including segments of rising consumer stress.
Credit Quality Distribution
*Index Data Source: ICE Data Indices, LLC. Due to rounding, the percentage allocation of the portfolio breakdown may not equal 100%. Portfolio breakdown as of 06/30/2024.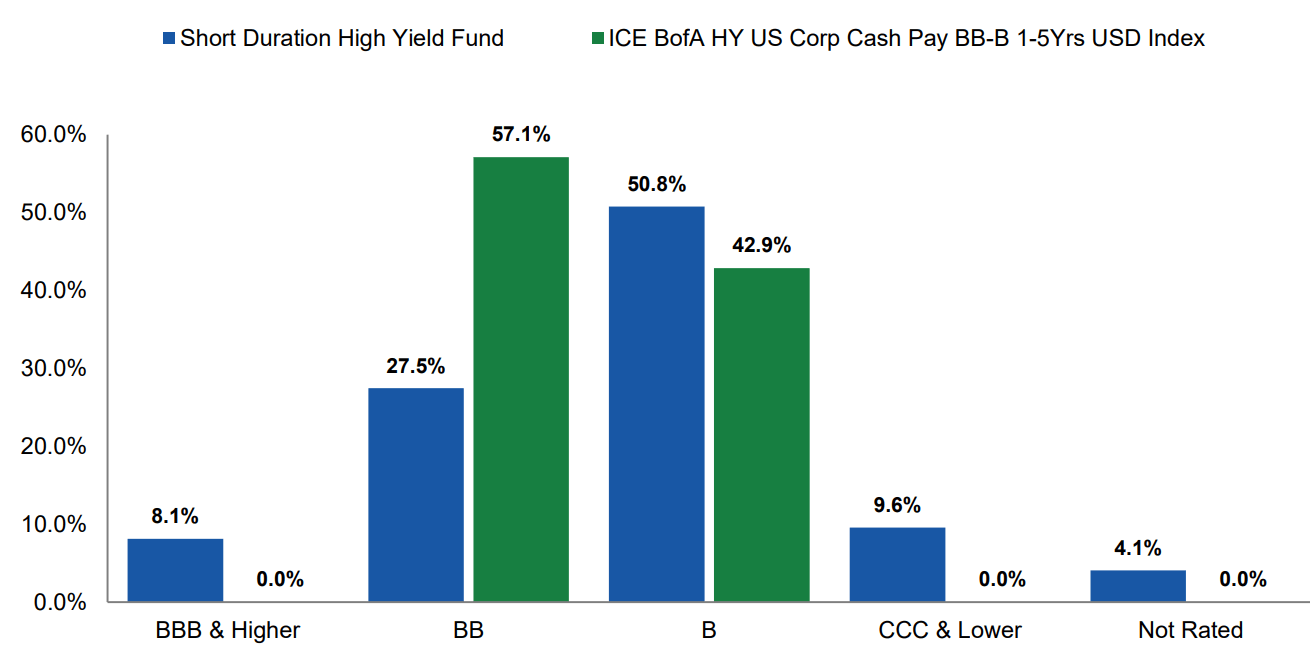
| Performance as of 06/30/2024
A Note about Risk: The Fund is subject to the general risks associated with investing in debt securities, including market, credit, liquidity, and interest rate risk. The Fund invests primarily in high-yield, lower-rated securities, sometimes called junk bonds. These securities carry increased risks of price volatility, illiquidity, and the possibility of default in the timely payment of interest and principal. The Fund may invest in foreign or emerging market securities, which may be adversely affected by economic, political, or regulatory factors and subject to currency volatility and greater liquidity risk. The Fun d may invest in derivatives, which are subject to greater liquidity, leverage, and counterparty risk. These factors can affect Fund performance. The Fund's Fund is actively managed and is subject to change. Ratings (other than U.S. Treasury securities or securities issued or backed by U.S. agencies) provided by Standard & Poor's, Moody's, and Fitch. For certain securities that are not rated by any of these three agencies, credit ratings from other agencies may be used. Where the rating agencies rate a security differently, Lord Abbett uses the median, but if there are only two ratings, the lower is used. Ratings range from AAA (highest) to D (lowest). Bonds rated BBB or above are considered investment grade. Credit ratings BB and below are lower-rated securities (junk bonds). High-yielding, non-investment-grade bonds (junk bonds) involve higher risks than investment-grade bonds. Adverse conditions may affect the issuer's ability to pay interest and principal on these securities. A portion of the Fund's securities may not be rated. Breakdown is not an S&P credit rating or an opinion of S&P as to the creditworthiness of such Fund. Ratings apply to the credit worthiness of the issuers of the underlying securities and not the fund or its shares. Ratings may be subject to change. The performance table above is based on Class I shares. Average Annual Total Returns are based on changes in the net asset value and assume reinvestment of all distributions, and do not reflect deduction of any front -end sales charges which are not applicable for Class I shares. Returns for less than one year are not annualized. ICE BofA Index Information: Source ICE Data Indices, LLC ("ICE"), used with permission. ICE PERMITS USE OF THE ICE BofA INDICES AND RELATED DATA ON AN "AS IS" BASIS, MAKES NO WARRANTIES REGARDING SAME, DOES NOT GUARANTEE THE SUITABILITY, QUALITY, ACCURACY, TIMELINESS, AND/OR COMPLETENESS OF THE ICE BofAML INDICES OR ANY DATA INCLUDED IN, RELATED TO, OR DERIVED THEREFROM, ASSUMES NO LIABILITY IN CONNECTION WITH THE USE OF THE FOREGOING, AND DOES NOT SPONSOR, ENDORSE, OR RECOMMEND LORD ABBETT, OR ANY OF ITS PRODUCTS OR SERVICES. Bloomberg Index Information: Source: Bloomberg Index Services Limited. BLOOMBERG® is a trademark and service mark of Bloomberg Finance L.P. and its affiliates (collectively "Bloomberg"). Bloomberg owns all proprietary rights in the Bloomberg Indices. Bloomberg does not approve or endorse this material, or guarantee the accuracy or completeness of any information herein, or make any warranty, express or implied, as to the results to be obtained therefrom and, to the maximum extent allowed by law, shall not have any liability or responsibility for injury or damages arising in connection therewith. The views and information discussed in this commentary are as of June 30, 2024, are subject to change, and may not reflect the views of the firm as a whole. The views expressed in market commentaries are at a specific point in time, are opinions only, and should not be relied upon as a forecast, research, or investment advice regarding a particular investment or the markets in general. Information discussed should not be considered a recommendation to purchase or sell securities. The information provided is not directed at any investor or category of investors and is provided solely as general information about Lord Abbett's products and services and to otherwise provide general investment education. None of the information provided should be regarded as a suggestion to engage in or refrain from any investment-related course of action as neither Lord Abbett nor its affiliates are undertaking to provide impartial investment advice, act as an impartial adviser, or give advice in a fiduciary capacity. If you are an individual retirement investor, contact your financial advisor or other fiduciary about whether any given investment idea, strategy, product or service may be appropriate for your circumstances. Investors should carefully consider the investment objectives, risks, charges, and expenses of the Lord Abbett Funds. This and other important information is contained in the fund's summary prospectus and/or prospectus. To obtain a prospectus or summary prospectus on any Lord Abbett mutual fund, contact your investment professional, Lord Abbett Distributor LLC at (888) 522-2388 or visit us at Welcome | Lord, Abbett & Co LLC | Lord Abbett. Read the prospectus carefully before you invest. NOT FDIC INSURED-NO BANK GUARANTEE-MAY LOSE VALUE |
Editor's Note: The summary bullets for this article were chosen by Seeking Alpha editors.