Martin Barraud
Performance
| Performance and Expenses (%) Average Annual Total Return Through 9/30/24 | ||
RIP | MSCI ACWI X USA SC | |
Third Quarter 2024¹ | 7.36 | 8.90 |
Year-to-Date¹ | 2.27 | 11.93 |
One-Year | 14.01 | 23.25 |
Three-Year | -7.58 | 1.39 |
Five-Year | 2.50 | 8.21 |
10-Year | 5.71 | 6.08 |
Since Inception (12/31/10) | 5.40 | 5.49 |
ANNUAL EXPENSE RATIO (%) | ||
Gross Operating Expenses | 1.61 | |
Net Operating Expenses | 1.44 | |
[¹] Not Annualized | ||
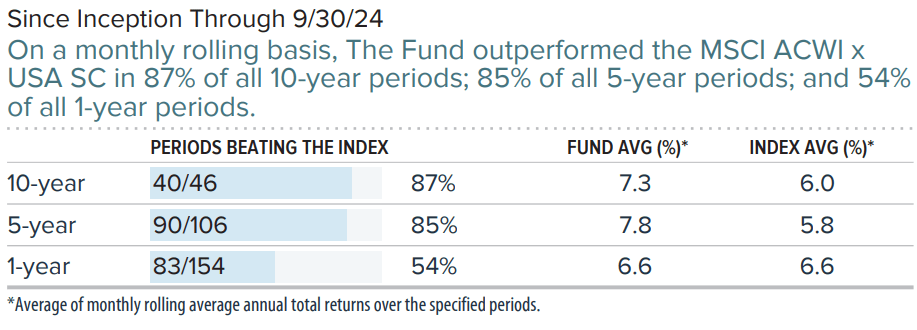
Relative Returns: Monthly Rolling Average Annual Return Periods
| Important Performance and Expense Information All performance information reflects past performance, is presented on a total return basis, reflects the reinvestment of distributions, and does not reflect the deduction of taxes that a shareholder would pay on fund distributions or the redemption of fund shares. Past performance is no guarantee of future results. Investment return and principal value of an investment will fluctuate, so that shares may be worth more or less than their original cost when redeemed. Current month-end performance may be higher or lower than performance quoted and may be obtained at www.royceinvest.com. All performance information represents Service Class results. Gross operating expenses reflect the Fund’s total gross annual operating expenses for the Service Class and include management fees, 12b-1 distribution and service fees, and other expenses. Net operating expenses reflect contractual fee waivers and/or expense reimbursements. All expense information is reported as of the Fund’s most current prospectus. Royce has contractually agreed, without right of termination, to waive fees and/or reimburse expenses to the extent necessary to maintain the Service Class’s net annual operating expenses (excluding brokerage commissions, taxes, interest, litigation expenses, acquired fund fees and expenses, and other expenses not borne in the ordinary course of business) at or below 1.44% through April 30, 2025. The Fund may invest a significant portion of its assets in foreign companies, which may be subject to different risks than investments in securities of U.S. companies, including adverse political, social, economic, currency, or other developments that are unique to a particular country or region. (Please see “Investing in Foreign Securities” in the prospectus.) Therefore, the prices of the securities of foreign companies in particular countries or regions may, at times, move in a different direction than those of the securities of U.S. companies. (Please see “Primary Risks for Fund Investors” in the prospectus.) The Fund generally invests a significant portion of its assets in a limited number of stocks, which may involve considerably more risk than a more broadly diversified portfolio because a decline in the value of any of these stocks would cause the Fund’s overall value to decline to a greater degree. The Fund invests primarily in small-cap stocks, which may involve considerable more risk than investing in larger- cap stocks. (Please see “Primary Risks for Fund Investors” in the prospectus.) The thoughts concerning recent market movements and future prospects for smaller-company stocks are solely those of Royce Investment Partners and, of course, there can be no assurance with regard to future market movements. This material is not authorized for distribution unless preceded or accompanied by a current prospectus. Please read the prospectus carefully before investing or sending money. Distributor: Royce Fund Services, LLC |
Manager Commentary
Company, Industry, and Sector Impact
- Royce International Premier Fund advanced 7.4% for the quarter, lagging its benchmark, MSCI ACWI ex USA Small Cap Index, which was up 8.9% for the same period. The portfolio was lagging the MSCI ACWI ex USA Small Cap Index for the year-to-date period ended 9/30/24, up 2.3% versus 11.9%.
- Seven of the portfolio’s eight sectors made a positive impact on quarterly performance. The sectors making the largest positive contributions were Industrials, Information Technology and Health Care while the only negative impact came from Energy.
- At the industry level, software (Information Technology), professional services (Industrials), and capital markets (Financials) contributed most for the quarter, while construction & engineering (Industrials), financial services (Financials), and diversified consumer services (Consumer Discretionary) were the largest detractors. The portfolio’s top contributor at the position level for the quarter was Kardex Holding (OTCPK:KRDXF) while the top detractor was Johns Lyng Group (OTCPK:JLGRF).
- At the country level, Japan, Switzerland, and Italy contributed most for the quarter, while Australia, Singapore, and South Korea were the largest detractors.
- The portfolio’s disadvantage versus its benchmark was primarily attributable to sector allocation in the quarter, with the Real Estate, Consumer Discretionary and Industrials sectors making the most significant negative impact versus the benchmark. Conversely, Information Technology, Communication Services and Energy contributed most to relative quarter results.
- Five of the portfolio’s nine sectors made a positive impact on year-to-date period performance. The sectors making the largest positive contributions were Industrials, Information Technology and Communication Services, while the largest negative impacts came from Materials, Health Care and Consumer Discretionary.
- At the industry level, professional services (Industrials), electronic equipment, instruments & components (Information Technology), and commercial services & supplies (Industrials) contributed most for the year-to-date period, while chemicals (Materials), construction & engineering (Industrials), and health care providers & services (Health Care) were the largest detractors. The portfolio’s top contributor at the position level for the year-to-date period was Marlowe (OTCPK:MRLWF) while the top detractor was Johns Lyng Group.
- At the country level, Sweden, Switzerland, and United Kingdom contributed most for the year-to-date period, while Australia, Brazil, and Israel were the largest detractors.
- The portfolio’s disadvantage versus its benchmark was primarily attributable to stock selection in the year-to-date period, with the Industrials, Health Care and Information Technology sectors making the most significant negative impact versus the benchmark. Conversely, Communication Services, Real Estate and Energy contributed most to relative year-to-date period results.
Outlook
- We were encouraged by developments in the third quarter. Our holdings continued to deliver operationally as we expected, while we had a take-private offer for a position, making it the eighth consecutive quarter with take-private activity. We also witnessed several market shifts that should be constructive for our long-term approach and suggest mean reversion in our performance may be gaining momentum. First, the Federal Reserve cut rates for the first time in more than four years with a larger than usual reduction--which could benefit the portfolio not only because our holdings have consistently outperformed the benchmark when bond yields fall sharply, but also because the earnings of many of our positions could be enhanced with lower rates. For example, the Fund’s holdings in credit bureaus, listed private equity businesses, real estate classifieds business, and acquisition-led industry consolidators all benefit meaningfully when rates decline. Second, encouraging macroeconomic developments in some of our core markets are emerging. For example, Citi’s Economic Surprise Index, which measures the difference between economic results and forecasts, shows that the U.K. and Japan, our two largest country weights, stood out as having the most positive economic surprises in recent months. Finally, major foreign currencies sharply appreciated against the U.S. dollar, with the Japanese Yen as the clear standout, gaining approximately 12%. Considering the strong headwinds that worked against the Fund in recent years, we believe favorable changes in rates, macroeconomics, and currency can create tailwinds for our approach.
| As of 9/30/2024, the percentage of Portfolio assets was as follows Kardex Holding, 1.9%; Johns Lyng Group, 2.0%; Marlowe, 1.2%. The thoughts concerning recent market movements and future prospects for small-company stocks are solely those of Royce Investment Partners, and, of course, there can be no assurances with respect to future small-cap market performance. |


| Important Performance and Expense Information Investors should consider the investment goals, risks, fees and expenses of the Fund carefully before investing. The prospectus contains this and other important information about the Fund. To obtain a free prospectus, please visit www.royceinvest.com. Investors should read the prospectus carefully before investing. Past performance is no guarantee of future results. The Fund is actively managed with a long-term absolute return perspective. Holdings, country weightings, and sector weightings are subject to change. Source: Royce Investment Partners, based in part on data provided by FactSet. These figures are for analytical purposes only. This information should not be construed as investment advice or recommendations with respect to the countries listed. Country weightings may not be representative of the portfolio managers’ current or future investments and are subject to change at any time. The sum of all contributions to and detractions from performance for all securities would equal the Fund’s gross or net cumulative total return for the one-year period ended 9/30/24. Notes, Performance and Risk Disclosure This material is not authorized for distribution unless preceded or accompanied by a current prospectus. Please read the prospectus carefully before investing or sending money. All performance and risk information presented in this material reflects Service Class results. Shares of RIP’s Service Class bear an annual distribution expense that is not borne by the Investment Class. Past performance is not indicative of future results. The Fund invests primarily in small-cap stocks, which may involve considerably more risk than investing in larger-cap stocks. The Fund may invest a significant portion of its assets in foreign companies which may be subject to different risks than investments in securities of U.S. companies, including adverse political, social, economic, currency, or other developments that are unique to a particular country or region (Please see “Investing in Foreign Securities” in the prospectus). Therefore, the prices of the securities of foreign companies in particular countries or regions may, at times, move in a different direction than those of the securities of U.S. companies. (Please see “Primary Risks for Fund Investors” in the prospectus). The Fund also generally invests a significant portion of its assets in a limited number of stocks, which may involve considerably more risk than a more broadly diversified portfolio because a decline in the value of any one of these stocks would cause the Fund’s overall value to decline to a greater degree. Source: MSCI. MSCI makes no express or implied warranties or representations and shall have no liability whatsoever with respect to any MSCI data contained herein. The MSCI data may not be further redistributed or used as a basis for other indexes or any securities or financial products. This report is not approved, endorsed, reviewed or produced by MSCI. None of the MSCI data is intended to constitute investment advice or a recommendation to make (or refrain from making) any kind of investment decision and may not be relied on as such. The MSCI ACWI ex USA Small Cap Index is an unmanaged, capitalization-weighted index of global small-cap stocks, excluding the United States. Index returns include net reinvested dividends and/or interest income. All indexes referenced are unmanaged and capitalization weighted. Each index’s returns include net reinvested dividends and/or interest income. The performance of an index does not represent exactly any particular investment, as you cannot invest directly in an index. Sector and industry weightings are determined using the Global Industry Classification Standard (“GICS”). GICS was developed by, and is the exclusive property of, Standard & Poor’s Financial Services LLC (“S&P”) and MSCI Inc. (“MSCI”). GICS is the trademark of S&P and MSCI. “Global Industry Classification Standard (GICS)” and “GICS Direct” are service marks of S&P and MSCI. Distributor: Royce Fund Services, LLC Member FINRA, SIPC. Any information, statements and opinions set forth herein are general in nature, are not directed to or based on the financial situation or needs of any particular investor, and do not constitute, and should not be construed as, investment advice, a forecast of future events, a guarantee of future results, or a recommendation with respect to any particular security or investment strategy. Investors seeking financial advice regarding the appropriateness of investing in any securities or investment strategies should consult their financial professional. |
Editor's Note: The summary bullets for this article were chosen by Seeking Alpha editors.
Editor's Note: This article discusses one or more securities that do not trade on a major U.S. exchange. Please be aware of the risks associated with these stocks.